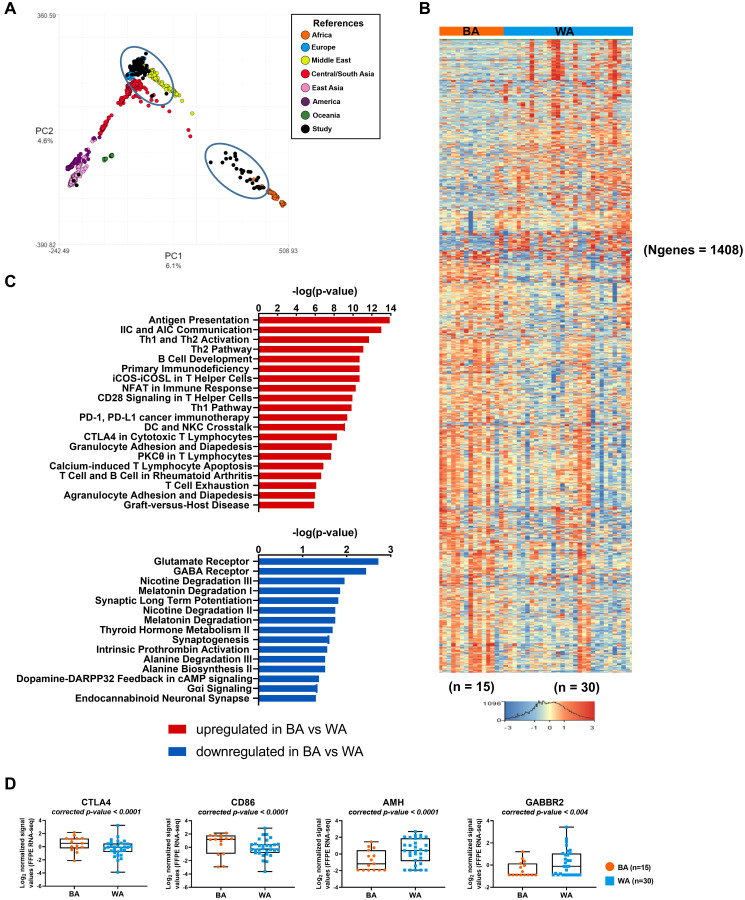
Figure 2. Transcriptome analysis of tumor samples of PCa patients with different geographical ancestries.
(A) Sample ancestry of 99 published PCa FFPE tissue samples (GSE54460) was determined using LASER (see Materials and Methods). Samples used in our comparisons are black and encircled. (B) Differential gene expression changes in clinically matched BA (n = 15) compared to WA (n = 30) prostate tumor samples (padj < 0.05 and ± 1.5-fold change). Red depicts up- and blue depicts downregulation. Clustered based on genes. N = number of genes. (C) Top 20 canonical pathways of upregulated differentially transcribed genes and top 15 canonical pathways of downregulated differentially transcribed genes in BA (n = 15) compared to WA (n = 30) prostate tumor samples, after Ingenuity Pathway Analysis (-log10 p value ≥ 1.30). (D) Scatter plots of differentially expressed immune checkpoint inhibitor genes and AMH (padj < 0.05 and ± 1.5-fold change) in BA (n = 15) versus WA (n = 30) PCa samples.

