

Abstract
Objectives
Real-time noninvasive monitoring of cerebral blood flow (CBF) during surgery is key to reducing mortality rates associated with adult cardiac surgeries requiring hypothermic circulatory arrest (HCA). We explored a method to monitor cerebral blood flow during different brain protection techniques using diffuse correlation spectroscopy (DCS), a noninvasive optical technique which, combined with frequency-domain near-infrared spectroscopy (FDNIRS), also provides a measure of oxygen metabolism.
Methods
We used DCS in combination with FDNIRS to simultaneously measure hemoglobin oxygen saturation (SO2), an index of cerebral blood flow (CBFi), and an index of cerebral metabolic rate of oxygen (CMRO2i) in 12 patients undergoing cardiac surgery with HCA.
Results
Our measurements revealed that a negligible amount of blood is delivered to the cerebral cortex during HCA with retrograde cerebral perfusion, indistinguishable from HCA-only cases (median CBFi drops of 93% and 95%, respectively) with consequent similar decreases in SO2 (mean decrease of 0.6 ± 0.1% and 0.9 ± 0.2% per minute, respectively); CBFi and SO2 are mostly maintained with antegrade cerebral perfusion; the relationship of CMRO2i to temperature is given by CMRO2i = 0.052e0.079T.
Conclusions
FDNIRS-DCS is able to detect changes in CBFi, SO2, and CMRO2i with intervention and can become a valuable tool for optimizing cerebral protection during HCA.
Key Words: antegrade cerebral perfusion, brain imaging, cerebral blood flow, diffuse correlation spectroscopy, hypothermic circulatory arrest, near-infrared spectroscopy, retrograde cerebral perfusion
Abbreviations and Acronyms: ACP, antegrade cerebral perfusion; CBFi, cerebral blood flow (index); CMRO2i, cerebral metabolic rate of oxygen (index); CPB, cardiopulmonary bypass; DCS, diffuse correlation spectroscopy; EEG, electroencephalography; FDNIRS, frequency-domain near-infrared spectroscopy; HCA, hypothermic circulatory arrest; NIRS, near-infrared spectroscopy; RCP, retrograde cerebral perfusion; rSO2, regional oxygen saturation; SO2, hemoglobin oxygen saturation; TCD, transcranial Doppler ultrasound
Graphical abstract
Real-time noninvasive cerebral blood flow monitoring during cardiac surgery could help optimize neuroprotective measures and hence decrease rates of neurologic injury associated with hypothermic circulatory arrests (HCAs). We used combined frequency-domain near-infrared spectroscopy and diffuse correlation spectroscopy (FDNIRS-DCS) to measure hemoglobin oxygen saturation (SO2), cerebral blood flow index (CBFi), and cerebral metabolic rate of oxygen (CMRO2i) in 12 adults undergoing HCA (4 HCA-only, 3 retrograde cerebral perfusion [RCP], 5 antegrade cerebral perfusion [ACP]). We coacquired regional oxygen saturation (rSO2) from a hospital oximeter (INVOS), mean arterial blood pressure (MAP), and nasopharyngeal temperature. Our measurements revealed that during HCA with RCP CBFi drops to almost zero and overshoots above baseline when circulation is restarted, similar to the CBFi behavior found during HCA-only. As a consequence of the low perfusion, with RCP and HCA-only SO2 decreases during HCA; in contrast, both CBFi and SO2 are mostly maintained with ACP.

Blood flow index drops to ∼0 at HCA with RCP. Oxygenation decreases 0.7% per minute.
Central Message.
Intraoperative DCS monitoring could offer insights into the effectiveness of different cerebral-protection methods in delivering blood flow to the brain during circulatory arrest.
Perspective.
Monitoring of cerebral blood flow index and hemoglobin oxygen saturation in cardiac surgery requiring HCA is possible with combined FDNIRS-DCS. We show that RCP may be inadequate whereas ACP could overcompensate in blood flow delivery to the cerebral cortex. Further studies are needed to confirm the role of FDNIRS-DCS in guiding optimization of cerebral blood perfusion to improve neurologic outcomes.
See Commentaries on pages 178 and 180.
Neurologic injury is one of the most dreaded complications in cardiac surgery. Maintenance of optimal brain blood flow during cardiac surgery is an essential part of ensuring patients' neurologic health. Among the cardiac surgical procedures, those imposing the greatest risk of neurologic injury include procedures requiring episodes of circulatory arrest. Hypothermia has been the mainstay of the surgical strategies to prevent cerebral ischemic injury during circulatory arrest (ie, hypothermic circulatory arrest [HCA])1 by lowering the brain's metabolic rate. Moderate (20.1°C-28°C) and deep (14.1°C-20°C) hypothermia levels help minimize neurologic injury.2,3 However, hypothermia alone doesn't always provide sufficient brain protection, as shown by the relatively high mortality rates during aortic arch surgeries.4 Thus, during HCA it has become common clinical practice to provide cerebral blood perfusion. The most common methods are retrograde and antegrade cerebral perfusion (RCP and ACP, respectively).5 During RCP, cold blood is delivered to the brain via retrograde flow in the venous system through a cannula placed in the superior vena cava, to ensure delivery of blood to the brain parenchyma. In selective ACP, the brain is perfused in an antegrade fashion via the arterial system, often unilaterally through the right axillary or innominate artery.
There is ongoing discussion regarding the best perfusion strategy for optimal neuroprotection during HCA.6, 7, 8 This is partially due to the complexity of clinical assessment of the impact of strategies on neurologic function as an end point and also to the limited ability to directly monitor cerebral blood flow noninvasively. In animal models, invasive approaches have demonstrated that RCP delivers much less blood to the cortex than ACP.9,10 These findings have not yet been thoroughly validated in cardiac surgery patients. Currently available techniques for noninvasive intraoperative brain monitoring in procedures include electroencephalography (EEG), cerebral oximetry, and transcranial Doppler ultrasound (TCD). While providing insights into brain protection efficacy in real time, these monitoring techniques each presents limitations. During deep HCA, EEG is used to ensure that hypothermia and anesthesia are maintaining complete suppression of electrical activity.11 While EEG measures neuronal activity, it does not provide a direct measure of oxygen metabolism, the biomarker that hypothermia acts on. Cerebral oximetry using near-infrared spectroscopy (NIRS) estimates regional hemoglobin oxygen saturation (rSO2) in the brain,12 but it cannot distinguish between rSO2 changes due to oxygen availability versus consumption. A drop in NIRS readings may indicate inadequate cerebral blood flow (CBF), but it could also indicate sustained oxygen consumption as a result of insufficient hypothermia or anesthesia. TCD is a powerful technique that measures blood flow velocity in the large basal arteries of the brain.13 However, TCD is not done routinely during HCA because of the requirement of stable positioning and alignment that needs to be done by a trained operator.14
Diffuse correlation spectroscopy (DCS) is a noninvasive optical technique that provides an index of cerebral blood flow (CBFi) and has been shown to effectively monitor blood flow in cardiac surgical procedures in neonates.15, 16, 17 DCS makes use of the speckle interference pattern formed when coherent light travels through a scattering medium. The pattern perturbs as the scatterers drift, and computing the intensity autocorrelation function g2(τ) estimates the velocity of moving scatterers.18 Since red blood cells form the overwhelming majority of moving scatterers in tissue, DCS provides an index of blood flow in the illuminated tissue (ie, scalp, skull, and brain).
Several studies have validated CBFi measures against gold standards,19, 20, 21, 22, 23 and it holds promise for differentiating pathologic conditions in adults.24,25 DCS measurements are conducted via a flexible lightweight patch probe that doesn't disturb the patient, and monitoring can be done continuously during surgery. Further, it is possible to use both NIRS and DCS synergistically to, in addition to CBFi and SO2, acquire an index of cerebral metabolic rate of oxygen (index) (CMRO2i), a more comprehensive measure of brain health.26 Simultaneous monitoring of these 3 biomarkers offers a comprehensive guide for optimizing brain protection during adult cardiac surgery with HCA.
In this study, we use a hybrid instrument combining frequency-domain near-infrared spectroscopy (FDNIRS) and DCS26 to monitor cerebral perfusion and oxygen metabolism during HCA procedures in an adult population (study outlined in Figure 1). This work demonstrates the feasibility of acquiring SO2, CBFi, and CMRO2i changes noninvasively during surgery and highlights the differences in cerebral perfusion delivered during HCA-only, RCP, and ACP.
Figure 1.

Real-time noninvasive cerebral blood flow monitoring during cardiac surgery could help optimize neuroprotective measures and hence decrease rates of neurologic injury associated with HCA. We used combined FDNIRS-DCS to measure hemoglobin SO2, CBFi, and CMRO2i in 12 adults undergoing HCA (4 HCA-only, 3 RCP, 5 ACP). We coacquired rSO2 from a hospital oximeter (INVOS; Medtronic, Minneapolis, Minn), MAP, and nasopharyngeal temperature. Our measurements revealed that during HCA with RCP CBFi drops to almost zero and overshoots above baseline when circulation is restarted, similar to the CBFi behavior found during HCA-only. As a consequence of the low perfusion, with RCP and HCA-only SO2 decreases during HCA; on in contrast, both CBFi and SO2 are mostly maintained with ACP. FDNIRS-DCS, Frequency domain near-infrared spectroscopy and diffuse correlation spectroscopy; CBFi, cerebral blood flow index; SO2, oxygen saturation; CMRO2i, cerebral metabolic rate of oxygen; rSO2, regional oxygen saturation; HCA, hypothermic circulatory arrest; RCP, retrograde cerebral perfusion; ACP, antegrade cerebral perfusion; MAP, mean arterial blood pressure.
Methods
Subjects
We enrolled 12 patients (7 male, mean age 61.8 ± 19.4 years) scheduled to undergo elective cardiac surgery with use of circulatory arrest between February 2017 and December 2019 at the Massachusetts General Hospital. Potential patients for HCA were approached during their preoperative visit. The study was explained to the patients by a physician, and they had until the day of the surgery to decide whether to participate and sign the informed consent. This study was reviewed and approved by the Partners Healthcare Human Research Committee (institutional review board #2016P001944; approved November 11, 2016).
Table 1 outlines the patients' demographic and intraoperative characteristics. Four patients underwent HCA-only, 3 RCP, and 5 ACP. The 3 groups were not randomized, and the choice of protection method was based on patients' disease and surgeons' preferences.
Table 1.
Demographics and intraoperative data of measured patients
| No. | Age, y | Sex | Operative procedure | Avg HCA temp, °C | Cerebral perfusion | HCA length | Optical modality | INVOS | Monitoring duration |
|---|---|---|---|---|---|---|---|---|---|
| 1 | 57 | M | Valve-sparing aortic root replacement + AAHR | 23.2 ± 0.2 | HCA-only | 12 m | DCS | No | 3 h, 30 min |
| 2 | 78 | M | CABG × 3 + AVR + ascending aortic replacement | 16.8 ± 0.2 | HCA-only | 25 m | DCS | No | 4 h, 52 min |
| 3 | 59 | F | Right pulmonary thromboendarterectomy + left lower lobe wedge resection | 19.6 ± 0.1, 19.4 ± 0.03 | HCA-only | 19 m, 12 m | FDNIRS-DCS | Yes | 4 h, 44 min |
| 4 | 87 | F | AVR + CABG × 1 + pulmonary vein isolation + LAA ligation + AAHR | 20.3 ± 0.2 | HCA-only | 29 m | FDNIRS-DCS∗ | Yes | 6 h, 56 min |
| 5 | 26 | M | Valve-sparing aortic root replacement + AAHR | 17.9 ± 0.1 | RCP | 17 m | DCS | No | 8 h, 02 min |
| 6 | 85 | F | AVR + pulmonary vein isolation + LAA ligation + AAHR | 18.4 ± 0.1 | RCP | 21 m | FDNIRS-DCS | Yes | 5 h, 33 min |
| 7 | 38 | M | AVR + AAHR | 18.2 ± 0.1 | RCP | 22 m | FDNIRS-DCS | Yes | 5 h, 30 min |
| 8 | 77 | M | AVR + AAHR | 24.9 ± 0.1 | ACP | 20 m | DCS | No | 6 h, 53 min |
| 9 | 49 | F | AVR + AAHR | 27.1 ± 0.1 | ACP | 14 m | FDNIRS-DCS | No | 4 h, 26 min |
| 10 | 67 | M | AAHR | 22.0 ± 0.7 | ACP | 20 m | FDNIRS-DCS | Yes | 3 h, 57 min |
| 11 | 45 | M | Redo sternotomy + total arch replacement | 20.2 ± 0.1 | ACP | 48 m | FDNIRS-DCS | Yes | 5 h, 57 min |
| 12 | 73 | M | Redo sternotomy + AVR + CABG × 4 + ascending aortic + Zone I aortic arch replacement | 18.8 ± 0.1 | ACP | 47 m | FDNIRS-DCS∗ | Yes | 10 h, 35 min |
Monitoring duration started immediately after anesthesia induction and ended after the procedure concluded. Patient 3 had 2 circulatory arrests. In 8 patients, we used combined FDNIRS-DCS, and only DCS in 4. Seven patients had bilateral cerebral oximetry (INVOS) acquired clinically. RCP flow rate was maintained at 300-400 mL/min to target a CVP of 20-25 mm Hg. Circulatory arrest time refers to the length of time the cardiopulmonary bypass flow to the heart was stopped (with or without cerebral perfusion). HCA, Hypothermic circulatory arrest; M, male; AAHR, ascending aortic and hemiarch replacement; DCS, diffuse correlation spectroscopy; CABG, coronary artery bypass grafting; AVR, aortic valve replacement; F, female; FDNIRS, frequency-domain near-infrared spectroscopy; LAA, left atrial appendage; RCP, retrograde cerebral perfusion with HCA; ACP, antegrade cerebral perfusion with HCA.
Interference with the INVOS made it so FDNIRS data are only available discontinuously.
FDNIRS-DCS Device
For these measurements, we used a commercial combined FDNIRS-DCS system, MetaOx (ISS Inc, Champaign, Ill). Details about this device can be found in Carp and colleagues, and in Video 1.26 In 4 subjects, only the DCS component was used, and in the rest both DCS and FDNIRS data were acquired simultaneously. The DCS component employed a single 35 mW, 850 nm laser and 8 single-photon avalanche detectors. The FDNIRS component included eight 2-mW lasers of wavelength ranging between 670 and 830 nm, and 4 photomultiplier tube detectors. The fiber-optic probe used is shown in Figure 2.
Figure 2.

A, Photograph of our optical probe on a patient: A = FDNIRS-DCS optical probe, B = hospital INVOS oximeter probe, C = processed electroencephalogram probe. B, Schematic of the FDNIRS-DCS probe. NIRS and DCS light source fibers (dark red square) are colocalized and diffused over a 3.5-mm spot diameter to meet American National Standards Institute standard irradiance limits. A DCS short separation detector fiber (light blue) is located 5 mm from the source center and used to detect scalp blood flow. Remaining DCS detector fibers (green) were located at 25 and 30 mm from the source for greater sensitivity to cerebral blood flow. For patients that also had FDNIRS measurements, in addition to the colocalized 25- and 30-mm detector fibers, we had 2 detector fibers located at 20 and 35 mm from the source, except for patient 9, where the 2 extra detectors were at 15 and 20 mm from the source. Multiple separations in FDNIRS allow for application of the multidistance method to calculate SO2. Note: our probe is small and lightweight and doesn't requires special training to correctly operate. FDNIRS-DCS, Frequency domain near-infrared spectroscopy and diffuse correlation spectroscopy.
Experimental Procedure
Electrocardiogram, pulse oximetry, cerebral oximetry (INVOS 5100c; Medtronic [Minneapolis, Minn]; present in 7 patients), nasopharyngeal temperature, and intra-arterial blood pressure were obtained from the Epic (Verona, Wis) electronic medical record system. These signals were co-registered with our data at one point per minute resolution. Arterial blood pressure was also collected directly with our device at 10 Hz. The optical probe was positioned on the patient's forehead after induction of general anesthesia. We secured the probe several centimeters above the eyebrow and used surgical tape to secure the probe to the patient. Data collection began immediately after anesthesia induction and ended after chest closure.
Signal Processing and Analysis
Both DCS and FDNIRS signals were down-sampled from 10 to 0.2 Hz. FDNIRS raw data signal artifacts due to interference from the INVOS cerebral oximeter were removed during preprocessing (for more detail, see the Appendix 1). To compute the absorption and scattering coefficients of measured tissue, we used the frequency-domain multidistance method.27 From the absorption coefficient, we estimated SO2. Blood flow index at each source-detector separation was obtained from the DCS data using the semi-infinite medium correlation diffusion equation.18 Fixed absorption and reduced scattering coefficients at 850 nm (0.11 cm−1 and 8.5 cm−1, respectively) obtained averaging across all the subjects measured with FDNIRS, were used to quantify changes in CBFi with HCA. Actual optical properties were used to calculate absolute CBFi in 6 patients with continuous FDNIRS data.
CMRO2i before and after HCA was calculated using Fick's Principle28 (details available in the Appendix 1), and because of the need for measured optical properties to quantify CBFi and SO2, only the 6 patients with continuous FDNIRS data were included in this analysis.
Statistical Analysis
All statistical analyses were carried out using IBM SPSS (version 25.0; IBM Corp, Armonk, NY). Using a one-way analysis of variance test, we compared the ratio of CBFi and SO2 during versus pre-HCA among the 3 groups, followed by a Dunnett T3 post hoc test for pairwise comparisons. To reveal the relationship between CMRO2i and temperature, a Pearson correlation test was performed. Statistical significance was evaluated by using a one-tail t-distribution table with a 95% confidence interval (lower bound: 0.134, upper bound: 0.806). Data are reported as mean ± standard deviation unless stated otherwise, and P < .05 was considered significant. The temporal correlation between FDNIRS-DCS and physiological measures was calculated using an in-house MATLAB pipeline using the corrcoef function.
Results
The average total HCA time across subjects was 24 ± 12 minutes. The average nasopharyngeal temperatures in patients during HCA-only, RCP, and ACP were 19.9 ± 2.3°C, 18.1 ± 0.3°C, and 22.6 ± 3.4°C, respectively.
CBFi, CMRO2i, and SO2 Perioperative Monitoring
Figure 3 shows a characteristic measurement of a patient undergoing HCA-only from start to finish (patient 3). We identified 6 phases: precardiopulmonary bypass (CPB), CPB, cooling, HCA, rewarming, and post-CPB. A wide range in CBFi (Figure 3, A, left axis) can be seen throughout the surgery. Under CPB and cooling, CBFi decreases substantially following the temperature decrease (Figure 3, E), whereas SO2 (Figure 3, B) remains constant, consistent with the reduction in CMRO2i (Figure 3, A, right axis). The most drastic change in CBFi and SO2 happens during circulatory arrest. This patient underwent 2 HCAs with no perfusion, and on both occasions CBFi dropped to near zero within 30 seconds and SO2 gradually decreased at an average rate of 1% per minute. The FDNIRS SO2 and the INVOS rSO2 (Figure 3, C) show differences in the absolute values due to the different assumptions made with the 2 devices, but exhibit the same trends.
Figure 3.

Full measurement of a patient (3) during a pulmonary thromboendarterectomy with 2 periods of HCA without any additional perfusion (HCA-only). CBFi, (A, blue, left axis), CMRO2i (A, red, right axis), and hemoglobin oxygenation (SO2, B) are measured by our combined FDNIRS-DCS device. The remaining 3 panels show the INVOS rSO2 measured in the left (C, blue) and right (C, red) forehead, MAP as measured via an arterial cannula in the arm (D), and temperature measured with a nasopharyngeal probe (E) throughout the surgery. In sections shaded in light green, the patient's heart is driving blood circulation. In all other sections, the patient is on CPB. Noteworthy trends include the high correlation between CBFi, CMRO2i, and temperature; the immediate measured drop to zero of the CBFi at the beginning of each HCA, followed by the sharp overshoots at the end of HCA; and finally, the high correlation between SO2 measurements taken via FDNIRS and the INVOS oximeter. CBFi, Cerebral blood flow index; CPB, cardiopulmonary bypass; HCA, hypothermic circulatory arrest; CMRO2i, cerebral metabolic rate of oxygen; SO2, oxygen saturation; rSO2, regional oxygen saturation; MAP, mean arterial pressure.
Across all subjects, the average correlation between FDNIRS SO2 and the INVOS rSO2 was 0.8 ± 0.1. On average, the correlation coefficient between CBFi and mean arterial pressure was weak (0.3 ± 0.2, P < .01). We also did not find any significant correlation between CBFi and SO2 (correlation coefficient –0.2 ± 0.4, P < .01). Both CBFi and CMRO2i were strongly positively related with temperature during cooling and rewarming periods (correlation coefficient 0.9 ± 0.1, P < .01 for both).
Figure 4 shows the temperature dependency of CMRO2i normalized with respect to the rewarming 35.5°C value. Each data point represents the average CMRO2i values for the cooling/rewarm periods at the temperature value ± 1°C. Points during HCA were excluded. Since linear fits during cooling and rewarming were nearly identical, we combined them into one fit. The relationship between the natural log of normalized CMRO2i and temperature is described by the linear function: = 0.08T – 3.0 (correlation coefficient = 0.8, P < .01).
Figure 4.

Log of the normalized CMRO2i versus temperature in 6 patients who had continuous FDNIRS-DCS measurements. Each patient is indicated by a different color. Open markers indicate cooling periods and filled markers indicate rewarming periods. Each patient's CMRO2i values are normalized with respect to average CMRO2i between 34.5°C and 36.5°C during patient rewarming. The red line is the linear fit, which demonstrates the expected temperature linear dependence. Pearson correlation coefficient r = 0.84, statistically significant at the .01 level. CMRO2i, Cerebral metabolic rate of oxygen; FDNIRS-DCS, frequency domain near-infrared spectroscopy and diffuse correlation spectroscopy.
CBFi and SO2 Behavior at Circulatory Arrest
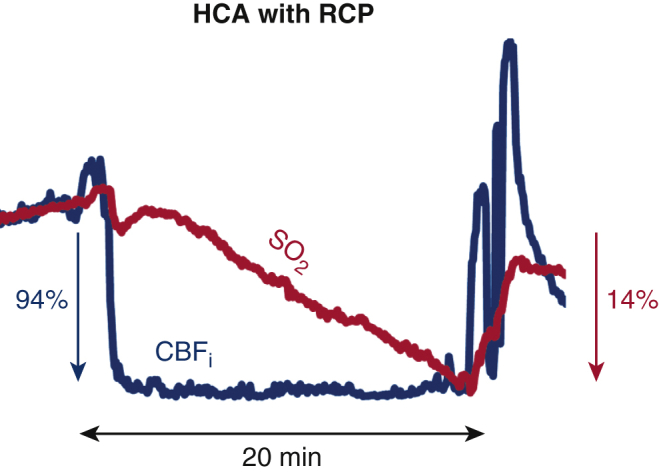
Figure 5 shows the CBFi and SO2 time traces for an HCA-only case, an RCP case, and an ACP case, focusing on the period of HCA. These 3 representative cases highlight the cerebrovascular dynamics observed during the 3 procedures. In HCA-only and RCP, CBFi dropped sharply to near zero at HCA onset and overshot at the end of HCA. At the same time, SO2 gradually decreased during HCA and after HCA gradually recovered. With ACP, CBFi, and SO2 were maintained to values close to pre-HCA.
Figure 5.

CBFi (blue, left axis) and hemoglobin SO2 (red, right axis) measured by our combined FDNIRS-DCS device. A, Patient 3 during the second HCA with no extra perfusion (HCA-only). CBFi dropped 94 ± 3% within the first minute of HCA. The patient's SO2 decreased by 14 ± 1% over the 12-minute HCA (1.2 ± 0.1% per minute). B, Patient 6, who underwent HCA with RCP. CBFi dropped 93 ± 3% within the first minute of HCA. SO2 dropped at a slower rate (0.7% per minute) than the HCA-only patient and dropped by 23 ± 1% after 20 minutes of HCA. C, Patient 10, who underwent HCA with ACP. At the beginning of ACP, CBFi is at the pre-HCA level, but it increases throughout the procedure, ultimately reaching 2 times the initial level (mean increase of 57 ± 39%). SO2, in contrast, did not demonstrate this increase of perfusion, instead dropping through the procedure by 4.6% (SO2 drop-rate of 0.1 ± 0.2% per minute). It is notable that cerebral perfusion does not increase during an RCP procedure. This was indicated by CBFi more promptly than SO2 signal. Furthermore, HCA-only and RCP cases display a large overshoot at reperfusion that is identifiable only in the CBFi time trace. CBFi, Cerebral blood flow index; HCA, hypothermic circulatory arrest; SO2, oxygen saturation; RCP, retrograde cerebral perfusion; ACP, antegrade cerebral perfusion.
To examine cerebral perfusion and oxygenation changes during circulatory arrest, we quantified the ratios of CBFi and changes in SO2 during versus pre-HCA for each patient (Figure 6). Patients who received HCA-only experienced a CBFi median drop of 95% (range, 94%-98%) and patients receiving RCP experienced a median drop of 93% (range, 87%-94%), whereas patients receiving ACP experienced a median increase in CBFi of +3% (range: 12% to +58%). There was a statistically significant difference in the ratio of CBFi during versus pre-HCA among the 3 cerebral-protection methods (F2,10 = 51.75, P = .001). We confirmed the significantly lower CBFi ratio in HCA-only (0.05 ± 0.01) and RCP (0.08 ± 0.03) cases with respect to ACP (1.1 ± 0.3) cases, with statistically significant mean differences of P = .003. There were no statistically significant differences between the CBFi drops in HCA-only and RCP cases (P = .5).
Figure 6.

Relative changes in CBFi and hemoglobin SO2 during HCA versus pre-HCA baseline with different brain-protection procedures (HCA-only, RCP, ACP). All data are presented in box and whisker format. The red line indicates the median, the edges of the box indicate the 25th and 75th percentiles, the whiskers extend to the extreme nonoutlier data points, and outliers are represented as red addition symbols. A, The ratios of CBFi during versus pre-HCA measured with DCS. Pre-HCA interval was identified as 5-minute period immediately before HCA start (with one exception, patient 2, where we had to use a 2-minute period because of artifacts). During-HCA was defined as the average from 1 minute into HCA to the HCA stop time. B, Percent drop of SO2 measured with FDNIRS. Values were averaged for 60 seconds for both the pre-HCA baseline and end of HCA values. Numbers above bars indicate average temperature during HCA. C, Average drop-rate of SO2 through HCA. HCA durations were determined using electronic records and are precise to the minute time scale. Notice that for (A), there is no significant difference between CBFi drops in HCA-only and RCP cases, and both are significantly different from ACP cases. Furthermore, as we would expect, in (B) and (C) HCA-only and RCP have similar SO2 drops and drop rates, whereas ACP drops are significantly lower. These differences would likely be made even more striking when accounting for the differences in body temperatures, which are considerably greater in patients undergoing ACP than those who are undergoing HCA-only and RCP. CBFi, Cerebral blood flow index; HCA, hypothermic circulatory arrest; RCP, retrograde cerebral perfusion; ACP, antegrade cerebral perfusion; SO2, oxygen saturation.
Figure 6, B, reports the SO2 drop at the end of HCA with respect to pre-HCA and Figure 6, C, reports the drop-rate in the 8 patients that had FDNIRS measurements. The SO2 total drops and drop-rates for HCA-only and HCA with RCP cases were similar, with total mean drops of 18 ± 4% (mean drop-rates of 0.9 ± 0.2%) in HCA-only and 13% (0.6%) in RCP. Meanwhile, HCA with ACP mostly maintained SO2 throughout the HCA, with a mean total drop of 3 ± 2% and a mean drop-rate of 0.2 ± 0.2% per minute.
We also quantified the overshoots at the end of circulatory arrest with respect to the post-HCA recovery values. The median CBFi overshoots in the HCA-only and RCP cases were 2.4 (range, 1.8-2.9) and 2.6 (range, 1.8-3.3) times greater than recovery levels, respectively. There were no significant overshoots in the ACP cases and no overshoot of SO2 in any cases.
Discussion
This is the first report using FDNIRS-DCS to evaluate the changes in CBFi and hemoglobin oxygenation throughout 3 common brain-protection strategies in adult cardiac surgery with HCA. In the 30 years since deep HCA (<20°C) was first successfully introduced during aortic arch surgery, clinical outcomes have improved significantly.29 However, aortic arch surgery is still associated with a high incidence of neurologic complications, including permanent and temporary neurologic dysfunctions.30 EEG and NIRS are often used as intraoperative brain-monitoring tools to optimize individual protection strategies during HCA. And while these modalities provide valuable information to the surgical team, they cannot directly assess the cerebral blood perfusion provided by ACP and RCP. This stimulated us to employ DCS, which is an easy-to-use method that allows continuous and noninvasive monitoring of an index of cerebral blood flow.
Utility of CBFi and SO2 Measures in HCA-Only and HCA With RCP Procedures
The rationale of RCP is to provide metabolic support, maintaining brain hypothermia while preventing embolism. One question concerning this technique is whether the brain tissue receives enough blood. The efficacy of RCP to provide nutritive brain perfusion has been challenged by a few invasive studies in animals9,10 and nonhuman primates,31 demonstrating a low and uneven distribution of blood flow to the brain, especially in the cortex. We were able to reproduce these results in humans, noninvasively with DCS. The negligible amount of blood flow we detected during RCP may suggest the efficacy of RCP as a neuroprotective method may be only partial and attributed to mechanisms other than flushing of emboli and provision of nutrients.29 The minimal perfusion during RCP is consistent with the reduction in SO2 that we measured in these patients, which is very similar to the reductions observed in patients receiving HCA-only.
Our results also show a CBFi overshoot in patients with HCA-only and HCA with RCP when cerebral blood flow was restored at the end of circulatory arrest, which was not observed in patients undergoing HCA with ACP. This hyperperfusion did not show up in SO2 monitoring. The mechanism and potential consequences of these transient hyperperfusion events in HCA patients are unknown. In carotid endarterectomy and in carotid angioplasty with stenting, a similar reperfusion is known to cause cerebral hyperperfusion syndrome, a rare but severe complication characterized by headaches, neurologic deficits, and seizures.32 The rapid and large (140% above post-HCA recovery) increase of blood flow in patients with HCA-only and RCP may put them at a similar risk. FDNIRS and DCS monitoring during HCA-only and HCA with RCP may allow surgeons to adjust CPB flow to minimize the cerebral hyperperfusion circulation is resumed and the end of HCA.
CBFi and SO2 in HCA With ACP Procedure
Because it provides oxygenated blood in a more physiological manner, ACP has become more popular than RCP over the past 15 years. Most surgeons choose the right axillary artery for ACP, titrating ACP flow to a pressure of 50 to 70 mm Hg and flow of 6 to 10 mL/kg/m to provide adequate brain perfusion.33 However, these established flow rates are largely based on the empiric data and retrospective studies, with no direct cerebral perfusion measurements supporting it. Also, older patients may have a partially degraded circle of Willis, potentially compromising contralateral brain perfusion.34 If the contralateral SO2 levels drop during HCA with ACP, the clinicians may ask to raise perfusion pressure or increase CPB flow to facilitate left brain hemisphere perfusion. This can raise ipsilateral brain blood flow without improving contralateral perfusion. DCS could be a valuable tool to warn if flow is not reaching the contralateral side and to detect high flow ipsilaterally. In the current study, we were able to monitor only one side, and in 1 patient (10), we saw a large increase of CBFi in the right hemisphere and a drop in INVOS rSO2 in the left side (see Figure E3). Both FDNIRS and INVOS failed to detect a significant increase is SO2 in the ipsilateral side. It is plausible that in this patient the circle of Willis was unable to perfuse the contralateral side during ACP. This kind of situation poses the patient both at risk of stroke in the hypoperfused left hemisphere as well at risk of postoperative delirium if luxury perfusion is sustained in the right hemisphere.33,35,36
A bilateral measurement of CBFi would allow monitoring of ACP efficacy in both brain hemispheres and help identify patients who will benefit from institution of bilateral cerebral perfusion. Moreover, because of the heterogenicity of patients undergoing surgeries with HCA, a direct measure of CBFi could be used to individualize adjustment of ACP flow rates for each patient. Further studies are needed to confirm that regulating blood flow with DCS could provide better brain protection and allow optimization of ACP flow rates during HCA.
Temperature Dependence of CMRO2i
Reliable monitoring of CMRO2 during cooling is crucial to achieving the target metabolic reduction with hypothermia. With our noninvasive CMRO2i measurements, we found a linear relationship between the log of CMRO2 and temperature (0.08T–3) similar to that measured by Croughwell and colleagues37 with a xenon-clearance method (0.11T–3.83).
The advantage of our DCS measurements resides in the ability to measure continuously, and, more importantly, the fact that it uses nonionizing radiation (light), as opposed to the positron emission tomography method's need of a radioactive tracer. Ko and colleagues38 have observed differences in CMRO2i temperature dependence during cooling and rewarming in an HCA neonatal swine model, finding significantly lower CMRO2i values after rewarming. We, however, found the same CMRO2i relationship during cooling and rewarming, with CMRO2i returning to the precooling levels after rewarming. Differences in these results are likely due to differences in experimental procedures. Our results are also in agreement with our previous work, where DCS was used at 5 discrete timepoints during CPB in infants.20
Study Limitations and Additional Comments
One of the limitations of this pilot study is small number of patients recruited. Another limitation of our study is the lack of bilateral measurements, which is particularly interesting when ensuring bilateral brain perfusion during unilateral ACP. It is worth noting the disparity between the SO2 values measured by the INVOS versus FDNIRS. The INVOS rSO2 shows greater values and drops than the FDNIRS values, likely because of the strong assumptions made with the continuous wave device.39 Nevertheless, the correlation between the 2 measurements is very high.
The measured CBFi during HCA-only does not reach absolute zero. While in normal physiological states, DCS measurements are driven by red blood cell movement, when blood flow is stopped, the residual thermal (Brownian) motion will result in a nonzero DCS perfusion estimate. This Brownian motion contribution is ∼1% of the signal in normal conditions and relevant only when CBFi drops more than 90% from physiological levels.
DCS, like in NIRS, brings the challenge of ensuring that the signals are representative of the brain and not the scalp. We acquired data at both short and large separations, and these signals were compared to determine the sensitivity of the large separation to cerebral blood flow. In all data sets, we observed differences in relative signal changes between the short and long separations. Also, expecting brain blood flow to be greater than scalp blood flow, in 10 of our 12 measurements we observed larger CBFi values in the long separations, with some periods reporting almost 2 times the value of the short separation. We therefore believe that our longer separations are sensitive to the brain blood flow. For the 2 measurements (IDs 1 and 6) where the short separation blood flow index was greater, we believe the probe may have been placed directly over or near to a superficial vessel, causing short separation DCS to report greater than normal flow. The conclusions of our data analysis did not change based on the inclusion or exclusion of these 2 data sets, so we kept both in our analysis.
Conclusions
We have shown that combined DCS and FDNIRS provide new useful information during cardiac surgical procedures using circulatory arrest. In particular, DCS reliably measures CBFi and identifies periods of brain hypoperfusion and hyperperfusion, as shown in the low CBFi values measured during RCP, and its overshoot at the end of the procedure, similar to the values measured during HCA-only. Variability of CBFi levels across patients during ACP reflect important individual differences. Overall, DCS alone or combined with NIRS can potentially guide brain protection to help clinicians achieve patient-tailored optimal brain perfusion.
Conflict of Interest Statement
M.A.F. has financial interest in 149 Medical, Inc, a company developing DCS technology for assessing and monitoring cerebral blood flow in newborn infants, and in Dynometrics, Inc, a company that makes devices that use NIRS technology for athletes to evaluate muscle performance. M.A.F. interests were reviewed and are managed by Massachusetts General Hospital and Mass General Brigham (f/k/a/Partners HealthCare) in accordance with their conflict-of-interest policies. M.A.F. has a patent related to aspects of FDNIRS used in this manuscript. M.A.F. and S.A.C. have patent applications pending on aspects of the DCS technology used in this manuscript. All other authors reported no conflicts of interest.
The Journal policy requires editors and reviewers to disclose conflicts of interest and to decline handling or reviewing manuscripts for which they may have a conflict of interest. The editors and reviewers of this article have no conflicts of interest.
Acknowledgments
The authors thank Dr Felipe Orihuela-Espina for help with statistical analysis, as well as Dr Duke E. Cameron and Dr Serguei Melnitchouk for their contributions in performing the surgeries and offering clinical insight. We also thank Zack Starkweather for designing the optical probes and Adriano Peruch for device designs. Thank you to Robert Petrosyan for drawing and editing the Graphical Abstract. Finally, thank you to Juliette Selb, Melissa Wu and Vidhya V. Nair for their contributions to data acquisition.
Footnotes
This work is supported by National Institutes of HealthR01GM116177 and R01HD091067 (M.A.F.) and R01NS100750 (S.A.C.).
Appendix 1
Frequency-Domain Near-Infrared Spectroscopy (FDNIRS)-Diffuse Correlation Spectroscopy (DCS) Device
DCS and FDNIRS detectors acquire data in parallel, with the DCS laser at 850 nm always on and the 8 FDNIRS lasers (wavelengths ranging from 670 to 830 nm) turned on sequentially in rapid succession (10-Hz cycle with each laser on for 12 milliseconds).1 In patients 1, 5, and 8, the DCS operated at 2 Hz. In all other patients, the device operating software was updated, and DCS was run at 10 Hz. Crosstalk between the DCS and FDNIRS components is eliminated by optical filters in front of the detectors. To comply with the American National Standards Institute's standards, the DCS laser power was set at below 34 mW, the FDNIRS laser power between 2 and 3 mW, and the light at the probe was diffused over an area >1 mm. The FDNIRS system needs to be calibrated to account for different requirements for detector gains and fiber transmission at different distances (farther distances require higher gain). For the 8 patients measured with FDNIRS, we calibrated the FDNIRS detectors using 3 calibration blocks of known-optical properties immediately after data collection. Measurements in patient 2 were done with a DCS-only device with the same design and laser as the DCS portion of the MetaOx system, but with only 4 photon-counting detectors, as described in a study by Selb and colleagues.2
Optical Probe
Light sources and detectors from the device were connected via fiber optics to a soft rubbery 3-dimensional printed probe attached to the patient's head. All of the fibers at the probe end were terminated with prisms to allow for a low probe profile. For light transmission to the patient, we used a single-fiber cable that included the fiber bundle from the FDNIRS lasers and a 200-μm multimode fiber from the DCS laser. One single-mode fiber located at 5 mm from the source collected the short separation DCS light. Four fiber bundles at distances of 2, 2.5, 3, and 3.5 cm from the source collected photons back to the FD-NIRS detectors. In 1 patient (9) 1.5, 2, 2.5, and 3 cm distances were used for FDNIRS. Fiber bundles at 2.5 and 3 cm also included DCS single-mode detection fibers for a colocalized acquisition (Figure 2). The probe was attached with tape to the patient's forehead, and to shield from ambient light, a soft black craft cloth was taped over the probe. In most patients, the optical probe was positioned on the right forehead. In 3 patients (2, 6, 11), cerebral oximetry and electroencephalography were placed on the right side of the forehead in a way that did not leave enough room for the optical probe, so we placed the probe on the left side.
FDNIRS Data Preprocessing
The FDNIRS data had interference from the hospital INVOS cerebral oximeter, which had to be removed during preprocessing. The INVOS oximeter employs 730 nm and 810 nm LEDs, which are switched on and off at <30 Hz, whereas our FDNIRS employs 8 wavelengths turned on in sequence at 10 Hz per cycle. The optical cross-talk of between the 2 devices results in spurious peaks in the FDNIRS AC and phase shift signals, which appear at different wavelengths and different times throughout data collection. We used Fourier analysis to find and discard contaminated data segments, typically lasting under 1 minute. Specifically, in 6 patients (3, 6, 7, 9-11), we discarded up to 10% of each FDNIRS raw data due to the interference. We linearly interpolated across the discarded periods to obtain continuous AC and phase time traces. The raw signal for one of these patients is shown in Figure E1. In patients 3, 6, and 11 we didn't use the data from the 3.5-cm separation because the INVOS interference was too strong and to calculate optical properties and hemoglobin parameters we use only 2-, 2.5-, and 3-cm source-detector separations. Because the INVOS interference only affected 0-3 of 8 wavelengths at any given time, and in principle 2 wavelengths are sufficient to estimate oxy and deoxy-hemoglobin (HbO and HbR, respectively), these artifacts did not affect the final hemoglobin concentration and oxygen saturation (SO2), and for these quantities we were able to recover continuous time traces.
In patients 4 and 12, our probe was very close to the hospital oximeter's probe, which resulted in a stronger interference, affecting longer segments of data and up to 4 wavelengths at a time. In these 2 subjects, we had to discard all the data at 3 and 3.5 cm, and at 2 and 2.5 cm we either discarded or interpolated 30% of each remaining raw data. So, for these 2 patients, we were only able to calculate discrete optical properties and hemoglobin parameters at sparse timepoints. An example of the stronger interference is shown in Figure E2.
Because the DCS light is so much stronger (DCS laser ∼34 mW vs FDNIRS lasers ∼2 mW) and coherent, the INVOS noncoherent light added very little background noise to the DCS data and had no effect on the autocorrelation function results.
The doctors' occasional manipulations of the patient's head and adjustments of the hospital electroencephalography and NIRS probes produced artifacts in the collected data and a very small percent (<0.1%) of both DCS and FDNIRS data had to be discarded.
Finally, after artifact removal in preprocessing, we smoothed the 10 Hz FDNIRS AC and phase shift data using a 50-point averaging window, down-sampling to 0.2 Hz.
Calculation of Optical Properties and Hemoglobin Oxygen Saturation With FDNIRS
After preprocessing, the raw FDNIRS data were analyzed using the frequency domain multidistance method3 to compute the optical properties of the measured tissue at each wavelength. Following this method, the AC and phase shift slopes versus distance were used to quantify the absorption and scattering coefficients, μa and μs′, respectively. After calculating μa and μs′ at all wavelengths, we used the absorption coefficients at 5 or more wavelengths to estimate oxy and deoxy hemoglobin concentrations (HbO and HbR, respectively) assuming a constant water fraction in tissue of 0.75.4 Total hemoglobin concentration (HbT) and hemoglobin SO2 were derived from HbO and HbR concentrations using the following equations:
Quantifying the SO2 changes during circulatory arrests. We calculated the difference in SO2 1 minute before HCA and 1 minute right before reperfusion. The SO2 drop rate was calculated by dividing the total drop by the length of the HCA, as recorded by the clinical team.
DCS Data Analysis
During preprocessing, the DCS intensity autocorrelation functions (g2) were smoothed by taking the median of a 10-point window for patients 1, 5, and 8 (acquired at 2 Hz), and a 50-point window for all other patients (acquired at 10 Hz) to achieve a final sampling rate of 0.2 Hz in all patients.
We analyzed the DCS data using the semi-infinite medium boundary condition for correlation diffusion equation.3 In all subjects, we reported data at 25-mm separation except for patient 2, for which we only had the measure at 30 mm.
Optical properties at 850 nm are needed to calculate blood flow index (BFi). For 6 of the 12 patients, we had continuous FDNIRS optical properties at 5 to 8 wavelengths and were able to quantify the absorption and reduced scattering coefficient at 850 nm by interpolation. For these subjects we used these time-varying μa and μs′ values to calculate absolute values of cerebral blood flow index (CBFi) and cerebral metabolic rate of oxygen (index) (CMRO2i; described in later section “Quantification of Cerebral Metabolic Rate of Oxygen and Its Relationship With Temperature”). Since in 4 patients we didn't have FDNIRS data and tissue optical properties, and in 2 patients we only had intermittent FDNIRS data and optical properties, in all subjects, for the calculation of relative CBFi changes with HCA, we used fixed optical properties. Specifically, we used μa = 0.11 ± 0.03 cm−1 and μs′ = 8.5 ± 1.4 cm−1, obtained by averaging absorption and scattering across the whole surgery, and performing a grand average across the 8 patients with FDNIRS measurements.
For each subject, we quantified the CBFi drops at HCA by calculating the ratio of CBFi between the duration of HCA and the pre-HCA values. The pre-CA values were obtained by averaging 5 minutes of CBFi data immediately before the HCA onset, with one exception, patient 2, in whom we had to use a 2-minute period because of a gap in the data acquisition between 4 and 2 minutes before HCA. The during-HCA values were obtained by averaging CBFi from 1 minute into HCA to the HCA stop time.
We also quantified the CBFi overshoot at reperfusion post-HCA as the ratio between the value at the greatest reperfusion peak (there were multiple peaks in some cases where the surgeon asked to have the pump started and stopped several times) and the resting value several minutes after the overshoot.
Use of Fixed Versus Actual Optical Properties for DCS CBFi Calculations
In the 8 patients with FDNIRS, we evaluated the error due to the assumption of fixed optical properties in calculating CBFi and CBFi relative changes versus using the actual measured optical properties. As described in Irwin and colleagues,5 absolute CBFi values are strongly affected by μs′, and to a lesser extent by μa. Using fixed instead of measured optical properties induced an average 16 ± 11% change in the absolute CBFi values.
Because relative changes in μs′ during surgery were relatively small (the maximum change across the entire procedure was 13 ± 6% across subjects, which, in most subjects, happened after the patient was taken off of CPB), the use of fixed versus actual optical properties had little effect on the relative CBFi changes during versus pre- or post-HCA results. By comparing fixed versus measured optical properties, we found that the ratios of CBFi during versus pre-HCA across the 8 subjects changed by 6 ± 6%, the ratios of post-HCA overshoot changed by 2 ± 1%, and that the difference in the relative CBFi through the entire measurement was only 4 ± 5%.
Quantification of Cerebral Metabolic Rate of Oxygen and Its Relationship With Temperature
To calculate oxygen consumption, we used the following equation: ,6 where HGB is the patient's hemoglobin concentration in the blood (units g/dL) and MWHb is the molecular weight of hemoglobin (65,400 g/Mol). HGB was collected at 30-minute intervals by the clinical team, and we linearly interpolated over the points to get a continuous variable. In all 8 patients, arterial oxygenation was maintained at 100% by the cardiopulmonary bypass during cooling and rewarming. As described previously, SO2 was measured with the FDNIRS and CBFi was calculated using actual optical properties.
For each patient, CMRO2i averages for cooling and rewarming periods were calculated separately. We averaged CMRO2 values over 2°C associated with up to 7 evenly spaced temperature windows, from 20.5°C to 34.5°C. We normalized each patient's CMRO2i values with respect to the average CMRO2i in the window between 34.5°C-36.5°C, taken during each patient's rewarming period. Data with significant artifacts in CBFi caused by CPB flow rate adjustments were excluded from calculations. To estimate the CMRO2i relationship with temperature, we fit a linear regression for all patients' normalized CMRO2i (log scale) with respect to the mean temperature windows.
Other Parameters of Interest at Circulatory Arrests
We also quantified group averages for drops in the INVOS regional oxygen saturation (rSO2; Table E1). The median INVOS rSO2 right side drop was 23% (range, 18%-37%) in HCA-only, 12% in RCP, and 0% (range, –2.5% to 9%) in ACP cases. The median INVOS rSO2 left side drop was 20% (range, 23%-38%) in HCA-only, 7% in RCP, and 5% (range, 3%-23%) in ACP cases.
Figure E1.

FDNIRS raw phase data at 672, 759, and 813 nm and 3 cm source-detector separation in patient 6. The interference from the hospital INVOS oximeter lasts several minutes but is only strong enough to affect our data during the start and end small jumps that have an amplitude of approximately 0.05 radians in the raw signal. Each of these jumps is roughly 40 seconds wide, easy to analytically detect, and remove.
Figure E2.

FDNIRS raw phase data at 672, 726, and 813 nm and detector at 2.5 cm from the source, from patient 12, showing the strong interference of the hospital INVOS oximeter. Here, the interference during the entire 5- to 7-minute long period is strong enough to affect our data. This combined with the overlap across wavelengths makes potential interpolation algorithms more difficult to standardize.
Figure E3.

CBFi, hemoglobin SO2, and the hospital INVOS oximeter regional (r)SO2 time-traces around a HCA with ACP in patient #10. CBFi and FDNIRS SO2 are measured on the right side, whereas INVOS has bilateral measurements. Note that although the right-side FDNIRS and INVOS oxygen saturation report relatively steady levels, the left INVOS rSO2 drops throughout the HCA, suggesting decreased blood flow delivery to that hemisphere, similar to the RCP or HCA-only cases. This may be caused by an incomplete circle of Willis. CBFi measured on the right side supports this hypothesis since increasing perfusion pressure from the clinical team only served to increase CBFi through HCA, with the long separations CBFi increasing to more than 200% of the pre-HCA levels. Artifacts in CBFi through HCA are from a clinician pressing on the probe mid-procedure. CBFi, Cerebral blood flow index; HCA, hypothermic circulatory arrest; ACP, antegrade cerebral perfusion; FDNIRS, frequency domain near-infrared spectroscopy; SO2, oxygen saturation; rSO2, regional oxygen saturation.
Table E1.
Group-level quantification of CBFi, hemoglobin SO2, the hospital INVOS oximeter, and MAP behavior with circulatory arrests
| Perfusion group | CBFi drop from baseline, % | CBFi overshoot, %∗ | SO2 baseline (FDNIRS, %) | SO2 drop (FDNIRS, %) | INVOS left baseline, % | INVOS left drop, % | INVOS right baseline, % | INVOS right drop, % | MAP baseline, mm Hg |
|---|---|---|---|---|---|---|---|---|---|
| HCA-only | 95 ± 1% | 240 ± 50 | 59 ± 7% | 18 ± 4% | 77 ± 7% | 27 ± 10% | 70 ± 0.6% | 26 ± 10% | 64 ± 4 |
| RCP | 91 ± 3% | 250 ± 70 | 70.2%† | 13%† | 95%† | 7%† | 95%† | 12%† | 64 ± 7 |
| ACP | –12 ± 28% | N/A | 59 ± 14% | 3 ± 2% | 91 ± 3% | 10 ± 11% | 83 ± 7% | 2 ± 6% | 73 ± 28 |
Baseline is equivalent to the pre-HCA window defined for CBFi and SO2 previously. CBFi overshoot is calculated by comparing the maximum value reached at reperfusion with the mean value reached 1-3 minutes after reperfusion. All data are expressed as mean ± standard deviation. CBFi, Cerebral blood flow index; SO2, oxygen saturation; FDNIRS, frequency-domain near-infrared spectroscopy; MAP, mean arterial pressure; HCA, hypothermic circulatory arrest; RCP, retrograde cerebral perfusion; ACP, antegrade cerebral perfusion.
The percentage here represents the overshoot's value as a percentage of the baseline value. Hence, an overshoot that is twice as high as the baseline would have a value of 200%.
Standard deviation not estimated since ≤2 patients had this measurement.
Supplementary Data
Dr Jason Qu and Alexander Zavriyev discuss the relevance of the study for the cardiac surgery community and introduce the current stage of the research device. Ultimately, this exploratory study could lead to a large-scale study directly correlating cerebral hemodynamics with patient outcomes in hypothermic circulatory arrests. Video available at: https://www.jtcvs.org/article/S2666-2507(21)00093-6/fulltext.
References
- 1.Mezrow C.K., Sadeghi A.M., Gandsas A., Dapunt O.E., Shiang H.H., Zappulla R.A., et al. Cerebral effects of low-flow cardiopulmonary bypass and hypothermic circulatory arrest. Ann Thorac Surg. 1994;57:532–539. doi: 10.1016/0003-4975(94)90541-x. [DOI] [PubMed] [Google Scholar]
- 2.Wypij D., Newburger J.W., Rappaport L.A., duPlessis A.J., Jonas R.A., Wernovsky G., et al. The effect of duration of deep hypothermic circulatory arrest in infant heart surgery on late neurodevelopment: the Boston circulatory arrest trial. J Thorac Cardiovasc Surg. 2003;126:1397–1403. doi: 10.1016/s0022-5223(03)00940-1. [DOI] [PubMed] [Google Scholar]
- 3.Gaynor J.W., Nicolson S.C., Jarvik G.P., Wernovsky G., Montenegro L.M., Burnham N.B., et al. Increasing duration of deep hypothermic circulatory arrest is associated with an increased incidence of postoperative electroencephalographic seizures. J Thorac Cardiovasc Surg. 2005;130:1278–1286. doi: 10.1016/j.jtcvs.2005.02.065. [DOI] [PMC free article] [PubMed] [Google Scholar]
- 4.Czerny M., Fleck T., Zimpfer D., Dworschak M., Hofmann W., Hutschala D., et al. Risk factors of mortality and permanent neurologic injury in patients undergoing ascending aortic and arch repair. J Thorac Cardiovasc Surg. 2003;126:1296–1301. doi: 10.1016/s0022-5223(03)01046-8. [DOI] [PubMed] [Google Scholar]
- 5.Englum B.R., He X., Gulack B.C., Ganapathi A.M., Mathew J.P., Brennan J.M., et al. Hypothermia and cerebral protection strategies in aortic arch surgery: a comparative effectiveness analysis from the STS adult cardiac surgery database. Eur J Cardiothorac Surg. 2017;52:492–498. doi: 10.1093/ejcts/ezx133. [DOI] [PubMed] [Google Scholar]
- 6.Elefteriades J.A. What is the best method for brain protection in surgery of the aortic arch? Straight DHCA. Cardiol Clin. 2010;28:381–387. doi: 10.1016/j.ccl.2010.02.004. [DOI] [PubMed] [Google Scholar]
- 7.Bachet J. What is the best method for brain protection in surgery of the aortic arch? Selective antegrade cerebral perfusion. Cardiol Clin. 2010;28:389–401. doi: 10.1016/j.ccl.2010.01.014. [DOI] [PubMed] [Google Scholar]
- 8.Ueda Y. What is the best method for brain protection in surgery of the aortic arch? Retrograde cerebral perfusion. Cardiol Clin. 2010;28:371–379. doi: 10.1016/j.ccl.2010.01.006. [DOI] [PubMed] [Google Scholar]
- 9.Ehrlich M.P., Hagl C., McCullough J.N., Zhang N., Shiang H., Bodian C., et al. Retrograde cerebral perfusion provides negligible flow through brain capillaries in the pig. J Thorac Cardiovasc Surg. 2001;122:331–338. doi: 10.1067/mtc.2001.115244. [DOI] [PubMed] [Google Scholar]
- 10.Fukae K., Nakashima A., Hisahara M., Kawachi Y., Masuda M., Yasui H. Maldistribution of the cerebral blood flow in retrograde cerebral perfusion. Eur J Cardiothorac Surg. 1995;9:491–496. doi: 10.1016/s1010-7940(95)80049-2. [DOI] [PubMed] [Google Scholar]
- 11.Mizrahi E.M., Patel V.M., Crawford E.S., Coselli J.S., Hess K.R. Hypothermic-induced electrocerebral silence, prolonged circulatory arrest, and cerebral protection during cardiovascular surgery. Electroencephalogr Clin Neurophysiol. 1989;72:81–85. doi: 10.1016/0013-4694(89)90033-3. [DOI] [PubMed] [Google Scholar]
- 12.Shin’oka T., Nollert G., Shum-Tim D., du Plessis A., Jonas R.A. Utility of near-infrared spectroscopic measurements during deep hypothermic circulatory arrest. Ann Thorac Surg. 2000;69:578–583. doi: 10.1016/s0003-4975(99)01322-3. [DOI] [PubMed] [Google Scholar]
- 13.Purkayastha S., Sorond F. Transcranial Doppler ultrasound: technique and application. Semin Neurol. 2012;32:411–420. doi: 10.1055/s-0032-1331812. [DOI] [PMC free article] [PubMed] [Google Scholar]
- 14.Naqvi J., Yap K.H., Ahmad G., Ghosh J. Transcranial Doppler ultrasound: a review of the physical principles and major applications in critical care. Int J Vasc Med. 2013;2013:629378. doi: 10.1155/2013/629378. [DOI] [PMC free article] [PubMed] [Google Scholar]
- 15.Dehaes M., Cheng H.H., Buckley E.M., Lin P.-Y., Ferradal S., Williams K., et al. Perioperative cerebral hemodynamics and oxygen metabolism in neonates with single-ventricle physiology. Biomed Opt Express. 2015;6:4749–4767. doi: 10.1364/BOE.6.004749. [DOI] [PMC free article] [PubMed] [Google Scholar]
- 16.Durduran T., Zhou C., Buckley E.M., Kim M.N., Yu G., Choe R., et al. Optical measurement of cerebral hemodynamics and oxygen metabolism in neonates with congenital heart defects. J Biomed Opt. 2010;15:37004. doi: 10.1117/1.3425884. [DOI] [PMC free article] [PubMed] [Google Scholar]
- 17.Buckley E.M., Hance D., Pawlowski T., Lynch J., Wilson F.B., Mesquita R.C., et al. Validation of diffuse correlation spectroscopic measurement of cerebral blood flow using phase-encoded velocity mapping magnetic resonance imaging. J Biomed Opt. 2012;17:37007. doi: 10.1117/1.JBO.17.3.037007. [DOI] [PMC free article] [PubMed] [Google Scholar]
- 18.Durduran T., Choe R., Baker W.B., Yodh A.G. Diffuse optics for tissue monitoring and tomography. Rep Prog Phys. 2010;73:076701. doi: 10.1088/0034-4885/73/7/076701. [DOI] [PMC free article] [PubMed] [Google Scholar]
- 19.Busch D.R., Rusin C.G., Miller-Hance W., Kibler K., Baker W.B., Heinle J.S., et al. Continuous cerebral hemodynamic measurement during deep hypothermic circulatory arrest. Biomed Opt Express. 2016;7:3461–3470. doi: 10.1364/BOE.7.003461. [DOI] [PMC free article] [PubMed] [Google Scholar]
- 20.Ferradal S.L., Yuki K., Vyas R., Ha C.G., Yi F., Stopp C., et al. Non-invasive assessment of cerebral blood flow and oxygen metabolism in neonates during hypothermic cardiopulmonary bypass: feasibility and clinical implications. Sci Rep. 2017;7:44117. doi: 10.1038/srep44117. [DOI] [PMC free article] [PubMed] [Google Scholar]
- 21.Milej D., He L., Abdalmalak A., Baker W.B., Anazodo U.C., Diop M., et al. Quantification of cerebral blood flow in adults by contrast-enhanced near-infrared spectroscopy: validation against MRI. J Cereb Blood Flow Metab. 2020;40:1672–1684. doi: 10.1177/0271678X19872564. [DOI] [PMC free article] [PubMed] [Google Scholar]
- 22.Giovannella M., Andresen B., Andersen J.B., El-Mahdaoui S., Contini D., Spinelli L., et al. Validation of diffuse correlation spectroscopy against (15)O-water PET for regional cerebral blood flow measurement in neonatal piglets. J Cereb Blood Flow Metab. 2020;40:2055–2065. doi: 10.1177/0271678X19883751. [DOI] [PMC free article] [PubMed] [Google Scholar]
- 23.Jain V., Buckley E.M., Licht D.J., Lynch J.M., Schwab P.J., Naim M.Y., et al. Cerebral oxygen metabolism in neonates with congenital heart disease quantified by MRI and optics. J Cereb Blood Flow Metab. 2014;34:380–388. doi: 10.1038/jcbfm.2013.214. [DOI] [PMC free article] [PubMed] [Google Scholar]
- 24.Baker W.B., Balu R., He L., Kavuri V.C., Busch D.R., Amendolia O., et al. Continuous non-invasive optical monitoring of cerebral blood flow and oxidative metabolism after acute brain injury. J Cereb Blood Flow Metab. 2019;39:1469–1485. doi: 10.1177/0271678X19846657. [DOI] [PMC free article] [PubMed] [Google Scholar]
- 25.Selb J., Wu K.-C., Sutin J., Lin P.-Y.I., Farzam P., Bechek S., et al. Prolonged monitoring of cerebral blood flow and autoregulation with diffuse correlation spectroscopy in neurocritical care patients. Neurophotonics. 2018;5:45005. doi: 10.1117/1.NPh.5.4.045005. [DOI] [PMC free article] [PubMed] [Google Scholar]
- 26.Carp S.A., Farzam P., Redes N., Hueber D.M., Franceschini M.A. Combined multi-distance frequency domain and diffuse correlation spectroscopy system with simultaneous data acquisition and real-time analysis. Biomed Opt Express. 2017;8:3993–4006. doi: 10.1364/BOE.8.003993. [DOI] [PMC free article] [PubMed] [Google Scholar]
- 27.Fantini S., Franceschini M.A., Fishkin J.B., Barbieri B., Gratton E. Quantitative determination of the absorption spectra of chromophores in strongly scattering media: a light-emitting-diode based technique. Appl Opt. 1994;33:5204–5213. doi: 10.1364/AO.33.005204. [DOI] [PubMed] [Google Scholar]
- 28.Roche-Labarbe N., Carp S.A., Surova A., Patel M., Boas D.A., Grant P.E., et al. Noninvasive optical measures of CBV, StO(2), CBF index, and rCMRO(2) in human premature neonates' brains in the first six weeks of life. Hum Brain Mapp. 2010;31:341–352. doi: 10.1002/hbm.20868. [DOI] [PMC free article] [PubMed] [Google Scholar]
- 29.Geube M., Sale S., Svensson L. Con: routine use of brain perfusion techniques is not supported in deep hypothermic circulatory arrest. J Cardiothorac Vasc Anesth. 2017;31:1905–1909. doi: 10.1053/j.jvca.2017.02.024. [DOI] [PubMed] [Google Scholar]
- 30.Leshnower B.G., Rangaraju S., Allen J.W., Stringer A.Y., Gleason T.G., Chen E.P. Deep hypothermia with retrograde cerebral perfusion versus moderate hypothermia with antegrade cerebral perfusion for arch surgery. Ann Thorac Surg. 2019;107:1104–1110. doi: 10.1016/j.athoracsur.2018.10.008. [DOI] [PubMed] [Google Scholar]
- 31.Boeckxstaens C.J., Flameng W.J. Retrograde cerebral perfusion does not perfuse the brain in nonhuman primates. Ann Thorac Surg. 1995;60:318–319. doi: 10.1016/0003-4975(95)00409-e. [DOI] [PubMed] [Google Scholar]
- 32.Galyfos G., Sianou A., Filis K. Cerebral hyperperfusion syndrome and intracranial hemorrhage after carotid endarterectomy or carotid stenting: a meta-analysis. J Neurol Sci. 2017;381:74–82. doi: 10.1016/j.jns.2017.08.020. [DOI] [PubMed] [Google Scholar]
- 33.Halstead J.C., Meier M., Wurm M., Zhang N., Spielvogel D., Weisz D., et al. Optimizing selective cerebral perfusion: deleterious effects of high perfusion pressures. J Thorac Cardiovasc Surg. 2008;135:784–791. doi: 10.1016/j.jtcvs.2007.09.035. [DOI] [PubMed] [Google Scholar]
- 34.Zaninovich O.A., Ramey W.L., Walter C.M., Dumont T.M. Completion of the circle of Willis varies by gender, age, and indication for computed tomography angiography. World Neurosurg. 2017;106:953–963. doi: 10.1016/j.wneu.2017.07.084. [DOI] [PubMed] [Google Scholar]
- 35.Hori D., Brown C., Ono M., Rappold T., Sieber F., Gottschalk A., et al. Arterial pressure above the upper cerebral autoregulation limit during cardiopulmonary bypass is associated with postoperative delirium. Br J Anaesth. 2014;113:1009–1017. doi: 10.1093/bja/aeu319. [DOI] [PMC free article] [PubMed] [Google Scholar]
- 36.Hori D., Max L., Laflam A., Brown C., Neufeld K.J., Adachi H., et al. Blood pressure deviations from optimal mean arterial pressure during cardiac surgery measured with a novel monitor of cerebral blood flow and risk for perioperative delirium: a pilot study. J Cardiothorac Vasc Anesth. 2016;30:606–612. doi: 10.1053/j.jvca.2016.01.012. [DOI] [PMC free article] [PubMed] [Google Scholar]
- 37.Croughwell N., Smith L.R., Quill T., Newman M., Greeley W., Kern F., et al. The effect of temperature on cerebral metabolism and blood flow in adults during cardiopulmonary bypass. J Thorac Cardiovasc Surg. 1992;103:549–554. [PubMed] [Google Scholar]
- 38.Ko T.S., Mavroudis C.D., Baker W.B., Morano V.C., Mensah-Brown K., Boorady T.W., et al. Non-invasive optical neuromonitoring of the temperature-dependence of cerebral oxygen metabolism during deep hypothermic cardiopulmonary bypass in neonatal swine. J Cereb Blood Flow Metab. 2020;40:187–203. doi: 10.1177/0271678X18809828. [DOI] [PMC free article] [PubMed] [Google Scholar]
- 39.Kleiser S., Nasseri N., Andresen B., Greisen G., Wolf M. Comparison of tissue oximeters on a liquid phantom with adjustable optical properties. Biomed Opt Express. 2016;7:2973–2992. doi: 10.1364/BOE.7.002973. [DOI] [PMC free article] [PubMed] [Google Scholar]
References
- 1.Carp S.A., Farzam P., Redes N., Hueber D.M., Franceschini M.A. Combined multi-distance frequency domain and diffuse correlation spectroscopy system with simultaneous data acquisition and real-time analysis. Biomed Opt Express. 2017;8:3993–4006. doi: 10.1364/BOE.8.003993. [DOI] [PMC free article] [PubMed] [Google Scholar]
- 2.Selb J., Wu K.-C., Sutin J., Lin P.-Y.I., Farzam P., Bechek S., et al. Prolonged monitoring of cerebral blood flow and autoregulation with diffuse correlation spectroscopy in neurocritical care patients. Neurophotonics. 2018;5:45005. doi: 10.1117/1.NPh.5.4.045005. [DOI] [PMC free article] [PubMed] [Google Scholar]
- 3.Durduran T., Choe R., Baker W.B., Yodh A.G. Diffuse optics for tissue monitoring and tomography. Rep Prog Phys. 2010;73:076701. doi: 10.1088/0034-4885/73/7/076701. [DOI] [PMC free article] [PubMed] [Google Scholar]
- 4.Wolthuis R., van Aken M., Fountas K., Robinson, Bruining H.A., Puppels G.J. Determination of water concentration in brain tissue by Raman spectroscopy. Anal Chem. 2001;73:3915–3920. doi: 10.1021/ac0101306. [DOI] [PubMed] [Google Scholar]
- 5.Irwin D., Dong L., Shang Y., Cheng R., Kudrimoti M., Stevens S.D., et al. Influences of tissue absorption and scattering on diffuse correlation spectroscopy blood flow measurements. Biomed Opt Express. 2011;2:1969–1985. doi: 10.1364/BOE.2.001969. [DOI] [PMC free article] [PubMed] [Google Scholar]
- 6.Roche-Labarbe N., Carp S.A., Surova A., Patel M., Boas D.A., Grant P.E., et al. Noninvasive optical measures of CBV, StO(2), CBF index, and rCMRO(2) in human premature neonates' brains in the first six weeks of life. Hum Brain Mapp. 2010;31:341–352. doi: 10.1002/hbm.20868. [DOI] [PMC free article] [PubMed] [Google Scholar]
Associated Data
This section collects any data citations, data availability statements, or supplementary materials included in this article.
Supplementary Materials
Dr Jason Qu and Alexander Zavriyev discuss the relevance of the study for the cardiac surgery community and introduce the current stage of the research device. Ultimately, this exploratory study could lead to a large-scale study directly correlating cerebral hemodynamics with patient outcomes in hypothermic circulatory arrests. Video available at: https://www.jtcvs.org/article/S2666-2507(21)00093-6/fulltext.