

SUMMARY
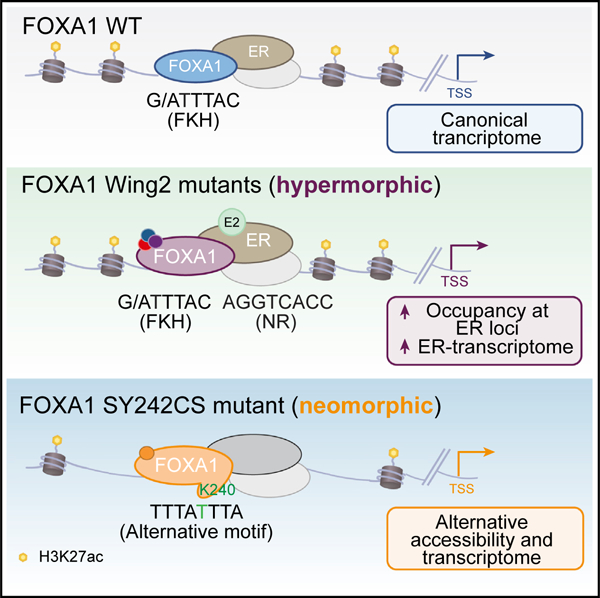
Mutations in the pioneer transcription factor FOXA1 are a hallmark of estrogen receptor-positive (ER+) breast cancers. Examining FOXA1 in ~5,000 breast cancer patients identifies several hotspot mutations in the Wing2 region and a breast cancer-specific mutation SY242CS, located in the third β strand. Using a clinico-genomically curated cohort, together with breast cancer models, we find that FOXA1 mutations associate with a lower response to aromatase inhibitors. Mechanistically, Wing2 mutations display increased chromatin binding at ER loci upon estrogen stimulation, and an enhanced ER-mediated transcription without changes in chromatin accessibility. In contrast, SY242CS shows neomorphic properties that include the ability to open distinct chromatin regions and activate an alternative cistrome and transcriptome. Structural modeling predicts that SY242CS confers a conformational change that mediates stable binding to a non-canonical DNA motif. Taken together, our results provide insights into how FOXA1 mutations perturb its function to dictate cancer progression and therapeutic response.
Graphical Abstract
In Brief
Arruabarrena-Aristorena et al. determine that mutations in the pioneer transcription factor FOXA1 lower the therapeutic response to aromatase inhibitors in ER+ breast cancer. Mechanistically, two phenotypic groups are established: hypermorphic Wing2 mutants that augment estrogen response, and a neomorphic SY242CS mutant that promotes an alternative pioneering, and cistromic and transcriptomic function.
INTRODUCTION
Breast cancer is classified into transcriptionally distinct subtypes driven by the expression of estrogen receptor (ER), progesterone receptor (PR), and human epidermal growth factor receptor 2 (HER2+) (Perou et al., 2000; Sorlie et al., 2001). In ~70% of breast cancers, ER is expressed and functions as a transcription factor that regulates cell growth and tumor progression.
Multiple sequencing initiatives reveal the landscape of genomic alterations in breast cancer (Banerji et al., 2012; Bertucci et al., 2019; Ciriello et al., 2015; Ellis et al., 2012; Nik-Zainal et al., 2016; Pereira et al., 2016; Razavi et al., 2018; Shah et al., 2012; Stephens et al., 2012; TCGA, 2012). These comprehensive studies associate specific gene alterations with the different breast cancer subtypes. Examples are the enrichment of PIK3CA mutations in ER-positive (ER+), ERBB2 amplification in HER2+, and TP53 mutations and PTEN loss in triple-negative breast cancers (TCGA, 2012). FOXA1 is also frequently mutated in ER+ breast cancer (Razavi et al., 2018; Ciriello et al., 2015; Myatt and Lam, 2007).
FOXA1 is described as a pioneer factor that binds to condensed chromatin allowing the recruitment of other transcription factors to the DNA (Cirillo et al., 1998; Iwafuchi-Doi et al., 2016). Due to structural similarity with the linker histone H1, FOXA1 can displace linker histones to maintain enhancer nucleosomes accessible for other transcription factors to bind (Iwafuchi-Doi et al., 2016). As such, FOXA1 reprograms ER recruitment at cis-regulatory elements affecting cell growth and response to endocrine therapies or phosphoinositide 3-kinase (PI3K) inhibitors (Carroll et al., 2005; Fu et al., 2016; Hurtado et al., 2011; Ross-Innes et al., 2012; Toska et al., 2017, 2019). Although FOXA1 is known to be essential for the majority of ER binding events in breast cancer, the functional consequences of FOXA1 mutations and whether they affect breast cancer progression and therapeutic response to endocrine therapy is currently unknown. Here, we have undertaken a comprehensive approach to investigate genome-wide chromatin recruitment, chromatin accessibility, and transcriptional network in breast cancer models harboring recurrent FOXA1 mutations. We also used an expanded metastatic breast cancer cohort (n = 6,136 tumors), together with in vitro and in vivo breast models, to study the functional outcome of these alterations in breast cancer growth and therapy response.
RESULTS
FOXA1 Missense Mutations Were Enriched in Metastatic Tumors and Associated with Worse Outcome to Aromatase Inhibitors
We first studied the prevalence of FOXA1 mutations in breast cancer using a cohort from our institution (n = 4,952, at the time of analysis, www.cbioportal.org), in which genomic alteration data on >400 cancer-associated genes were identified using the Food and Drug Administration-approved Memorial Sloan Kettering-integrated mutation profiling of actionable cancer targets (MSK-IMPACT) platform (Cheng et al., 2015). FOXA1 mutations occurred at a frequency of 4.18% in all patients and 4.88% in metastatic tumors (Figure 1A). Most of these mutations were localized at the C-terminal forkhead domain (FKHD) (Figure 1B), which is composed of three α helices (H1–3), three β strands, and two loops (‘‘Wing1’’ and ‘‘Wing2,’’ Figure 1C). Functional dependence between FOXA1 and ER (Carroll et al., 2005; Hurtado et al., 2011; Toska et al., 2017) prompted us to focus on ER+ samples. Using a curated cohort of 1,918 tumors from 1,756 breast cancer patients with detailed clinical annotation, including receptor status, therapy history, and genomic alteration data from MSK-IMPACT (Razavi et al., 2018; Zehir et al., 2017), we confirmed that FOXA1 mutations were found to be enriched at the Wing2 subdomain (residues 247–269, Figures 1D, S1A, and S1B), consistent with previous reports (Bertucci et al., 2019; Ciriello et al., 2015; Nik-Zainal et al., 2016). Analysis from The Cancer Genome Atlas (TCGA, PanCancer Atlas [Hoadley et al., 2018]), a cohort almost exclusively comprised of primary breast cancer samples, revealed a lower frequency of FOXA1 mutations, with a higher proportion of lesions occurring at the H1 helix (Figures S1C–S1E).
Figure 1. FOXA1 Missense Mutations Were Enriched in Metastatic Tumors and Associated with Worse Outcome to Endocrine Therapy.
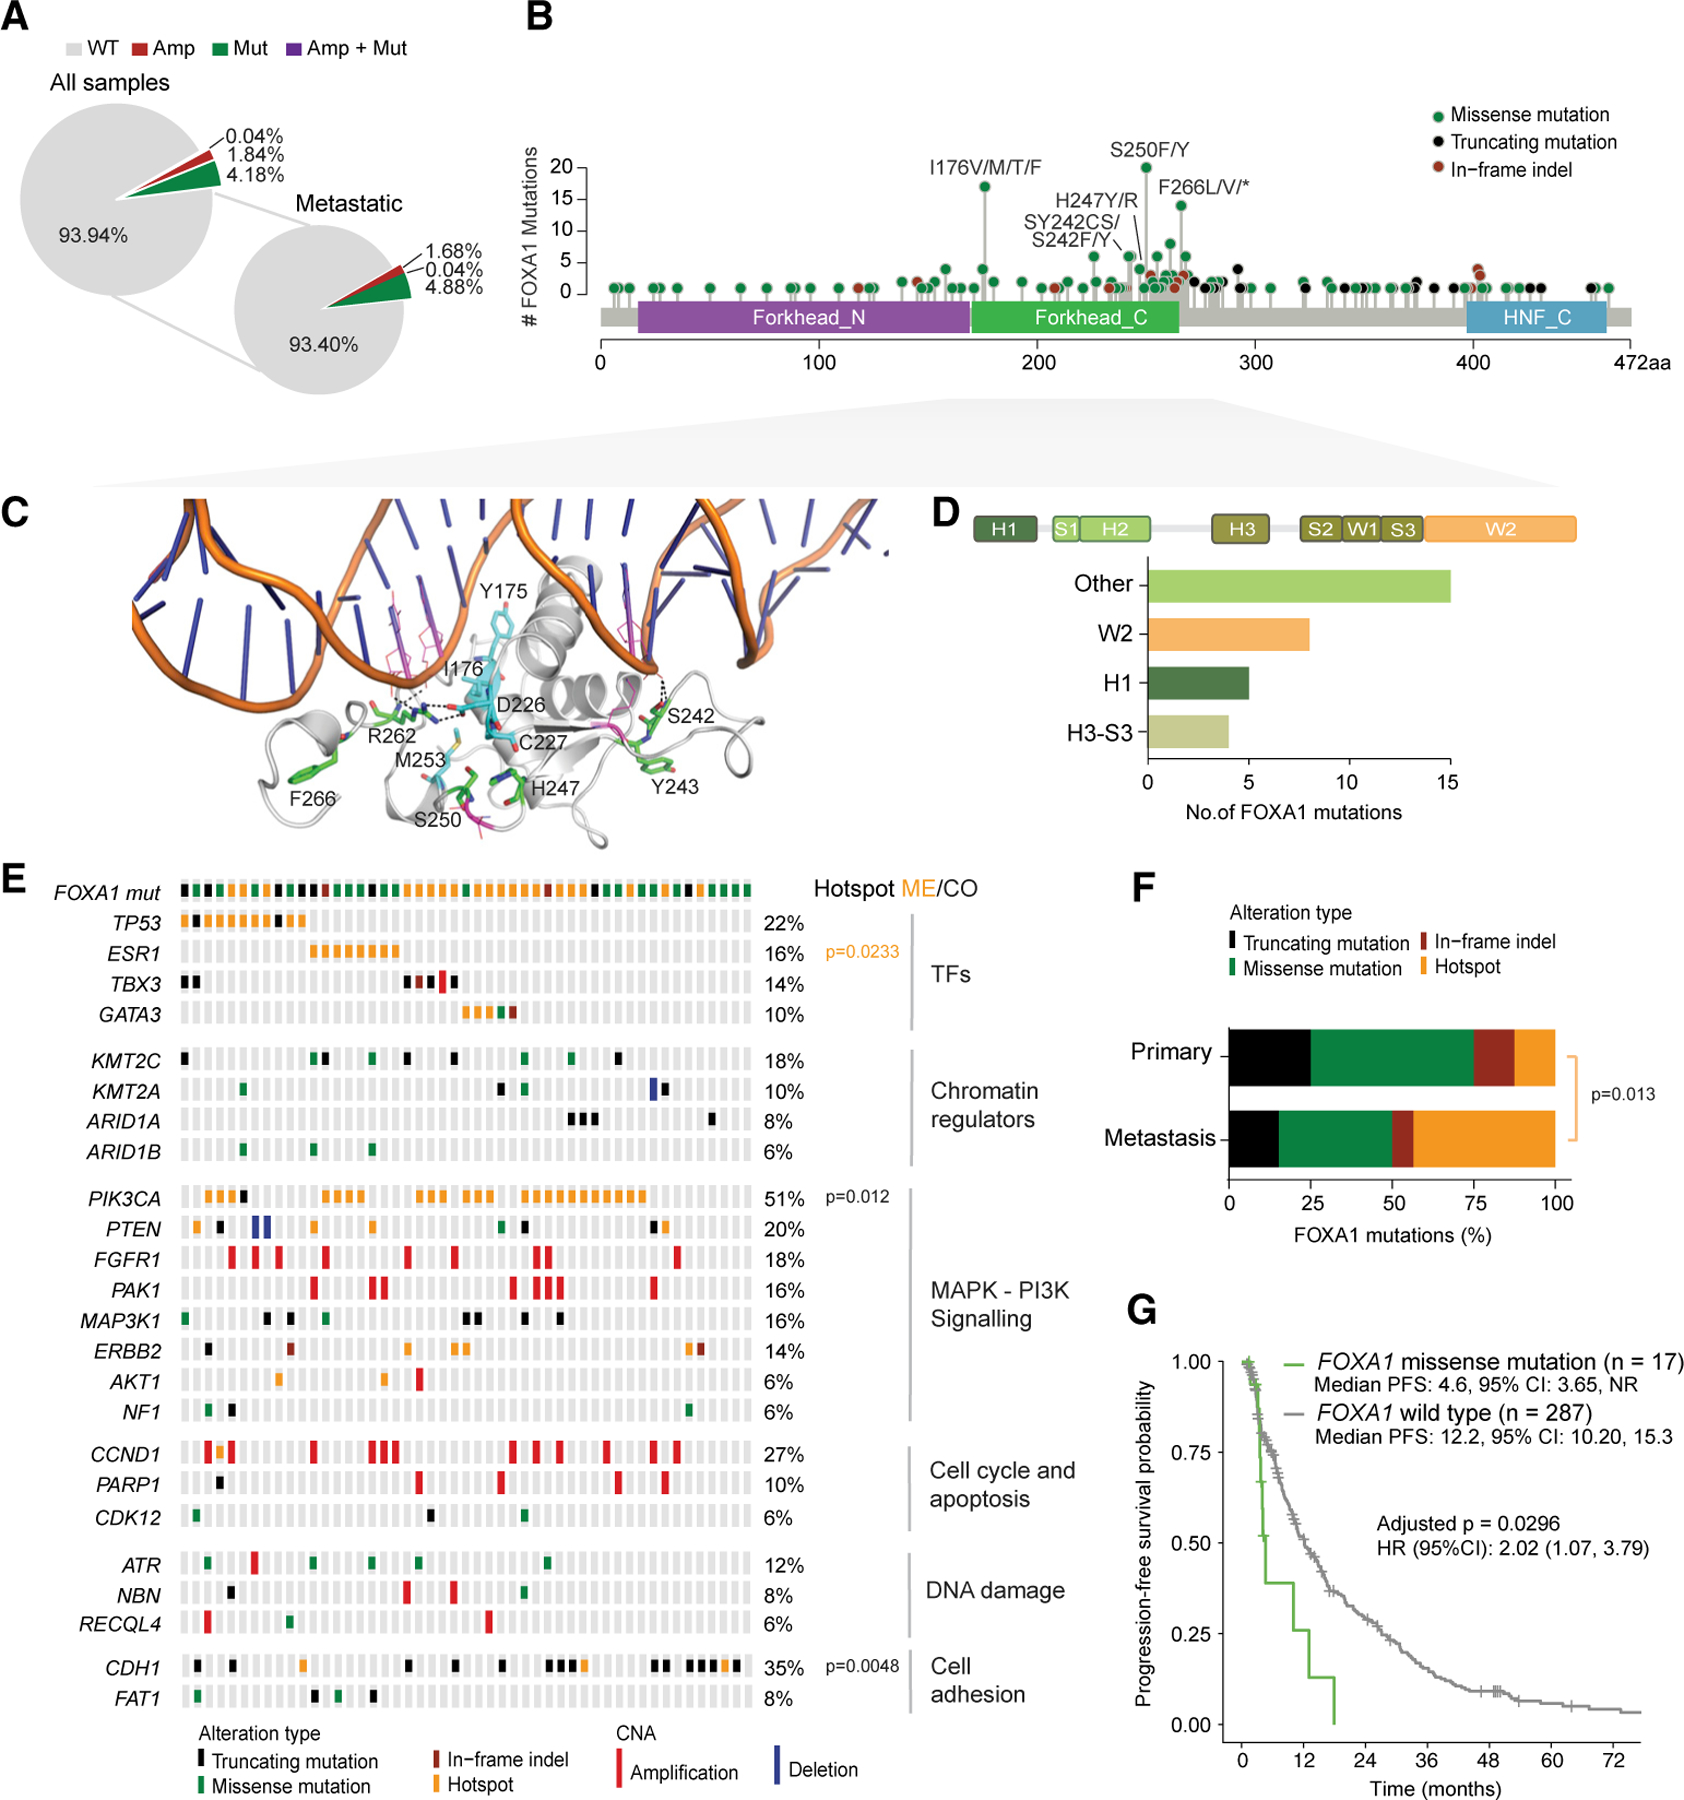
(A) Pie charts representing frequency of FOXA1 alteration types (wild-type [WT], amplification [Amp], mutation [Mut], or both [Amp + Mut] among all breast cancer patients or metastatic tumors; www.cbioportal.com).
(B) Lollipop plot depicting distribution of FOXA1 mutations (truncating, missense, and in-frame indels) found in breast cancer patients (www.cbioportal.org) along the protein sequence.
(C) 3D structure of the forkhead domain of the FOXA1-DNA complex generated by comparative homology modeling using the crystal structure (PDB: 1VTN) of the forkhead domain of FOXA3-DNA complex as template. Residues of interest mentioned throughout the manuscript are highlighted and labeled in the structure.
(D–G) Characterization of FOXA1 mutations from MSK-IMPACT breast cancer cohort (n = 1,918 breast cancer patients) (Razavi et al., 2018). (D) Barplot showing number of mutations per subdomains indicated. W2, Wing2; H1, Helix1; H3-S3, from helix 3 to third β strand.
(E) Association of FOXA1 mutant samples with pattern, frequency, and type of genomic alterations of the key breast cancer genes indicated. Genes with alteration frequency >5% are represented. Also shown is the mutual exclusivity (ME) between FOXA1 and ESR1 hotspot mutations as calculated by CoMET (cometExactTest package), and the co-occurrence (CO) between FOXA1 and PIK3CA or CDH1 mutations (Fisher’s exact test). p value as indicated.
(F) Frequency of FOXA1 alteration types in primary versus metastatic tumors. Hotspot mutations enrichment calculated by Fisher’s exact test.
(G) Kaplan-Meier curves displaying progression-free survival of patients harboring either WT or mutant FOXA1 under aromatase inhibitor treatment. p value as indicated, estimated using Cox proportional hazards model.
The co-occurrence of FOXA1 mutations with other prevalent alterations in breast cancer-related genes (e.g., PIK3CA, AKT1, or ARID1A) was as reported previously (Ciriello et al., 2015) (Figures 1E, S1F, and S1G). However, 35% of the FOXA1-mutated samples showed a significant concomitant mutation in CDH1, a hallmark of invasive lobular breast cancer (Ciriello et al., 2015; Lee et al., 2019). This was in contrast with the 17%–19% prevalence of CDH1 mutations in ER+ breast cancer (Figures 1E, S1F, and S1G) (Razavi et al., 2018). Hotspot mutations in PIK3CA, the catalytical subunit of PI3K were also significantly enriched in the FOXA1-altered cases, consistent with the enrichment of these alterations in luminal A breast cancer (TCGA, 2012). Among the different FOXA1 alterations, missense substitutions were the most prevalent (Figure 1F, green and yellow). FOXA1 hotspot mutations were more common in metastatic ER+ than in primary ER+ breast cancers (p = 0.013) (Figures 1F, yellow), and mutually exclusive with mutations in ESR1 (coding for ER, Figures 1E, S1F, and S1G), well-known drivers of endocrine therapy resistance (Jeselsohn et al., 2018; Merenbakh-Lamin et al., 2013; Toy et al., 2013).
Given the mutual exclusivity between FOXA1 hotspot and ESR1 mutations, we next studied whether the presence of FOXA1 mutations in breast cancers would be associated with clinical outcome after anti-estrogen therapy. Our analysis included all the patients with FOXA1 mutations in the MSK-IMPACT clinical series (n = 6,136 tumors, data lock 3/20/2020), in which we performed a full clinical annotation of all the tumors with FOXA1 missense mutations and filtered the patients treated with single-agent endocrine therapy. Our analysis included 17 eligible patients with metastatic breast cancers whose tumors harbored missense FOXA1 mutations in the tumor samples collected before the start of an aromatase inhibitor (AI) treatment and 287 metastatic breast cancer with pretreatment FOXA1 wild-type (WT) tumors as controls. Those patients harboring FOXA1 missense mutations presented a significantly shorter progression-free survival (PFS) than patients with WT FOXA1 (median PFS for mutant: 4.6m, 95% CI, 3.65; NR versus WT, 12.2; 95% CI, 10.20, 14.9; log rank p = 0.005) (Figure 1G). These results were statistically significant in the multivariate analysis adjusted for the line of therapy, sample type, tumor mutational burden, and fraction of genome altered (hazard ratio = 2.017; 95% CI, 1.072, 3.794; p = 0.0295) (Figure 1G), as well as in the models excluding the ESR1 mutant tumors (log rank p = 0.006, adjusted p = 0.0400) (Figure S1H; Table S1). The relatively small sample size of patients bearing FOXA1 mutations treated with selective ER degraders precluded survival analyses. Altogether, these data suggest that FOXA1 mutations are associated with a lower response to AIs.
FOXA1 Wing2 Mutations Provided a Growth Advantage under Estrogen Deprivation
To characterize the functional role of somatic FOXA1 mutations in breast cancer, we first investigated their intrinsic transcriptional activity. We focused on missense mutations occurring in the C terminus of the FKHD because of their relatively high frequency among patients with breast cancer and predicted functional outcome (www.cbioportal.org) (Figures 1B, S1B, and S1D). Among most recurrent alterations, the following mutations encompassing distinct subdomains of the C-terminal forkhead (FKH) were selected for study: Y175C and I176V in Helix1 (H1); D226N and C227R in between Helix3 (H3) and β strand2 (S2); SY242CS in β strand3 (S3); and H247Y, S250F, M253K, R262H, and F266L in Wing2. Expression of the FOXA1 mutants together with a FOXA1 reporter construct in HEK293T cells resulted in increased transcriptional activity of the mutants localized in between H3 and S2, and at Wing2, while Y175C and SY242CS showed a 20% and 50% decreased reporter activity, respectively (Figure S2A). We next performed atomistic molecular dynamics simulations to explore the effects of FOXA1 mutations on their interaction with DNA. While most mutations retained canonical interactions between WT FOXA1 and DNA, several mutations conferred structural alterations (Figures 2A and S2B). S250F and F266L adopted a stable α helix and a more ordered conformation compared with WT FOXA1, respectively. Conversely, the mutation SY242CS caused a loss in H bond interactions of residue S242 (carbonyl side chain) with DNA (the backbone). Mutations predicted to enhance DNA interactions (D226N, C227R, and M235K) or structural order (S250F and F266L) resulted in improved binding to DNA (negative ∆∆G), whereas the SY242CS mutation was predicted to lose interactions with the DNA and showed reduced binding (positive ∆∆G) (Figure S2C).
Figure 2. FOXA1 Wing2 Mutations Provided a Growth Advantage under Estrogen Deprivation.
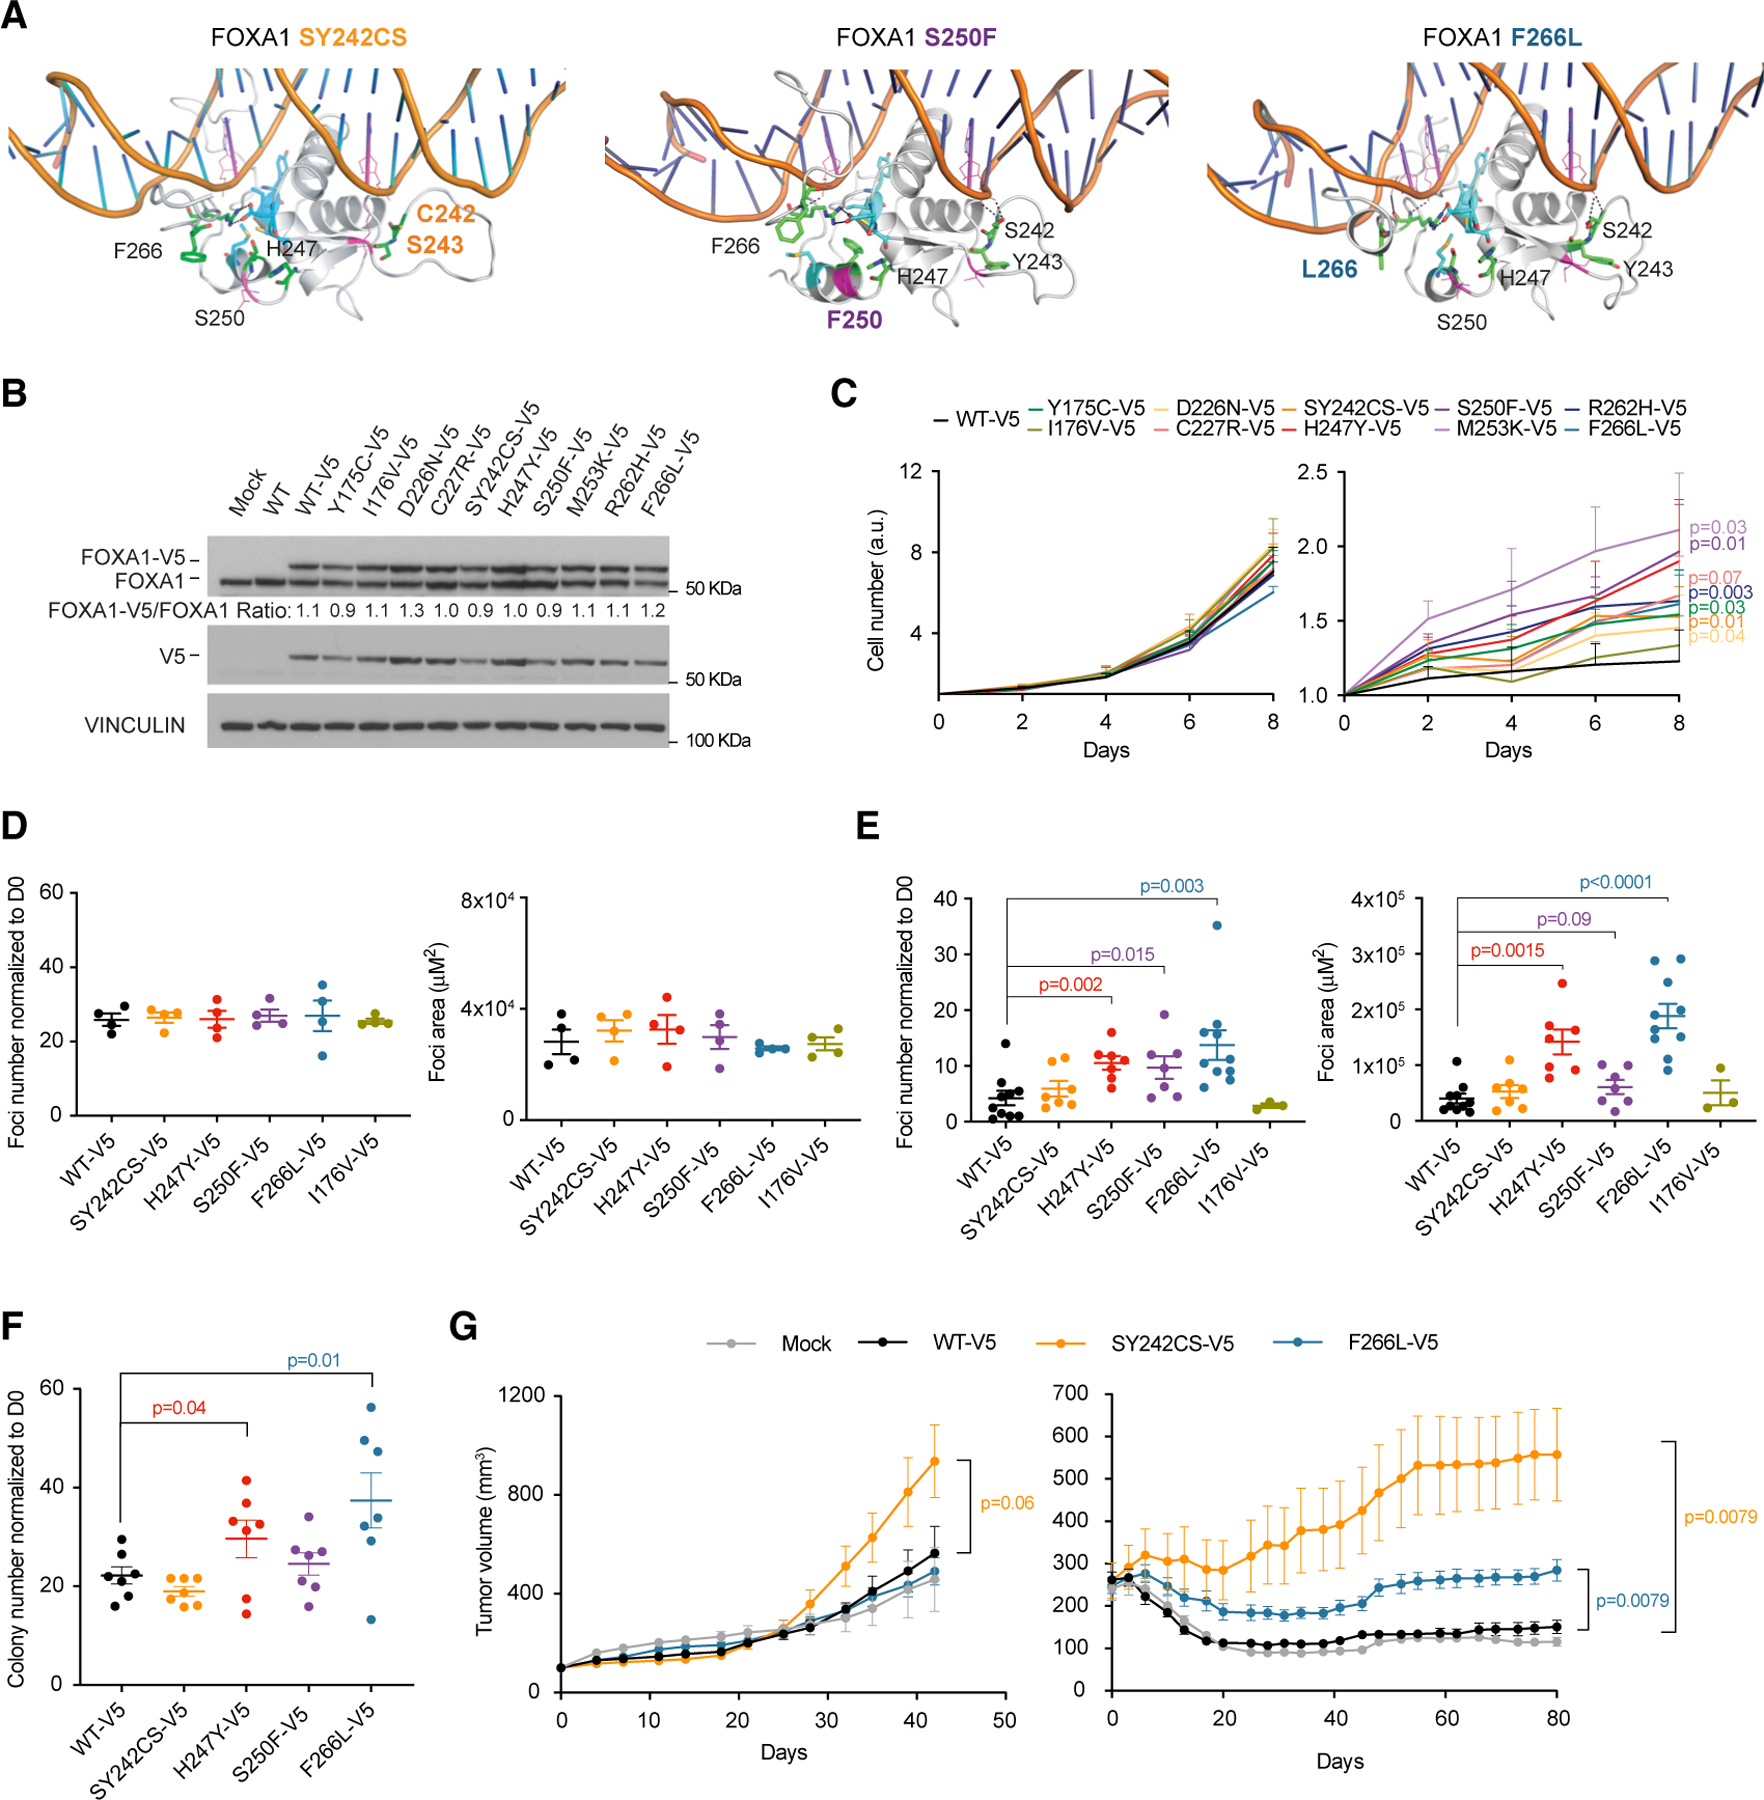
(A) Impact of ectopic expression of V5-tagged FOXA1 variants (SY242CS, S250F, and F266L) on 3D structural interaction of the forkhead domain (FKHD) with DNA.
(B and C) Impact of ectopic expression of V5-tagged FOXA1 variants (Y175C, I176V, D226N, C227R, SY242CS, H247Y, S250F, M253K, R262H, and F266L) on protein abundance (B) (representative experiment is shown) and cell number in full medium and under estrogen deprivation in vitro (C) left (n = 4 independent experiments) and right (n = 6 independent experiments) panels, respectively, in MCF7 cell lines. Two-tailed Student’s t test, p values as indicated.
(D) Effect of ectopic expression of FOXA1 SY242CS-V5, H247Y-V5, S250F-V5, and F266L-V5 on foci number (left) and foci area (right) compared with WT FOXA1 in MCF7 cells in full medium (left, n = 4 independent experiments as indicated by dots). One-tailed Student’s t test, p values as indicated.
(E) Effect of ectopic expression of FOXA1 SY242CS-V5, H247Y-V5, S250F-V5, and F266L-V5 on foci number (left) and foci area (right) as compared with WT FOXA1 in MCF7 cells under estrogen deprivation (n = 7 independent experiments as indicated by dots). One-tailed Student’s t test, p values as indicated.
(F) Effect of ectopic expression of FOXA1 SY242CS-V5, H247Y-V5, S250F-V5, and F266L-V5 on anchorage-independent growth upon estrogen deprivation in MCF7 cells (n = 7 independent experiments as indicated by dots). One-tailed Student’s t test, p values as indicated.
(G) In vivo xenografts of MCF7 cells expressing exogenous FOXA1 WT-V5, SY242CS-V, and F266L-V5, together with controls cells, under estrogen supplementation (0.72 mg estrogen pellet) (left panel: n = 5 tumors for Mock, SY242CS-V5, and F266L-V5, n = 4 for WT-V5) or upon estrogen pellet removal (right panel: n = 5 per group).
Two-tailed Mann-Whitney U test, p values as indicated. Error bars, mean ± SEM.
To investigate the biological consequences of FOXA1 mutations on the growth of ER+ breast cancer, we generated MCF7 ER+ breast cancer cell lines expressing similar levels of V5-tagged FOXA1 variants and controls (Figure 2B). As no functional differences were observed between tagged WT and non-tagged WT, for all the experiments we compared our FOXA1 mutants with WT-V5 referred to herein as WT. When subjected to two-dimensional growth assays, no changes in growth were detected among the different mutants in full medium conditions (Figure 2C, left panel). However, when cells were grown under estrogen-deprived conditions, several FOXA1 mutants showed a growth advantage as compared with WT FOXA1 control cells (Figure 2C, right panel). Specifically, mutations in the Wing2 conferred the highest gain in proliferative capacity in the absence of estrogen. These results were corroborated by performing low-density experiments measuring foci number and foci area in MCF7 and T47D cells harboring most recurrent FOXA1 mutations (Figures 2D, 2E, and S2D), and anchorage-independent (Figure 2F) growth assays in MCF7 cells. Moreover, growth advantage of SY242CS and F266L under ‘‘estrogen low’’ conditions was further observed in vivo, where xenografts expressing these mutants continued to grow after the estrogen pellets were removed from the mice, reverting estrogen levels in serum to basal condition (Figures 2G, right panel, and S2E and S2F). Of note, SY242CS also showed a mild growth advantage in the presence of the estrogen pellet (Figure 2G, left panel). To broaden our characterization of FOXA1 mutations’ sensitivity to other endocrine therapies, we also performed in vitro growth assays in the mutant-FOXA1-expressing MCF7 cell lines upon tamoxifen or fulvestrant treatment. FOXA1 mutants showed equal sensitivity to tamoxifen or fulvestrant treatment in comparison with WT FOXA1 (Figures S2G and S2H). Thus, our data suggest that FOXA1 mutants mediate resistance to AIs but not to fulvestrant or tamoxifen.
FOXA1 Wing2 Mutations Induced an Enhanced Estrogen Response through Increased Occupancy at ER Loci
FOXA1 can interactwith compacted chromatin (Iwafuchi-Doi et al., 2016; TCGA, 2012; Zaret and Carroll, 2011) and reprogram binding of cooperating factors, such as ER, in breast cancer (Carroll et al., 2005). To define the role of FOXA1 mutations on genome-wide chromatin binding, we performed chromatin immunoprecipitation sequencing (ChIP-seq) studies in MCF7 ER+ breast cancer cells engineered to express FOXA1 genetic alterations. Based on the frequency and functional outcome (Figures 1 and 2), we selected four mutations: the three most recurrent in Wing2 (H247Y, S250F, and F266L) and one outside Wing2 affecting a DNA-contact residue (SY242CS; Ciriello et al., 2015). To determine whether FOXA1 mutations affect the ER-FOXA1 shared cistrome, we performed ChIP-seq under estrogen-depleted condition (DMSO), upon estrogen (E2) induction and in full medium (FM). Although all samples showed similar genomic feature distribution (Figure S3A), upon estrogen stimulation the Wing2 mutant FOXA1 exhibited a substantially stronger binding in comparison with WT FOXA1. In contrast, SY242CS FOXA1 showed the highest number of differential peaks compared with WT FOXA1 in FM condition (Figure S3B). To delineate the cistromic alterations driven by these mutations, dynamic peaks were analyzed by unsupervised clustering analysis. We obtained a total atlas of 59,620 peaks, with 15,819 dynamic peaks distributed in seven clusters and showing similar genomic distribution (~35% intergenic, ~50% intronic, 4% exon, ~2% UTR, and ~8% promoter regions) (Figures 3A and 3B). k-means clustering analysis of our ChIP-seq data highlighted an estrogen-responsive group of peaks, covering 13.24% of the total dynamic peaks (cluster 6; Figure 3C). To dissect each of the clusters, we performed homer de novo motif analysis (Heinz et al., 2010). While most clusters displayed a significant enrichment for the FOXA1-binding motif (FKH), cluster 6 revealed ‘‘nuclear receptor’’ as the top significant enriched motif across FOXA1 mutant sites, in particular those sites found affecting the Wing2 domain (Figures 3D and S3C), suggestive of increased binding of the Wing2 mutants to ER loci. Indeed, closer examination of estrogen-induced peaks from cluster 6 showed a clear increase in binding affinity for Wing2 domain mutants (H247Y, S250F, and F266L) upon estrogen stimulation as compared with WT FOXA1 cells (Figures 3E and S3D). To validate the specificity of our ChIP-seq peaks, we used publicly available ChIP-seq datasets from the Encyclopedia of DNA elements (ENCODE; Davis et al., 2018) and the Gene Expression Omnibus (Edgar et al., 2002) repository. Integration of public FOXA1 ChIP-seq data with our dataset confirmed that our peaks were FOXA1 specific. Similarly, public ER ChIP-seq data verified high overlap (~90%) of ER genome-wide occupancy with cluster 6 of FOXA1 mutant sites (Figures 3F and 3G). Consistent with this observation, Wing2 FOXA1 mutants showed increased binding upon E2 induction at canonical ER target genes, namely TFF1 and IGFBP4 (Figure 3H). These findings were further validated by integrating the public ER ChIP-seq data and ChIP-seq cluster 6 peaks for each FOXA1 variant (Figure S3E), where 69% of estrogen-induced peaks in cluster 6 overlapped with ER sites (Figure S3F). Of note, peaks of FOXA1 mutation SY242CS at cluster 6 displayed a similar but markedly attenuated phenotype.
Figure 3. FOXA1 Wing2 Mutations Induced an Enhanced Estrogen Response through Increased Occupancy at ER Loci.
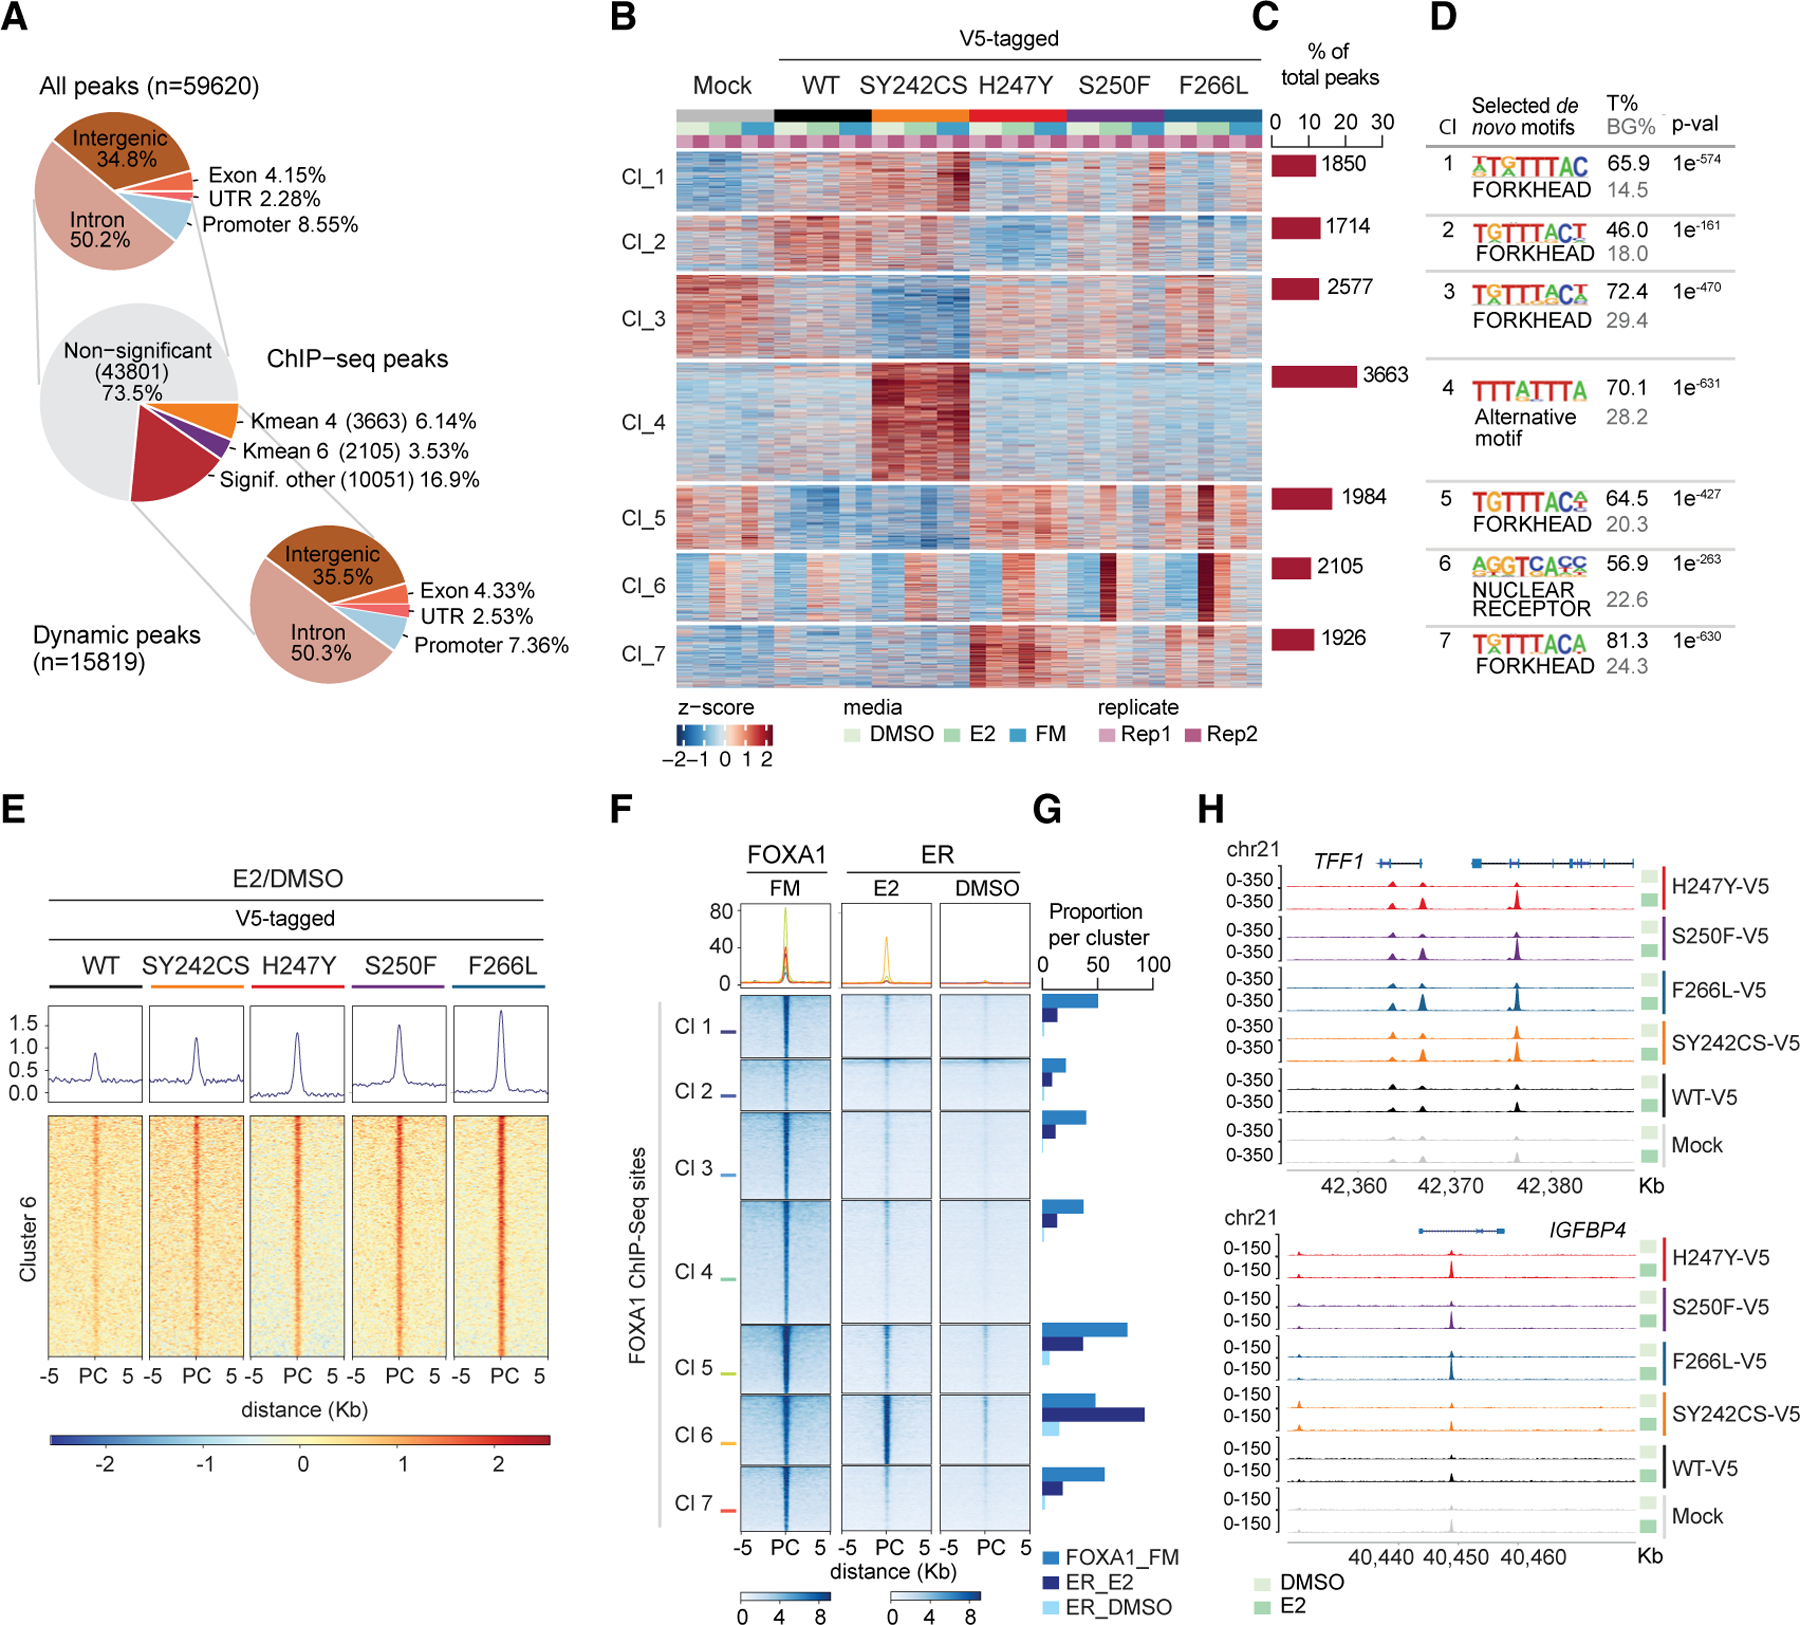
(A) Pie plots representing percentages and genomic features of all ChIP-seq peaks and dynamic peaks.
(B and C) Heatmap (B) and barplot (C) of k-means clustering of ChIP-seq peaks from FOXA1 mutant (SY242CS-V5, H247Y-V5, S250F-V5, and F266L-V5) and control (WT-V5, WT, and Mock, empty vector) MCF7 cells, representing seven clusters (B) and percentage and number of peaks per cluster (C) under the conditions indicated. Rep1, replicate 1; Rep 2, replicate 2 (n = 2 biological replicates).
(D) Table listing selected homer de novo motifs per cluster in (B) Fisher’s exact rest, p value (p-val) as indicated. T%, percentage of target sites; BG%, background percentage; Cl, cluster. (E) Tornado plot representing estrogen-induced FOXA1 binding peaks at cluster 6 for FOXA1 mutant (SY242CS-V5, H247Y-V5, S250F-V5, and F266L-V5) and WT-V5 MCF7 cells. PC, peak center. Average of two biological replicates is represented.
(F and G) Tornado plot (F) and barplot (G) showing ChIP-seq peaks and proportions of FOXA1 (ENCODE, ENCSR126YEB) and ER (GEO: GSE59530; Franco et al., 2015) overlap with our FOXA1 ChIP-seq sites in MCF7 cells. PC, peak center.
(H) ChIP-seq tracks of FOXA1 in FOXA1 mutant (SY242CS-V5, H247Y-V5, S250F-V5, and F266L-V5) and control MCF7 cells (Mock and WT-V5) at TFF1 and IGFBP4 gene loci at chromosome 21.
FOXA1 Wing2 Mutations Induced an Enhanced Estrogen Response
To elucidate the transcriptomic impact of the specific cistromic changes driven by the FOXA1 alterations, we performed RNA sequencing (RNA-seq) of the cells expressing the different mutants. Overall, k-mean-based clustering showed a preserved E2-dependent transcriptional program for Wing2 mutations as compared with WT FOXA1, as noticeable in RNA-seq cluster 3 (Figure S4A). In line with the cistromic changes observed, gene set enrichment analysis (GSEA) identified estrogen response as a consistently enriched pathway in the three Wing2 variants (normalized enrichment score: H247Y = 2.8, S250F = 3.02, and F266L = 2.74; all p adjusted values < 0.01) compared with WT FOXA1 (Figures 4A, S4A, and S4B). These data were consistent with increased genome-wide occupancy of FOXA1 mutants at ER binding sites leading to an enhanced estrogen response, suggesting the presence and dependence of a functional ER complex in cells bearing Wing2 mutant FOXA1. To address this, we treated the FOXA1 mutant cells with the ER degrader fulvestrant and investigated the expression levels of canonical ER target genes (Figures S4C and S4D). The expression of ER targets, such as PGR, TFF1, GREB1, or IGFBP4 was abrogated upon fulvestrant treatment in the FOXA1 mutant MCF7 cells confirming their dependence on ER.
Figure 4. Wing2 Mutants Drove an Enhanced Estrogen Response.
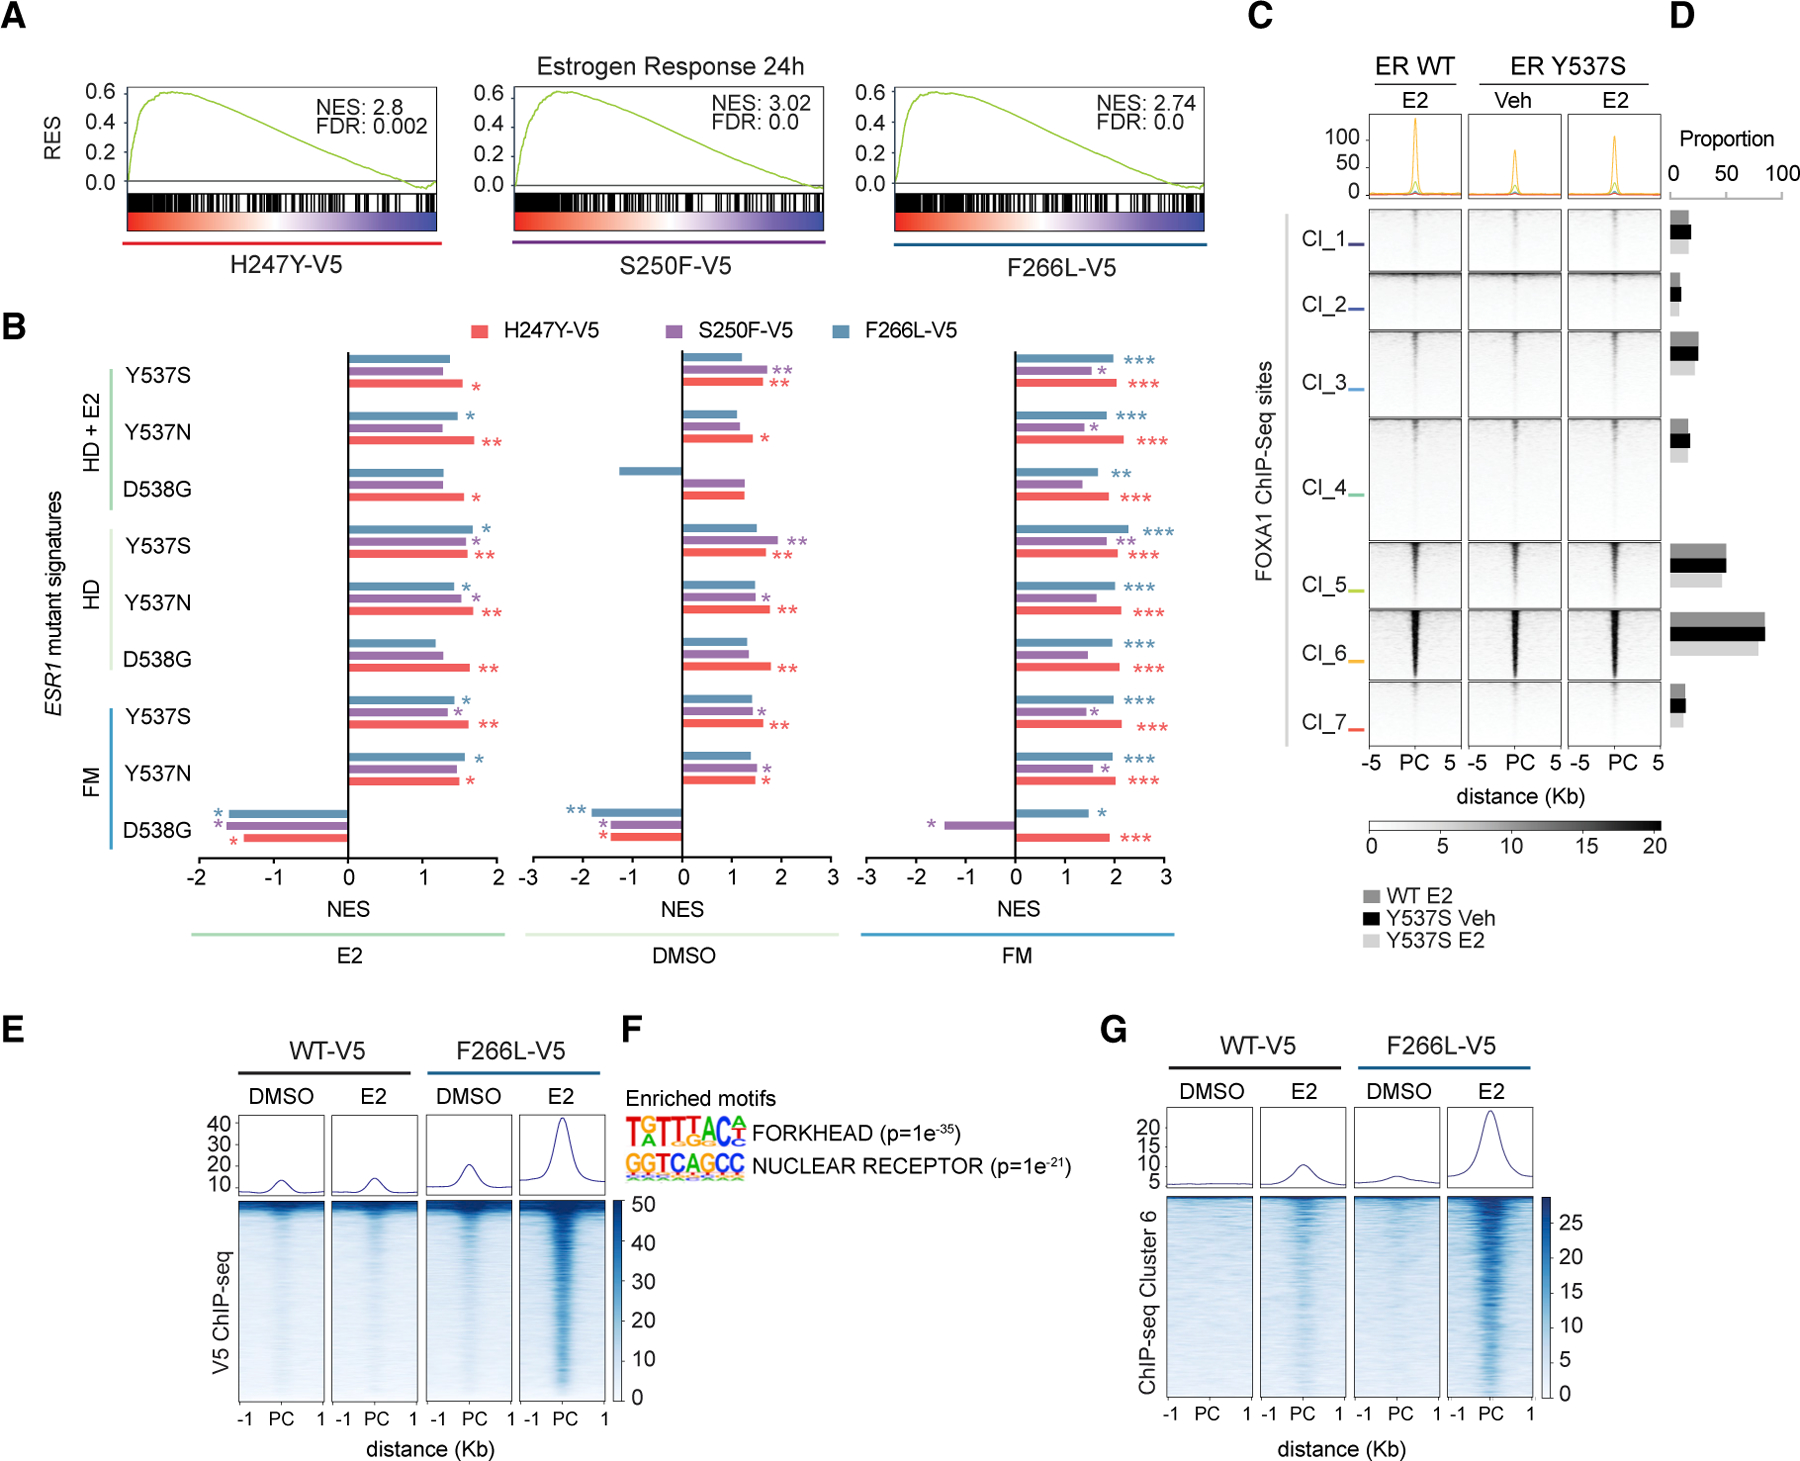
(A) Gene set enrichment analysis (GSEA) plot showing ‘‘Dutertre Estradiol Response 24h Up’’ enriched in RNA-seq from FOXA1 Wing2 mutant cells (H247Y-V5, S250F-V5, and F266L-V5) as compared with FOXA1 WT-V5 cells. RES, running enrichment score, as indicated. False discovery rate (FDR) represents p adjusted value, calculated using the GSEA package. DMSO, estrogen depletion; E2, upon estrogen stimulation; FM, in full medium.
(B) Comparison of ESR1 mutant (Y537S, Y537N, and D538G) gene signatures compared with WT ESR1 in hormone-depleted (HD) medium, hormone depleted estrogen induced (HD + E2) and FM, with FOXA1 mutant (H247Y, S250F, and F226L) gene signatures compared with WT FOXA1 under three different media: E2, DMSO, and FM. Adjusted p value calculated using the GSEA package is also shown. *p < 0.05, **p < 0.01, ***p < 0.001.
(C and D) Tornado plot (C) and barplot (D) representing ChIP-seq peaks and proportions of WT ER and mutant ER (Jeselsohn et al., 2018; accession no. PRJNA417235) overlap upon vehicle (Veh) or estrogen (E2) induction, with our FOXA1 ChIP-seq sites in MCF7 cells. PC, peak center.
(E and F) Tornado plot showing V5-ChIP-seq upregulated peaks in E2 and DMSO conditions in WT-V5-, SY242CS-V5-, and F266L-V5 FOXA1-expressing MCF7 cells. Also shown are the enriched motifs for nuclear receptor (p = 1 3 × 10‒21) and FKH (p = 1 3 × 10‒35) by Fisher’s exact test (n = 1 biological replicate).
(G) Tornado plot representing V5-ChIP-seq peak overlap with FOXA1 ChIP-seq cluster 6 from Figure 3B.
DMSO, estrogen depletion; E2, upon estrogen stimulation; FM, in full medium.
Given the well-established association between FOXA1 and ER (Carroll et al., 2005; Fu et al., 2016; Hurtado et al., 2011; Ross-Innes et al., 2012; Toska et al., 2017, 2019) and that FOXA1 hotspot mutations are mutually exclusive with ESR1 mutations (Figure 1E), we compared the transcriptomic and cistromic profiles of FOXA1 mutants with those of ESR1 mutants performed in MCF7 cells (Jeselsohn et al., 2018). We built a gene signature for each ESR1 mutation (Y537S, Y537N, and D538G) versus WT ESR1 in all three media namely, hormone-depleted (HD), hormone-depleted plus estrogen (HD + E2), and FM and overlapped the signatures with the FOXA1 mutation gene signatures compared with WT FOXA1. Notably, we observed that the majority of ESR1 mutant gene signatures significantly overlapped and were positively associated with the Wing2 mutant (F266L, S250F, and H247Y) gene signatures (Figure 4B and S4E). These data highlighted the fact that Wing2 FOXA1 mutants functionally regulated the transcriptome of similar genes to those controlled by ESR1 mutants, involved in ER-dependent transcription and endocrine therapy-resistant phenotype (Jeselsohn et al., 2018).
We next overlapped the cistromic data of our FOXA1 mutants and a representative ESR1 mutant, Y537S, together with WT ESR1 (Jeselsohn et al., 2018). We confirmed that the WT ESR1 bound most strongly at FOXA1 cluster 6 (Figure 4C) in line with our previous data (Figure 3F). Importantly, we observed that the ESR1 mutant Y537S cistrome in hormone-deprived medium or upon E2 showed marked binding at cluster 6 of FOXA1 mutant sites. Specifically, over 90% of FOXA1 mutant binding at cluster 6 overlapped with Y537S ER mutant binding (Figure 4D). These data demonstrated increased genome-wide occupancy of FOXA1 mutants at ER mutant binding sites, which is consistent with the overlapped transcriptomic signatures. To further isolate the mutant FOXA1 binding sites from endogenous FOXA1, we also performed V5 ChIP-seq for WT FOXA1 and F266L FOXA1 in DMSO or E2 settings. V5 ChIP-seq validated F266L-FOXA1 enhanced binding upon E2 compared with WT FOXA1 with FKH and nuclear receptor enriched motifs in these sites (Figures 4E and 4F). These peaks also showed high overlap with FOXA1 ChIP-seq cluster 6 (Figure 4G). Altogether our findings suggest that activation of estrogen response is a potential mechanism of resistance to endocrine therapy driven by Wing2 FOXA1 mutations.
FOXA1 SY242CS-Driven Conformational Changes Led to a Non-canonical DNA Binding Motif, Cistrome, and Transcriptome
ChIP-seq unsupervised clustering analysis also revealed a pronounced SY242CS-specific group of dynamic peaks in cluster 4 (Figure 3B), which accounted for nearly a quarter (23.17%) of total dynamic peaks (Figure 3C), and cluster 3 with diminished binding affinity for FOXA1 SY242CS (Figure S4A). Cluster 4 represented a distinct SY242CS-specific cistrome with thousands of new binding sites gained by SY242CS as compared with WT FOXA1, regardless of estrogen stimulation (Figure 5A), suggesting that this mutation might exhibit preference for alternative chromatin binding sites. Homer de novo motif analysis (Heinz et al., 2010) of ChIP-seq cluster 4 demonstrated enrichment for an alternative motif (TTTA/GTTTA/G, Figure 3D). We identified 3,663 dynamic peaks for SY242CS FOXA1, which were observable at the gene level as well, as exemplified by EFEMP1 and FST genes (Figures 5B and S5B).
Figure 5. FOXA1 SY242CS-Driven Conformational Changes Led to a Non-canonical DNA Binding Motif, Cistrome, and Transcriptome.
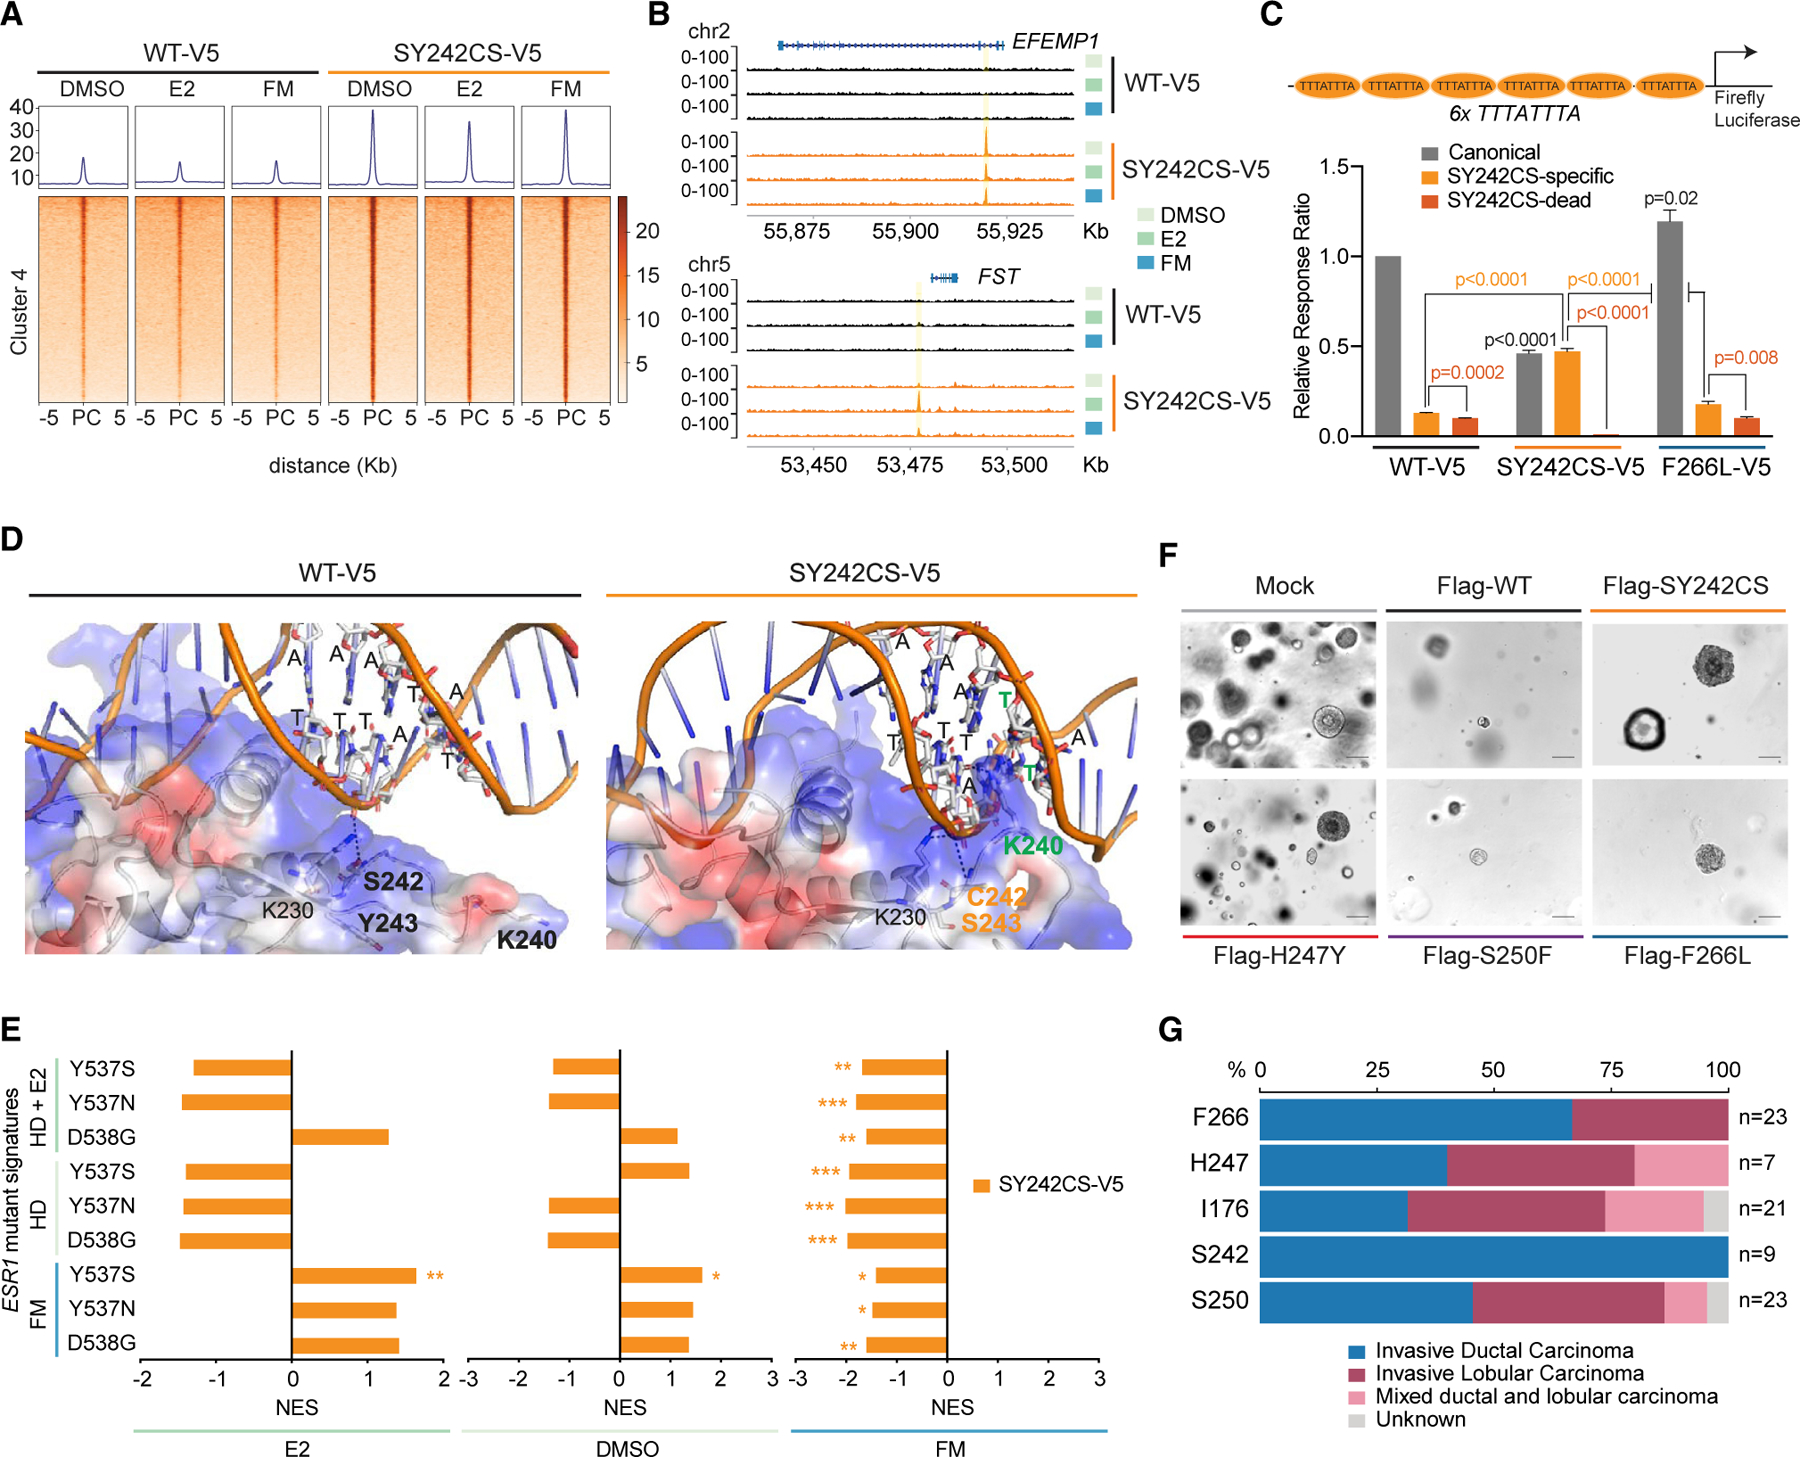
(A) Tornado plot showing ChIP-seq peaks of FOXA1 cluster 4 in Figure 3B from MCF7 cells expressing either FOXA1 WT or SY242CS under the conditions indicated. PC, peak center. Average of two biological replicates is represented.
(B) ChIP-seq tracks of FOXA1 in either SY242CS-V5 or WT FOXA1 MCF7 cells at EFEMP1 and FST gene loci at chromosome 2 and 5, respectively, under medium condition indicated.
(C) Luciferase reporter assay showing activity of FOXA1 variants (WT-V5, SY242CS-V5, and F266L-V5) on canonical forkhead motif (positive control, gray), SY242CS-specific motif (TTTATTTA, light orange) and SY242CS-dead motif (TTTATGTA, dark orange) DNA templates. Firefly luciferase to Renilla luciferase ratio signals normalized to FOXA1 WT signal on canonical forkhead motif reporter are represented. Two-tailed Student’s t test with Welch’s t test for different variance correction, p values as indicated. Error bars, mean ± SEM.
(D) 3D structure of the forkhead domain of the FOXA1 SY242CS-DNA (SY242CS-specific motif TTTATTTA) complex generated by comparative homology modeling using the crystal structure (PDB: 1VTN) of the forkhead domain of FOXA3-DNA complex as template. Residues C242 and S243 are highlighted in orange. Residue K240 and thymines involved in interaction are highlighted in green.
(E) Comparison of ESR1 mutant (Y537S, Y537N, and D538G) gene signatures compared with WT ESR1 in hormone-depleted (HD) medium, hormone-depleted estrogen-induced (HD + E2) and FM, with FOXA1 mutant (SY242CS) gene signatures compared with WT FOXA1 under three different media: E2, DMSO, and FM. NES, normalized enrichment score, as indicated. Adjusted p value calculated using the GSEA package is also shown. *p < 0.05, **p < 0.01, ***p < 0.001.
(F) Representative images of organoid lines overexpressing variants of FOXA1 via the doxycycline-inducible pCW vector 7 days after seeding. Images from a single biological experiment. Scale bar, 100 µm.
(G) Stacked barplot representing the histology of tumors harboring FOXA1 mutations from MSK-IMPACT cohort.
DMSO, estrogen depletion; E2, upon estrogen stimulation; FM, in full medium.
To determine the specificity and the activity of this motif, we also engineered a luciferase reporter containing the new TTTATTTA motif represented six times in tandem and a non-binding control (TTTATGTA). Among all variants tested (WT and F266L as controls), the SY242CS mutant was the only one to significantly induce transcription mediated by the specific motif (Figure 5C). As expected, the transcriptional reporter activity was abrogated when the motif was mutated. Structural modeling of the binding of WT or SY242CS FOXA1 to the new motif TTTATTTA suggested that SY242CS underwent conformational changes not seen for WT FOXA1, which may result in changed DNA binding and/or differential interactions with cofactors. In our model, K240 interacts closely with the thymines from the new DNA motif (Figure 5D). In contrast, no interaction between K240 from the WT FOXA1 and the TTTATTTA region of DNA was observed. Calculation of binding energies to FKH or SY242CS motif showed favorable energy expenditure (negative ∆∆G) toward the SY242CS-specific motif for the SY242CS mutant (Figure S5C). In addition, energy expenditure of mutation K240A or K240D of SY242CS mutant showed a marked increase in the energy required (positive ∆∆G) to bind to the SY242CS motif, suggesting that the conformational change in K240 conferred by SY242CS mutant might induce a preference toward the TTTATTTA motif (Figure S5D).
Quantification of all the ChIP-seq peaks that displayed the SY242CS motif at the chromatin context demonstrated that this motif was significantly enriched in SY242CS-expressing cells in comparison with WT FOXA1 (Figures S5E and S5F). To assess whether SY242CS mutant protein in isolation preferentially targeted the SY242CS motif in vitro we performed electro-phoretic mobility shift assay (EMSA). We found that both WT and SY242CS bound the consensus FKH motif with nanomolar affinity demonstrating that the mutations did not obstruct DNA binding per se (Figures S5G and S5H). To evaluate whether FOXA1 or SY242CS exhibit altered preferences for DNA, we simultaneously incubated the proteins with Cy5-labeled FKH consensus and Cy3-labeled SY242CS probes and quantified the relative retardation of the two probes. We found that both protein variants were able to bind the SY242CS DNA element but retained an overall preference for the canonical FKH DNA (Figures S5I and S5J). These data may suggest a unique function of SY242CS in vivo and in the chromatin context, a phenomenon previously stated as ‘‘latent differences’’ where cofactor binding and the chromatin landscape in vivo evoke differences in DNA binding specificity as it has been observed for homeobox and paired box transcription factors (TFs) (Hu et al., 2017; Jolma et al., 2015; Slattery et al., 2011).
Next, we assessed the impact of FOXA1 SY242CS-specific cistrome on gene expression through RNA-seq analysis. K-means clustering of the RNA-seq dataset revealed a group of genes (cluster 4) that were markedly overexpressed in SY242CS FOXA1 MCF7 cells in all three media, suggestive of a SY242CS-specific transcriptome (Figure S4A). GSEA identified cholesterol and adipogenesis gene signatures enriched in the three different media conditions for the SY242CS mutant (Figure S5K and Table S2). SY242CS mutant also displayed cell proliferation signatures, such as mTORC1 signaling, MYC targets, G2M checkpoint, and E2F targets (Figure S5K), in accordance with the growth advantage shown by this mutant compared with WT or other FOXA1 mutants. In contrast to Wing2 mutants, SY242CS did not display a significant enrichment of estrogen response or epithelial to mesenchymal transition (Figure S5K).
As performed with the Wing2 mutants, we also compared the transcriptomic profiles of FOXA1 SY242CS with those of ESR1 mutant gene signatures in MCF7 cells (Jeselsohn et al., 2018).
In contrast to the positive enrichment of ESR1 mutants with the Wing2 FOXA1 mutations, the transcriptomic signature of the FOXA1 SY242CS mutant displayed a negative association with the majority of ESR1 mutant signatures in all three media (Figure 5E). These data suggest that the SY242CS mutant regulates the expression of unique genes in comparison with the Wing2 mutants.
To further elucidate the outcome of FOXA1 mutations on the growth of primary breast cells, we introduced WT, the Wing2 FOXA1 mutants, and the SY242CS variant using doxycycline-inducible lentiviral constructs in primary murine mammary organoids (Duarte et al., 2018). In this setting, expression of FOXA1 SY242CS led to the formation of larger organoids as compared with WT FOXA1 (Figures 5F and S5L), indicating enhanced growth induced by SY242CS. Furthermore, in our MSK-IMPACT patient cohort we observed that mutations affecting S242 were histology specific, arising only in ductal cancers, while the Wing2 mutants arose in both ductal and lobular cancers (Figure 5G). Of note, it has been reported that ductal cancers display higher Ki-67 levels and are more proliferative than lobular breast cancers (Wong et al., 2014). This was also in line with the genes upregulated by the SY242CS mutation related to proliferation and tumorigenesis. In summary, the FOXA1 variant SY242CS showed a neomorphic phenotype, triggering a unique cistrome and transcriptome, suggesting an alternative acquired pioneering function.
FOXA1 SY242CS Opened New Loci Enriched for the Non-canonical Motif
We next performed assay for transposase-accessible chromatin using sequencing (ATAC-seq) to assess the genome-wide chromatin accessibility changes driven by FOXA1 variants upon DMSO, E2, and in FM conditions. k-means-based clustering on the differentially accessible regions identified eight clusters. In contrast to genome-wide binding changes revealed by ChIP-seq, we did not observe any estrogen-induced cluster by ATAC-seq (Figure 6A). This suggests that Wing2 mutations may provide FOXA1 a higher affinity to bind at ER loci upon E2 stimulation, whereas they might not have the potential to enhance chromatin openness at the same binding sites in comparison with WT FOXA1. In contrast, we identified a SY242CS-specific ATAC-seq cluster 6, which accounted for 24.5% of total dynamic peaks (Figure 6B), in agreement with the SY242CS-mediated cistromic changes previously observed (Figure 3B). Importantly, homer de novo motif analysis (Heinz et al., 2010) of this cluster yielded the same motif TTTA/GTTTA/G previously identified in ChIP-seq cluster 4 as the top enriched motif, further supporting that the variant FOXA1 SY242CS protein acquired a changed specificity for DNA binding sites in a chromatin context (Figure 6C). Remaining clusters exhibited enrichment of either FKH or AP1, a key cooperating FOXA1 TF, in accordance with previous reports (Lupien et al., 2008). Other examples of enriched cooperating TFs were TEAD, MYB, SMAD, AP2γ, GRHL1, and GATA3 (Figure S6A). Integration of public FOXA1 ChIP-seq dataset with the ATAC-seq clusters further validated the specificity for FOXA1 occupancy (Figure 6D). Likewise, we verified the extent of AP1 complex recruitment at FOXA1 binding sites using available public ChIP-seq data for each of the subunits conforming AP1 (FOS, JUN, and JUND), and for the TFs GATA3, ER, TEAD4, AP2γ, and GRHL1 (Xu et al., 2020) (Figures 6D–6I). The ATAC-seq cluster 6 (FOXA1 SY242CS), however, displayed an attenuated association with most of the coregulatory partners interrogated, suggesting either diminished requirement of their function or potential association with alternative cooperating factors. At the SY242CS-specific ChIP-seq cluster (cluster 4), the gain of chromatin accessibility was stronger in SY242CS in comparison with the WT FOXA1 (Figure 6J), consistent with the presence of the alternative motif in both clusters. In the T47D cell lines, we also identified a SY242CS-specific ATAC-seq group of peaks that were also enriched for the motif TTTG/ATTTG/A (Figures S6B and S6C). In contrast, at ChIP-seq cluster 3, in which the FKH motif was enriched and SY242CS binding was low, no difference in chromatin opening was observed for FOXA1 WT and SY242CS (Figure S6D). This indicates a stronger functional outcome for the enhanced binding sites enriched with the new motif and suggests a mechanism by which FOXA1 SY242CS mutant selectively targets alternative loci to bind and open up chromatin unaffected by WT FOXA1. In fact, nearly half of the SY242CS-gained binding sites also displayed a SY242CS-specific increase in chromatin accessibility (Figure 6K).
Figure 6. FOXA1 SY242CS Caused Opening of New Loci Enriched for the Non-canonical Motif.
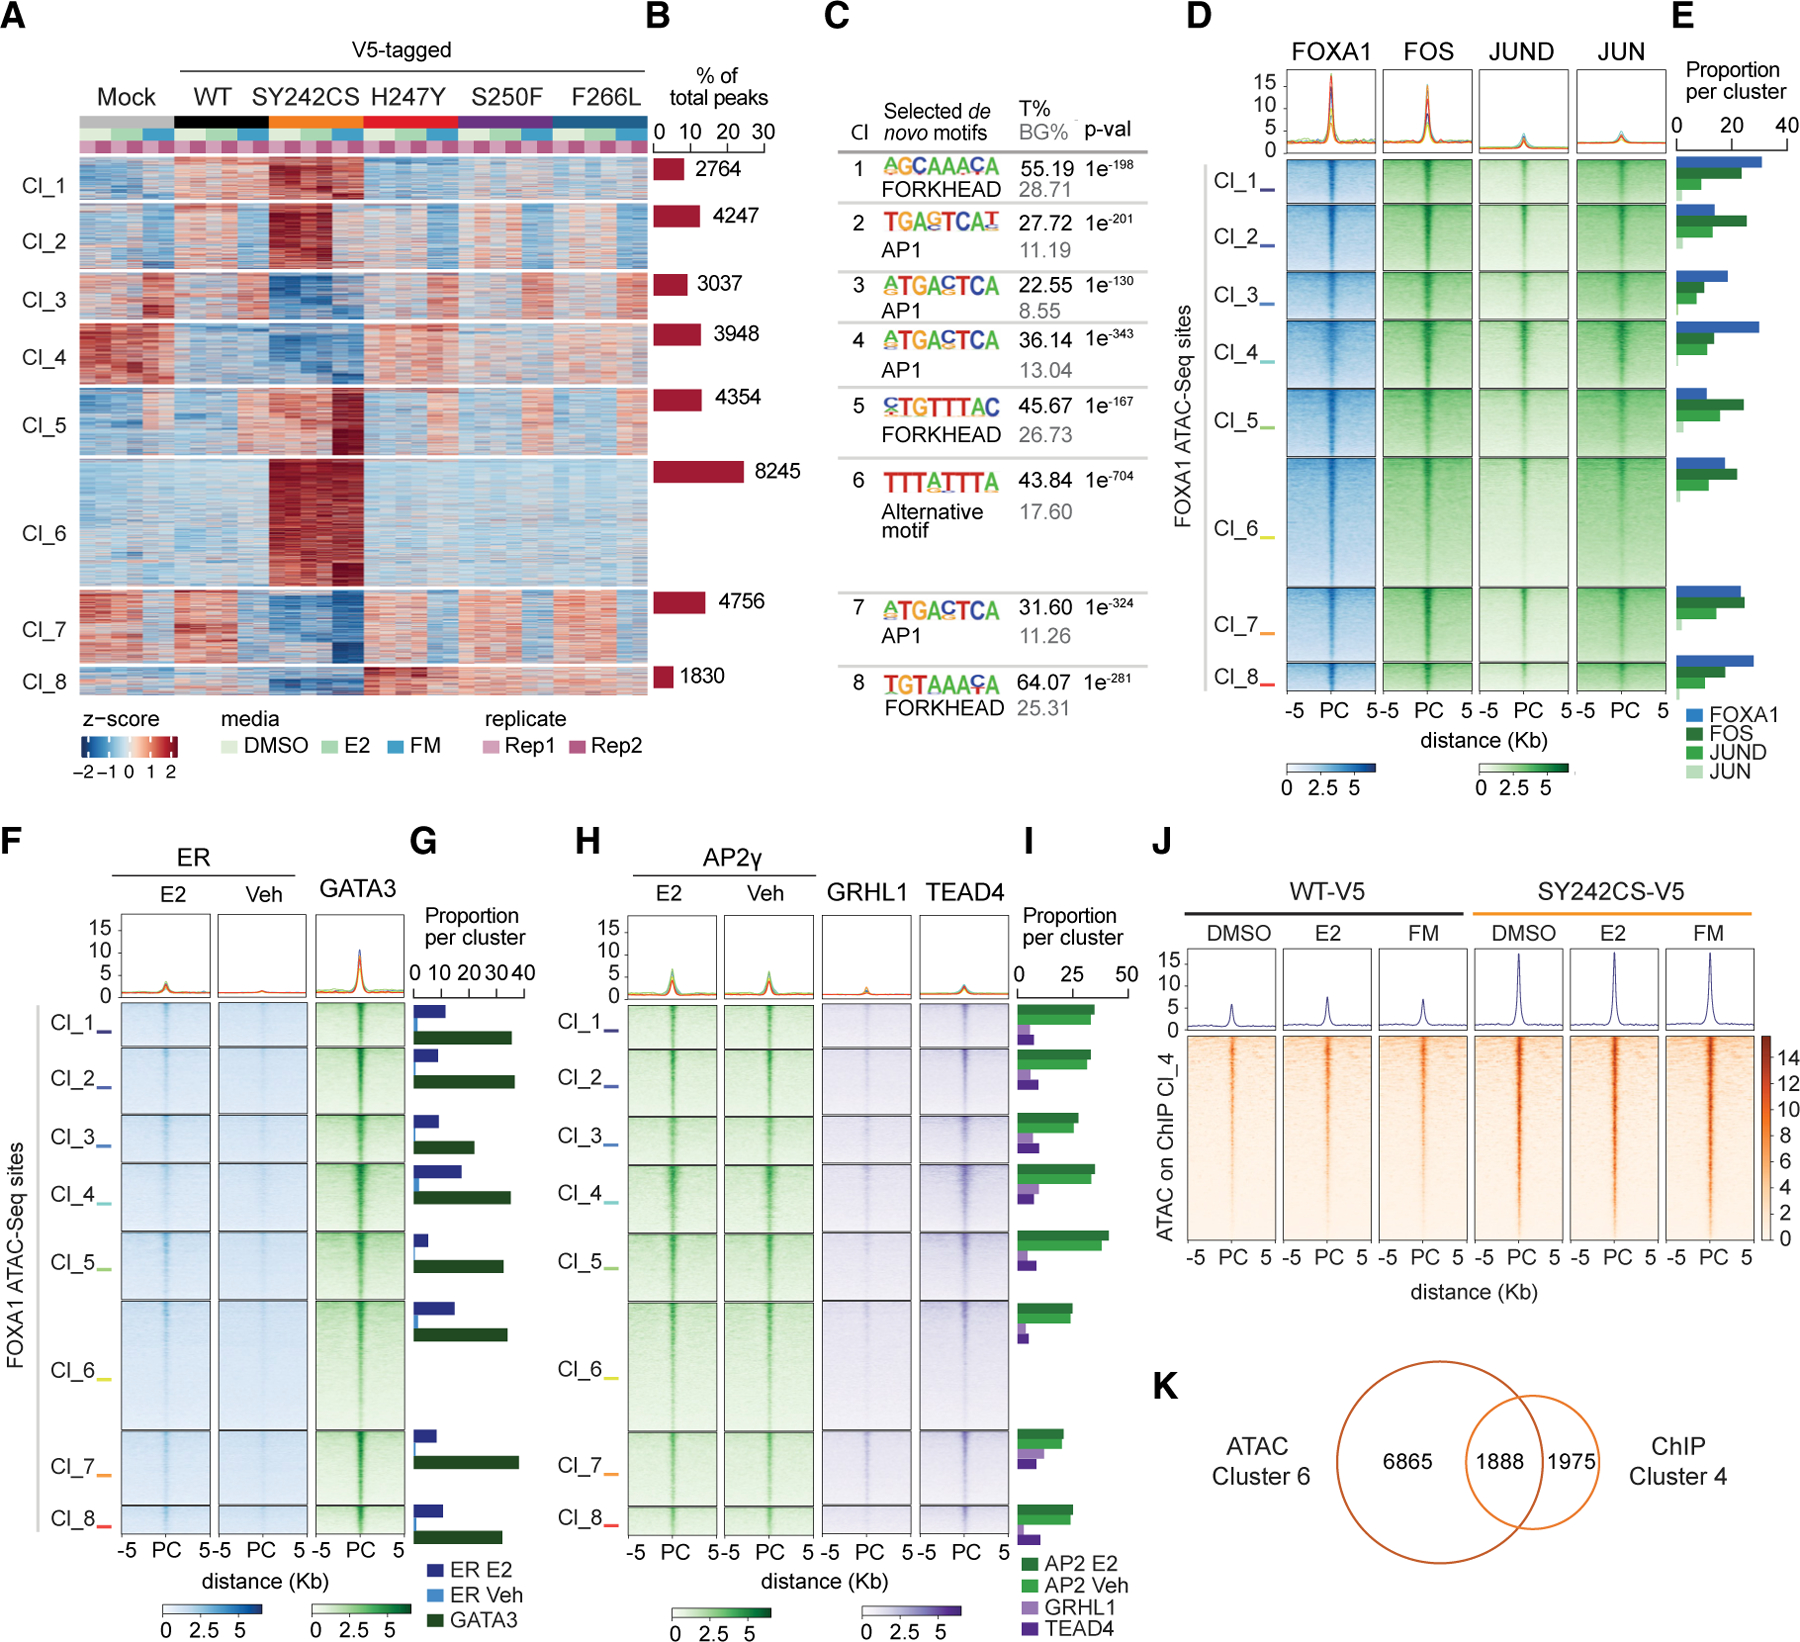
(A and B) Heatmap (A), and barplot (B) of k-means clustering of ATAC-seq peaks from FOXA1 mutant (SY242CS-V5, H247Y-V5, S250F-V5, and F266L-V5) and control (WT-V5, WT, and Mock, empty vector) MCF7 cells, representing eight clusters (A) and percentage and number of peaks per cluster (B) under the conditions indicated. Rep1, replicate 1; Rep 2, replicate 2 (n = 2 biological replicates).
(C) Table listing selected homer de novo motifs per cluster in (A). Fisher’s exact test, p value (p-val) as indicated. T%, percentage of target sites; BG%, background percentage; Cl, cluster.
(D and E) Tornado plot (D) and barplot (E) showing overlap of public ChIP-seq peaks for FOXA1 (ENCODE, ENCSR126YEB) and the subunits conforming AP1 (FOS, ENCSR569XNP; JUN, ENCSR176EXN; JUND, ENCSR000BSU) with gained accessible sites per cluster for FOXA1 ATAC-seq in (A). Quantification of overlapping percentage is represented on the right-hand barplot.
(F and G) Tornado plots (F) and barplot (CG showing ChIP-seq peaks of public ChIP-seq data for transcription factors with enriched occupancy at FOXA1 ATAC-seq clusters in (A) (ER [GEO: GSE59530, Franco et al., 2015] and GATA3 [ENCSR000BST]).
(H and I) Tornado plots (H) and barplot (I) showing ChIP-seq peaks of public ChIP-seq data for transcription factors with enriched occupancy at FOXA1 ATAC-seq clusters in (A) (AP2gamma [GEO: GSE26741], GRHL1, and TEAD [ENCSR000BUO]).
(J) Tornado plot representing chromatin accessibility of peaks in ChIP-seq cluster 4 for FOXA1 SY242CS and WT MCF7 cells under the conditions indicated.
(K) Venn diagram depicting overlap of peaks from ChIP-seq cluster 4 (Figure 3A) with enhanced chromatin accessibility represented in ATAC-seq cluster 6.
DMSO, estrogen depletion; E2, upon estrogen stimulation; FM, in full medium; PC, peak center.
In addition to the overexpression of FOXA1 mutants in our cellular models, we also obtained SY242CS and WT FOXA1 pooled knockin (KI) MCF7 cells (Figures S6E and S6I). ATAC-seq demonstrated SY242CS-specific increased or decreased chromatin accessibility and the enrichment of the SY242CS-specific motif in these peaks (Figures S6F and S6G). Moreover, the ATAC-seq KI peaks showed marked overlap (~60%) with the ATAC-seq cluster 6 (Figure 6A) and ChIP-seq cluster 4 (~63%) (Figure 3B) obtained by overexpressing SY242CS FOXA1 mutant (Figures S6H–S6K).
FOXA1 SY242CS Promoted Expression of an Alternative Transcriptome
We next performed a broad analysis integrating RNA-seq, ChIP-seq, and ATAC-seq to represent the expression of the top 50 SY242CS-upregulated genes, which also displayed the highest increase in chromatin accessibility and chromatin binding profiles. We found that, in most of the top 50 upregulated genes, we observed multiple gained accessible sites as well as enhanced FOXA1 SY242CS binding affinity (Figures 7A and 7B). Examples include genes related to tumorigenesis (CYP26B1 [Brown et al., 2014], VAMP5 [Akamatsu et al., 2012]), proliferation (HMGA1 [Shah et al., 2013]), epithelial identity (CEACAM6 [Ru et al., 2017]), and drug resistance (EFEMP1 [Kwak et al., 2016] and JAK2 [Balko et al., 2016]). Furthermore, genome track analysis of specific genes from this integration showed the increased mRNA levels accompanied by gained ChIP-seq and ATAC-seq peaks (Figures 7C and 7D). A subset of these genes was then validated by real-time quantitative polymerase chain reaction assay in MCF7 and T47D upon expression of SY242CS mutant and in MCF7 KI SY242CS cells confirming that the expression of SY242CS but not WT induced their expression (Figure 7E, S7A, and S7B).
Figure 7. FOXA1 SY242CS Promoted Expression of an Alternative Transcriptome.
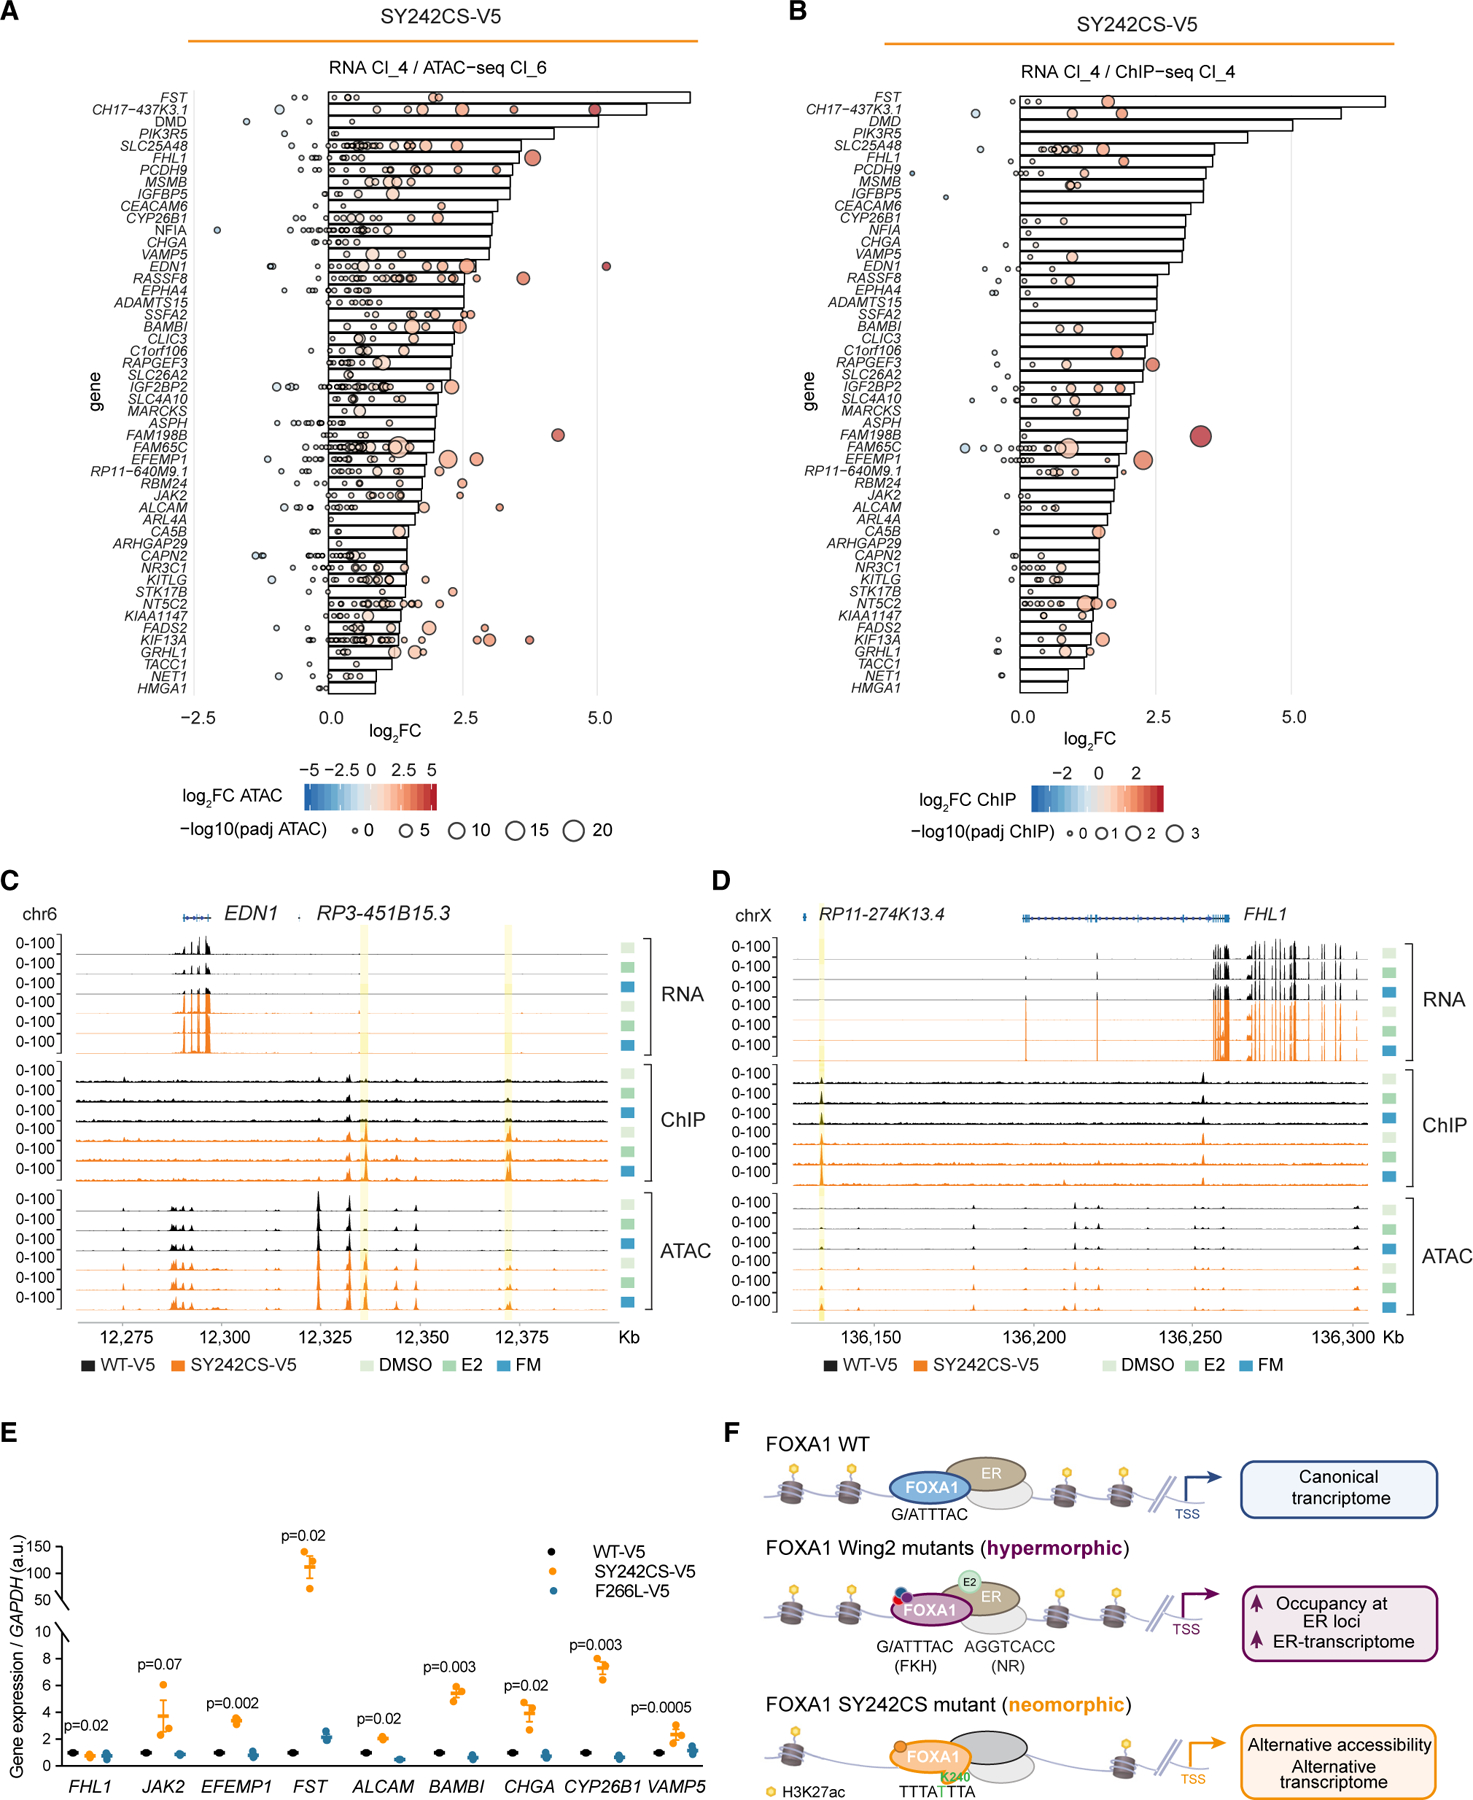
(A) Waterfall plot showing integration of the top 50 genes with highest mRNA expression for FOXA1 SY242CS-V5, as compared with FOXA1 WT-V5, from RNA-seq cluster 4 (represented in bars) with highest changes in chromatin accessibility from ATAC-seq cluster 6 (left panel, represented in bubbles) in FM. Each bubble represents a peak, size correlating with –log10 (adjusted p value) and color denoting log2 fold change.
(B) Waterfall plot showing integration of 50 genes with highest mRNA expression for FOXA1 SY242CS-V5, as compared with FOXA1 WT-V5, from RNA-seq cluster 4 (represented in bars) with highest changes in chromatin binding affinity from ChIP-seq cluster 6 (represented in bubbles) in FM. Each bubble represents a peak, size correlating with –log10 (adjusted p value) and color denoting log2 fold change.
(C and D) Genome tracks of FOXA1 from RNA-seq, ChIP-seq, and ATAC-seq in either SY242CS-V5 or WT FOXA1 MCF7 cells at same EDN1 (C) and FHL1 (D) gene loci at chromosome 6, under medium condition indicated.
(E) mRNA expression of indicated genes in MCF7 cells expressing FOXA1 variants (WT-V5, SY242CS-V5, and F266K-V5) in FM. Error bars, mean ± SEM. p values as indicated, one-tailed Student’s t test (n = 3 biological replicates).
(F) Schematic depicting the different phenotypic groups of FOXA1 mutations uncovered in this study and their transcriptional outcomes, as compared with WT FOXA1.
DMSO, estrogen depletion; E2, upon estrogen stimulation; FM, in full medium.
To further elucidate the transcriptional coregulatory network present at the chromatin accessible sites, we overlapped the publicly available ChIP-seq datasets of the cooperating TFs enriched at the gained accessible chromatin sites in our ATAC-seq (Figure S6A) with our FOXA1 ChIP-seq clusters (Figure 3B). The coregulators enriched in the ATAC-seq also showed co-association at the FOXA1 binding sites (Figures S7C–S7F). In fact, TFs, such as GATA3, AP2γ, or TEAD4, and Wing2 FOXA1 mutants shared higher co-occupancy at clusters where Wing2 mutations demonstrated higher binding affinity (clusters 5 and 6). This suggests that the more organized structural 3D conformation of these mutations, as predicted by our computational modeling (Figure 2A), might enhance the interaction of FOXA1 with these cooperating factors. In contrast, the SY242CS mutant showed significantly less occupancy of GATA3, AP1 complex, AP2γ, GRHL1, and TEAD4 (Figures S7C–S7F). Taken together, these data demonstrate that, while FOXA1 Wing2 mutations create a stronger FOXA1-ER coregulatory network, which enhances ER-dependent transcription, the acquisition of the SY242CS alteration provides FOXA1 the capacity to alter the chromatin accessibility and activate a unique cistrome, which in turn triggers an alternative transcriptome (Figure 7F).
DISCUSSION
Our comprehensive genome-wide study of FOXA1 mutations in ER+ breast cancer uncovered unanticipated and distinct chromatin accessibility, localization on chromatin, and transcriptional profiles for mutant FOXA1, establishing two phenotypic groups: a hypermorphic one driven by Wing2 mutations, and a neomorphic one driven by the breast cancer-specific mutation, namely SY242CS.
While there was evidence that FOXA1 mutations are enriched in ER+ breast cancer (Ciriello et al., 2015; Groner and Brown, 2017; Rheinbay et al., 2017; Robinson et al., 2013), the functional consequences of these alterations were poorly understood. Here, we show that FOXA1 Wing2 mutations display increased chromatin binding affinity at ER sites upon estrogen stimulation, and enhanced ER-mediated transcription. Thus, while the majority of WT FOXA1 sites are not influenced by estrogen treatment, FOXA1 Wing2 mutations display a substantial increase in binding upon estrogen stimulation at defined ER loci, consistent with the nuclear receptor motif being the top enriched motif in those sites (ChIP-seq cluster 6, Figure 3B). However, the gain in cistromic and transcriptomic output is not accompanied by an enhanced chromatin opening capacity, decoupling the chromatin binding of FOXA1 Wing2 mutants from their pioneering function. This is consistent with the reported WT FOXA1 pioneering activity, described to be an event occurring upstream of ER association at shared loci (Hurtado et al., 2011; Serandour et al., 2011). Hence, these data raise the question of whether the pioneering ability of FOXA1 and its chromatin localization closely mirror one another, or they might differ based on FOXA1 perturbations or cellular signals. Based on our structural modeling, we hypothesize that this increased chromatin binding capacity may be associated with the highly organized 3D conformation conferred by FOXA1 Wing2 mutations. In turn, this may drive an augmented ER recruitment or potentially allow more stable/durable interactions with ER and other cooperating factors at the chromatin. Indeed, cluster 6 of ChIP-seq (Figure 3B) displayed an increased association with most of the FOXA1 cooperating partners, such as ER, AP1, AP2γ, and GATA3. However, it is plausible that, in these sites, ER may also facilitate FOXA1 mutant binding upon estrogen stimulation as it has been proposed for a smaller group of binding sites of WT FOXA1 (Paakinaho et al., 2019; Swinstead et al., 2016).
Our clinico-genomic analyses indicated that FOXA1 hotspot and ESR1 mutations, a well-known mechanism of resistance to endocrine therapy, are mutually exclusive. Consistently, the investigation of the transcriptomic and cistromic datasets of ESR1 mutants and FOXA1 Wing2 mutants demonstrated a strong positive association between both transcriptomic signatures and their cistromes. Hence, both these groups of mutations appear to functionally resemble one another at the level of transcription and chromatin occupancy. This is also in agreement with our clinical data showing that FOXA1 mutations are enriched in metastatic breast cancer and associated with lower response to AIs. Thus, we postulate that the enhanced chromatin binding affinity at ER loci might be a mechanism for Wing2 mutants to sustain an active estrogen response which may mediate therapeutic resistance.
By contrast, FOXA1 SY242CS displays an alternative pioneering function over distinct genomic regions that are enriched by the presence of a new FOXA1-binding motif. This alternative binding motif is common at both unique accessible and chromatin bound sites. This leads to distinct open chromatin regions and the induction of an alternative transcriptome regardless of estrogen stimulation. Consistent with this, and in contrast to FOXA1 Wing2 mutants, FOXA1 SY242CS does not display a significant enrichment of estrogen response and shows a negative association with ESR1 mutant gene signatures. FOXA1 SY242CS variant grants a cellular growth advantage in line with the transcriptomic signatures that this mutant induces, which in concert may contribute to AI resistance. Other SY242CS-specific gene signatures include increased lipid synthesis which may be a potential energy source to sustain the increased proliferation rate for this mutant (Beloribi-Djefaflia et al., 2016; Cao, 2019; Vander Heiden et al., 2009).
As the SY242CS mutant maps to a surface-exposed area, we hypothesize that its unique pioneering function may also be due to mutation-selective interactions with other TFs, chromatin regulators, or linker histones that ultimately mediate changes to binding preferences in the chromatin profiles. Indeed, the lack of affinity differences of FKH versus SY242CS motif observed in vitro via EMSAs further highlights the requirement of the chromatin landscape to evoke latent differences in DNA binding in vivo for SY242CS, as it has been previously shown for homeobox or paired box TFs (Hu et al., 2017; Slattery et al., 2011).
The presence of TF’s variant motifs leading to distinct chromatin accessibility sites in cells has been observed for other FOXA1 mutations (i.e., R219) found in prostate cancer and for other TFs, such as the POU TFs (Adams et al., 2019; Jerabek et al., 2017). Given the estrogen-independent function of the FOXA1 SY242CS mutant, it remains to be investigated whether the prostate mutant’s pioneering abilities (Adams et al., 2019) are affected by hormone treatment and whether they modulate therapeutic response to anti-AR therapy (Adams et al., 2019; Parolia et al., 2019).
While we show that FOXA1 mutations in ER+ breast cancer functionally converge to alter the response to AIs in patients, there may be differences in their biology. Moreover, it is notable that FOXA1 mutant cells mediate resistance to estrogen deprivation but not to fulvestrant therapy. These results suggest that reduced ER transcriptional activity, but reminiscent ER protein levels, may be sufficient to support the cooperation between ER and FOXA1 to result in growth advantage and poor outcome to AIs, whereas complete abrogation of FOXA1-ER association driven by ER degradation may result in conserved sensitivity to fulvestrant for these mutants.
In summary, our work highlights the power of examining recurrent cancer-associated mutations to advance our understanding of pioneer TFs in this disease. These results also provide mechanistic insights into how FOXA1 mutations are associated with worse outcome to AIs and position these genetic alterations as potential biomarkers of endocrine therapy response and targets for the treatment of metastatic ER+ breast cancer.
STAR★METHODS
RESOURCE AVAILABILITY
Lead Contact
Further information and requests for resources and reagents should be directed to and will be fulfilled by the Lead Contact, Maurizio Scaltriti (scaltrim@mskcc.org).
Materials Availability
Plasmids generated in this study are available upon request to the Lead Contact. There are restrictions to the availability of FOXA1 WT and SY242CS KI cell lines, as well as FOXA1 WT and mutant organoid lines due to MTA requirement. This study did not generate new unique reagents.
Data and Code Availability
The datasets generated during this study (ChIP-seq/RNA-seq/ATAC-seq fastq files) are available at the Gene Expression Omnibus (GEO) database under GEO: GSE134657 accession code (https://www.ncbi.nlm.nih.gov/geo/query/acc.cgi?acc=GSE134657).
EXPERIMENTAL MODEL AND SUBJECT DETAIL
Cell Lines
MCF7 and T47D cells were bought from ATCC, cultured in DMEM/F-12 (Corning) and RPMI-1640 (Corning) culture media respectively supplemented with 10% FBS and 5% Penicillin/streptomycin, and periodically tested for mycoplasma. 293T cells were obtained from ATCC (CRL-3216) and cultured in DMEM (Corning) culture media supplemented with 10% FBS and 5% Penicillin/streptomycin. All cells were cultured under normal oxygen conditions (5% CO2, 37°C).
We generated FOXA1 WT and SY242CS knock-in mutant MCF7 cells using CRISPR-Cas9 genome editing-induced homologous recombination. Two sgRNAs were designed to target the intron and the 3’UTR region that flanking the coding sequences within exon 2. The homologous recombination (HR) templates were designed to replace the coding sequences of exon 2, containing the synthetic WT exon 2 or SY242CS exon 2 followed by a P2A peptide and puromycin selection cassette. For each nucleofection reaction, 1 x 10⁶ Cas9 stably expressed MCF7 cells were nucleofected with sgRNAs in the form of plasmid DNA (2 µg of each sgRNA) or crRNA (0.4 nmol of each crRNA) and HR template (4 µg), using solution V (Lonza) and program P-20. Cells with HR events were selected with 2 µg/ml puromycin for 2days and expanded. Positive cell pools with on-target insertion were detected using two pairs of primers (Table S3). The mutation was confirmed by Sanger sequencing of genomic DNA amplicons and qPCR of FOXA1 cDNA.
Mice
6-week–old athymic (nu/nu; Envigo Laboratories) female mice were used for in vivo xenograft studies and were cared for in accordance with guidelines approved by the Memorial Sloan Kettering Cancer Center (MSKCC) Institutional Animal Care and Use Committee (IACUC) and Research Animal Resource Center (RARC).
METHOD DETAILS
FOXA1 Mutant Construct and Cell-Line Generation
To obtain FOXA1 mutant constructs FOXA1 cDNA from pCMV6-FOXA1 (Origene, NM_004496) was first subcloned into a pDONR223 vector using Gateway technology from Thermo Fisher. pDONR223_FOXA1_WT was then engineered by site directed mutagenesis to introduce recurrent mutations occurring in patients using the Q5 site-directed mutagenesis kit from New England Biolabs (NEB), according to the manufacturer’s protocol. Primers (shown in Table S1 of the Key Resources Table) were designed through the NEBaseChanger software from NEB. Finally, pDONR223 constructs with either FOXA1 WT or mutant cDNA were subcloned into the pLenti6_Ubc_V5 lentiviral vector. These final constructs were transduced into MCF7 cells by means of lentiviral infection.
KEY RESOURCES TABLE
| REAGENT or RESOURCE | SOURCE | IDENTIFIER | |
|---|---|---|---|
| Antibodies | |||
| FOXA1/HNF3alpha (D7P9B) | Cell Signaling Technology | Cat# 58613s; Lot 1; RRID: AB_2799548 | |
| V5-Tag (D3H8Q) | Cell Signaling Technology | Cat# 13202s; Lot 4; RRID: AB_2687461 | |
| Estrogen Receptor alpha (D8H8) Rabbit mAb | Cell Signaling Technology | Cat# 8644s; Lot 8; RRID: AB_2617128 | |
| Vinculin | Cell Signaling Technology | Cat# 4650s; Lot 4: RRID: AB_10559207 | |
| ECL™ Anti-Rabbit IgG Horseradish Peroxidase linked whole antibody (from donkey) | GE Healthcare | Cat# NA934V; Lot 17010251; RRID: AB_772206 | |
| Anti-FOXA1 Antibody-ChIP Grade | Abcam | ab23738; Lot GR3241520-1; RRID: AB_2104842 | |
| Rb pAB to V5 Tag Antibody | Abcam | ab9116; Lot GR3224488-6; RRID: AB_307024 | |
| Chemicals, Peptides, and Recombinant Proteins | |||
| β -Estradiol | Tocris Bioscience | Cat# 28-241-00 | |
| Dimethyl Sulfoxide | Corning | Cat# 25-950-CQC; Lot 01019003 | |
| Lipofectamine® 3000 Transfection Kit | ThermoFisher/ Invitrogen | Cat# L3000-015; Lot 1882717 | |
| SYBR™ Select Master Mix for CFX | Applied Biosystems | Cat# 4472942; Lot 00815825 | |
| Accutase™ | Stemcell Technologies | Cat# 07920; Lot 9P1925A | |
| Dynabeads™ Protein A for Immunoprecipitation | ThermoFisher/ Invitrogen | Cat# 10002D | |
| Fulvestrant | Selleckchem | Cat# S1191 | |
| Gibco™ Collagenase Type II | Fisher Scientific | Cat# 17-101-015 | |
| TrypLE | ThermoFisher Scientific | Cat# 12605036 | |
| Critical Commercial Assays | |||
| MSK-IMPACT (targeted exome sequencing) | MSKCC (IGO facility) | N/A | |
| Dual Luciferase® Reporter Assay System | Promega | Cat# E1910 | |
| iScript™ cDNA Synthesis Kit | Bio-Rad | Cat# 1708891 | |
| Gateway™ BP Clonase™ II Enzyme mix | ThermoFisher Scientific/ Invitrogen | Cat# 11789020 | |
| Q5® Site-Directed Mutagenesis Kit (Without Competent Cells) | New England Biolabs® Inc. | Cat# E0552S | |
| Qiagen RNeasy® Mini Kit (250) | Qiagen | Cat# 74106; Lot 163029673 | |
| Mouse/Rat Estradiol ELISA kit | CalBiotech | Cat# ES180S-100 | |
| Deposited Data | |||
| ChIP/RNA/ATAC-seq fastq files | This paper | GEO GSE134657; https://www.ncbi.nlm.nih.gov/geo/query/acc.cgi?acc=GSE134657 | |
| Experimental Models: Cell Lines | |||
| h-MCF7 | ATCC | ATCC® HTB-22™ | |
| h-T47D | ATCC | ATCC® HTB-133™ | |
| h-293T | ATCC | ATCC® CRL-3216™ | |
| h-MCF7_FOXA1_Mock | Established in Scaltriti lab | N/A | |
| h-MCF7_FOXA1_WTS | Established in Scaltriti lab | N/A | |
| h-MCF7_FOXA1_WTNS | Established in Scaltriti lab | N/A | |
| h-MCF7_FOXA1_Y175C | Established in Scaltriti lab | N/A | |
| h-MCF7_FOXA1_I176V | Established in Scaltriti lab | N/A | |
| h-MCF7_FOXA1_D266N | Established in Scaltriti lab | N/A | |
| h-MCF7_FOXA1_C227R | Established in Scaltriti lab | N/A | |
| h-MCF7_FOXA1_SY242CS | Established in Scaltriti lab | N/A | |
| h-MCF7_FOXA1_H247Y | Established in Scaltriti lab | N/A | |
| h-MCF7_FOXA1_S250F | Established in Scaltriti lab | N/A | |
| h-MCF7_FOXA1_M253K | Established in Scaltriti lab | N/A | |
| h-MCF7_FOXA1_F266L | Established in Scaltriti lab | N/A | |
| h-T47D_FOXA1_Mock | Established in Scaltriti lab | N/A | |
| h-T47D_FOXA1_WTS | Established in Scaltriti lab | N/A | |
| h-T47D_FOXA1_WTNS | Established in Scaltriti lab | N/A | |
| h-T47D_FOXA1_Y175C | Established in Scaltriti lab | N/A | |
| h-T47D_FOXA1_I176V | Established in Scaltriti lab | N/A | |
| h-T47D_FOXA1_D266N | Established in Scaltriti lab | N/A | |
| h-T47D_FOXA1_C227R | Established in Scaltriti lab | N/A | |
| h-T47D_FOXA1_SY242CS | Established in Scaltriti lab | N/A | |
| h-T47D_FOXA1_H247Y | Established in Scaltriti lab | N/A | |
| h-T47D_FOXA1_S250F | Established in Scaltriti lab | N/A | |
| h-T47D_FOXA1_F266L | Established in Scaltriti lab | N/A | |
| Experimental Models: Organisms/Strains | |||
| Athymic (nu/nu; F) strain 2 mice | Envigo Laboratories | N/A | |
| Oligonucleotides | |||
|
h-FHL1 F: TTGGGAAGTGTAGAAAGACCTGA R: TCCAGAAGTATTCGTTGTGACG |
Invitrogen | N/A | |
|
h-JAK2 F: AAAACCAGGCGCTGAACTC R: CAACGAGGAAAGTAAAATCTCCA |
Invitrogen | N/A | |
|
h-EFEMP1 F: GCATGTCAGTGCCCTCCT R: AGGGATGGTACATTCATCTATGTCT |
Invitrogen | N/A | |
|
h-FST F: TGCCACCTGAGAAAGGCTAC R: TGGATATCTTCACAGGACTTTGC |
Invitrogen | N/A | |
|
h-ALCAM F: CAGTTCCTGCCGTCTGCT R: CTGAATTTACAGTATACCATCCAAGG |
Invitrogen | N/A | |
|
h-BAMBI F: CGCCACTCCAGCTACATCTT R: CACAGTAGCATCGAATTTCACC |
Invitrogen | N/A | |
|
h-CHGA F: GAAGAGGAGGAGGAGGAGGA R: CCCTTCTCTCTGTCCACCAG |
Invitrogen | N/A | |
|
h-CYP26B1 F: ACATCCACCGCAACAAGC R: CTCCTGGTACACGTTGATGG |
Invitrogen | N/A | |
|
h-VAMP5 F: CAGCGTTCAGACCAACTCCT R: CCACGCAGATCCGGTAAC |
Invitrogen | N/A | |
|
h-RASSF8 F: TCACATGCAGACATTGAAAGG R: TCTGCAGAATGCGGAGATTA |
Invitrogen | N/A | |
|
h-GAPDH F: AACAGCGACACCCATCCTG R: CATACCAGGAAATGAGCTTGACAA |
Invitrogen | N/A | |
| Primers for Cloning, see Table S3 | This paper | N/A | |
| Primers for ER target genes, see Table S3 | This paper | N/A | |
| Primers for knock-in FOXA1 WT and SY242CS detection, see Table S3 | This paper | N/A | |
| Primers for EMSA, see Table S3 | This paper | N/A | |
| Software and Algorithms | |||
| Graphpad Prism 8 | Graphpad Software, Inc. | https://www.graphpad.com/scientific-software/prism/ | |
| ImageJ (v1.51h) | National Institute of Health | https://imagej.nih.gov/ij/download.html | |
| Adobe Illustrator 2019 | Adobe | https://www.adobe.com/products/illustrator/free-trial-download.html | |
| NEBaseChanger (v1.2.9) | New England Biolabs® Inc. | https://nebasechanger.neb.com/ | |
| Bowtie2 (v2.3.4.1) | Langmead and Salzberg, 2012 | https://www.nature.com/articles/nmeth.1923) | |
| Cutadapt (v2.8) | Martin2011 | http://journal.embnet.org/index.php/embnetjournal/article/view/200 | |
| MACS2 (v2.2.6) | Zhang et al., 2008 | https://liulab-dfci.github.io/software/ | |
| FetaureCounts (v1.6.0) | Liao et al., 2014 | http://subread.sourceforge.net | |
| STAR (v2.7.0e) | Dobin et al., 2013 | https://code.google.com/archive/p/rna-star/ | |
| HTSeq (v0.9.1) | Anders et al., 2015 | Python Package Index https://pypi.python.org/pypi/HTSeq | |
| DESeq2 (v1.28.1) | Love et al., 2014 | http://www.bioconductor.org/packages/release/bioc/html/DESeq2.html | |
| Bedtools Genome Coverage Bed (v2.18) | Quinian and Hall, 2010 | https://github.com/arq5x/bedtools2 | |
| HOMER (v4.10) | Heinz et al., 2010 | http://homer.ucsd.edu/homer/introduction/install.html | |
| MSigDB (v7.0) | Subramanian et al., 2005; Liberzon et al., 2015 | http://software.broadinstitute.org/gsea/msigdb | |
| Complex Heatmaps (v3.11) | Gu et al., 2016 | http://www.bioconductor.org/packages/devel/bioc/html/ComplexHeatmap.html | |
| GenomicRanges (v1.34) | Lawrence et al., 2013 | https://bioconductor.org/packages/release/bioc/html/GenomicRanges.html | |
| DeepTools2 | Ramírez et al., 2016 | http://deeptools.ie-freiburg.mpg.de/ | |
| Pymol (v2.3) | DeLano 2002 | https://pymol.org/2/ | |
| Amber18 | Case et al., 2018 | https://ambermd.org/index.php | |
| clusterProfiler (v3.16.0) | Yu et al., 2012 | http://bioconductor.org/packages/release/bioc/html/clusterProfiler.html | |
| ImageQuant TL (v8.1) | Cytiva | https://www.cytivalifesciences.com/en/us/shop/protein-analysis/molecular-imaging-for-proteins/imaging-software/imagequant-tl-8-1-p-00110 | |
| subreads (v1.6.0) | Laio et al., 2014 | http://subread.sourceforge.net/ | |
| MarkDuplicates | Picard Tools, Broad Instiutute, GitHub Repository. | https://broadinstitute.github.io/picard/command-line-overview.html#MarkDuplicates | |
| Table S1: Primers for Cloning | |||
| FOXA1_cloningintopDONR F: GGGG ACA ACT TTG TAC AAA AAA GTT GGC ATG TTA GGA ACT GTG AAG ATG |
Invitrogen | N/A | |
| FOXA1_cloningintopDONR_stop R: GGG GAC CAC TTT GTA CAA GAA AGC TGG GTC CTA GGA AGT GTT TAG GAC GGG |
Invitrogen | N/A | |
| FOXA1_cloningintopDONR_nonstop R: GGG GAC CAC TTT GTA CAA GAA AGC TGG GTC GGA AGT GTT TAG GAC GGG TCT |
Invitrogen | N/A | |
| FOXA1_D226N_MUT F: GTCCTTCAATAACTGCTT CGTCAAGG: AGCGAGTGG CGGATGGAG |
Invitrogen | N/A | |
| FOXA1_I176V_MUT F: CTACTCGTACGTCTCGCT CATCACCATGGCC R: GGCGGCTTGGCGTGCGGG |
Invitrogen | N/A | |
| FOXA1_C227R_MUT F: CTTCAATGACCGCTTCGTC AAGGTGG R: GACAGCGAG TGGCGGATG |
Invitrogen | N/A | |
| FOXA1_H247Y_MUT F: CTGGACGCTGTACCC GGACTC R: TAGGAGCC CTTGCCCGGC |
Invitrogen | N/A | |
| FOXA1_S250F_MUT F: CACCCGGACTTCGG CAACATG R: CAGCGTC CAGTAGGAGCC |
Invitrogen | N/A | |
| FOXA1_M253K_MUT F: TCCGGCAACAAGT TCGAGAACGGC R: GT CCGGGTGCAGCGTCCA |
Invitrogen | N/A | |
| FOXA1_SY242CS_MUT F: GGCAAGGGCTGCTCCTG GACGCTG R: CGGCTT GTCCGGGGAGCG |
Invitrogen | N/A | |
| FOXA1_F266L_MUT F: AGAAGCGCTTGAAG TGCGAGAAGC R: GGCGG CGCAAGTAGCAGC |
Invitrogen | N/A | |
| FOXA1_Y175C_MUT F: CCCTACTCGTGCATC TCGCTCATCACC R: CGGCTTGGCGTGCGGGTA |
Invitrogen | N/A | |
| FOXA1_R262H_MUT F: TACTTGCGCCACCA GAAGCGC R: GCAGCC GTTCTCGAACATG |
Invitrogen | N/A | |
| Table S2: Q-PCR Primers for ER Target Genes | |||
|
h-PGR F: GGCATGGTCCTTGGAGGT R: CCACTGGCTGTGGGAGAG |
Invitrogen | N/A | |
| h-TFF1 F: CCCCTGGT GCTTCTATCCTAA R: GATC CCTGCAGAAGTGTCTAAAA | Invitrogen | N/A | |
| h-GREB1 F: GTGGTAGCCG AGTGGACAAT R: ATTTGT TTCCAGCCCTCCTT | Invitrogen | N/A | |
|
h-IGFBP4 F: AACTTCCACCCCAAGCAGT R: GGTCCACACACCAGCACTT |
Invitrogen | N/A | |
In Vitro Growth Assays
Generated MCF7 cell-lines described above were seeded in 12-well plates either in FM or EDM and fixed with 3.7% formaldehyde the following day (D0) and at days 2, 4, 6 and 8. Growth was quantified with crystal violet as previously described (Carracedo et al., 2012). For foci formation assays cells were seeded at very low cellular density and incubated for 3 weeks to allow foci formation. For quantification, foci were stained with crystal violet, pictures were taken and quantified using ImageJ software and validated by manual counting. For anchorage-independent growth, 5000 cells were seeded in a mix of soft agar and media and incubated for 3 weeks to allow colony formation. Pictures representing the well were taken and counted manually using ImageJ. For fulvestrant and tamoxifen growth experiments, MCF7 cells were treated with the doses specified in the figures and 12-well plates were fixed at days 0, 2, 4, and 6.
In Vivo Tumor Xenograft
Athymic (nu/nu; Envigo Laboratories) mice were used for in vivo studies and were cared for in accordance with guidelines approved by the Memorial Sloan Kettering Cancer Center (MSKCC) Institutional Animal Care and Use Committee and Research Animal Resource Center. β-estradiol pellets (0.72 mg, Innovative Research of America) were implanted subcutaneously in the left flank of 6-week-old athymic female mice. Four weeks later, FOXA1_Mock/WT-V5/SY242CS-V5/F266L-V5 MCF7 cells (12 million cells/mouse) were mixed with matrigel (50:50) and implanted s.c. on the other flank (n=10 mice/cell line). Once tumors reached an average volume of 250 mm3, estrogen pellets were removed from 5 mice/group. Tumors were measured twice weekly using calipers, and volume was calculated using the formula: length x width2 x 0.52. Body weight was also assessed twice weekly. At the end of the study the tumors were collected for histology and biochemistry analysis.
Estrogen Measurement in Mice Serum
Retro-orbital blood extraction was performed in the mice at the time-points specified, collected in microtainers (BD) containing gel with clot activator, incubated for 30 minutes, centrifuged at 12,000rpm at 4°C and serum obtained above gel was snap frozen for processing within the next month. Estrogen level in sera samples was quantified using CALBIOTECH Mouse/Rat Estradiol ELISA kit (Haisenleder et al., 2011).
Luciferase Reporter Assays
293T cells were transiently transfected using Lipofectamine 3000 (Thermo Fisher) with the pGL-6xFHS-Luc (Adams et al., 2019), pGL-6xTTTATTTA-Luc or pGL-6xTTTATGTA-Luc (firefly luciferase), along with a pRL-CMV-Renilla (Renilla luciferase) internal control and the vector of interest (either pLenti6 empty backbone, pLenti6-FOXA1_WT-V5 or pLenti6-FOXA1_Mutant-V5 respectively) for each experiment. pGL-6xTTTATTTA-Luc and pGL-6xTTTATGTA-Luc were obtained by gene synthesis and cloning into pGL4.28_luc2CP_minP_Hygro (Promega) via 5’XhoI and 3’ EcoRV of the following sequences respectively: 5’ tcgaTAAATAAAagct TAAATAAAacgtTAAATAAAgtcaTAAATAAAgcctTAAATAAAtatTAAATAAA 3’ and 5’ tcgaTACATAAAagctTACATAAAacgtTAC ATAAAgtcaTACATAAAgcctTACATAAAtatTA
CATAAA 3’. To optimize the assay the reporters were dose-response tested using different levels of pLenti6-FOXA1_WT-V5 or pLenti6-FOXA1_SY242CS-V5. Luminescence was measured 24h post-transfection and response ratios were normalized to activity of pLenti6-FOXA1_WT-V5 (set to 1), subtracting negative control activity of empty vector pLenti6-V5 (without exogenous FOXA1).
EMSA Assays
Proteins were prepared using the E.coli expression system as described (Wang et al., 2018) by the protein production platform at Nanyang Technological University of Singapore (http://proteins.sbs.ntu.edu.sg) using standard protocols for DNA binding proteins through a combination of affinity and size exclusion chromatography. Electrophoretic mobility shift assays were done using native 12% PAGE prepared with a Tris/glycine (TG) buffer (25 mM Tris pH 8.3; 192 mm glycine) and prepared mini-gels (BioRad,1610156). Double-stranded DNA probes with 5ʹ Cy5 or Cy3 dyes at one of the strands were prepared using an annealing buffer (20 mM Tris/HCl, 50 mM MgCl2, 50 mM KCl, pH 8.0) and heating to 95°C for 5 min and subsequent cooling at 1°C·min‒1 to 16°C in a PCR block. Protein samples and fluorescently labeled DNA were incubated for ~ 2 h in EMSA buffer (10 mM Tris/HCl pH8.0, 0.1 mg·mL‒1 BSA, 50 µM ZnCl2, KCl 100 mM, 10% glycerol, 0.10% Igepal CA630, 2 mM βME). Gels were first pre-run using 1 × TG buffer (Tris 0.25 mM, glycine 192 mM, pH 8.0) at 200 V for 30 min, and then 10 µL samples were loaded and gels were run for 30 min at 200 V in 4°C. For comparative ‘single tube picking’ EMSAs, equimolar amounts (50 nM each) of differently labeled DNA were prepared and incubated with protein samples. Images were captured using a GE Typhoon 9410 Molecular Imager and quantified using ImageQuant, Pittsburgh, PA, USA.
Western Blot
Western blot was performed as previously described (Carracedo et al., 2012). Briefly, total protein lysates were run in Nupage 4–12% Bis-Tris gradient precast gels (Invitrogen) in MOPS buffer. Proteins were subjected to long migration time (~2.5h) in ice to allow correct separation and visualization of exogenous FOXA1-V5 and endogenous FOXA1. Primary antibodies used in this study are: rabbit anti-FOXA1 (CST, #58613), rabbit anti-V5 tag (D3H8Q, CST, # 13202) and rabbit anti-VINCULIN (CST, # 4650).
RNA, cDNA and RT-qPCR
The Qiagen RNeasy kit and the iScript cDNA synthesis kit from Bio-Rad were used for RNA isolation and cDNA synthesis, respectively. cDNA was amplified by real time quantitative PCR in a ViiA 7 Real-Time PCR system, using SYBR Select Master Mix from Applied Biosystems. Each sample was run in technical triplicates and mRNA expression primers are shown in the Key Resources Table. For ER target gene expression experiments upon fulvestrant treatment, cells were treated for 72h. snap-frozen and stored at −80°C until extraction.
RNA-seq, ChIP-seq and ATAC-seq
Cells were seeded in regular culture conditions to allow correct attachment and ensure ~75% confluency at harvesting day. 24 hours after seeding, cells were washed twice with PBS and media was refreshed to either FM or estrogen depleted media (EDM) supplemented with 10% charcoal stripped fetal bovine serum (CS) and 5% Penicillin/streptomycin and incubated for 72h. The day of collection media was refreshed 1h before estrogen induction (100nM, 1h for ChIP-seq and ATAC-seq, 6h for RNA-seq). For RNA-seq, cells were washed twice with PBS and snap-frozen for future processing. ChIP-seq was performed as previously described (Chen et al., 2015). Briefly, cells were crosslinked in adherent conditions with 1% formaldehyde for 15 minutes and quenched with glycine to a final concentration of 125nM. Fixed cells were lysed in SDS buffer to extract nuclei and sheared by Covaris sonication in ChIP buffer. Sheared chromatin was incubated with rabbit anti-FOXA1 (Abcam, ab23738) or anti-V5 tag (Abcam, ab9116) antibodies and protein A/G-Dynabeads. After decrosslink o/n at 65C, DNA fragments were eluted using AMPure beads and generated libraries were high-throughput sequenced using HiSeq 2500 (Illumina). RNA-seq samples were sequenced by HiSeq 4000 (Illumina).
For ATAC-seq cells were detached using ACCUTASE (STEMCELL Technologies), counted and 100K (MCF7) or 50K (T47D) cells were subjected to ATAC-seq protocol directly as previously described (Buenrostro et al., 2013) with the exception that 0.2% NP40 was used for cell lysis for MCF7, and T47D (Corces et al., 2017).
Mammary Organoid Generation and Culture
Mammary organoids were cultured as described previously (Duarte et al., 2018). Briefly, murine mammary glands were isolated and subsequently digested using collagenase type II (Gibco) and TRYPLE (Gibco). Organoids were grown in ADMEM/F12 supplemented with HEPES, penicillin/streptomycin, GlutaMAX, B27, N-Acteylcysteine, Noggin, R-spondin1, A83–01 and EGF (Drost et al., 2016). Organoids were passaged once a week using TrypLE or pasteur pipette titruration. Lentiviral transduction was done as described previously (Koo and Huch, 2016).
Survival Analysis
We estimated the impact of somatic mutations affecting FOXA1 and progression-free survival (PFS) of ER-positive metastatic breast cancer treated with selective estrogen receptor down regulators (SERD), aromatase inhibitors (AI), or SERD in combination AI using publicly available data (Razavi et al., 2018). Whenever different lines of therapy of the same class, the first treatment line of that class was considered. For cases with multiple samples with different lines of therapy of the same class, we included the sample with the shortest time between start of therapy and sample collection for sequencing.
To estimate the association between genetic alterations in FOXA and PFS, we conducted a survival analysis using the Cox proportional hazards model (R package survival) adjusted for line of therapy, fraction of genome altered and tumor mutation burden. Only missense mutations and oncogenic mutations affecting FOXA1 were included in the analysis (Table S1).
Mutual Exclusivity and Co-Occurrence Analysis
To identify combination of gene pairs exhibiting mutual exclusivity pattern, CoMEt software was used (Leiserson et al., 2015). Co-occurrence was assessed using two statistical tests: the odds ratio test to measure the strength of the co-occurrence of a pair of genes, and Fisher’s exact test to derive statistical significance. For both mutual exclusivity and co-occurrence analyses, only FOXA1 hotspot mutations was considered. Co-occurrence of PIK3CA and CDH1 with FOXA1 mutations were calculated based on the high frequency of these mutations in ER+ breast cancers.
Computational Analysis
ChIP-seq and ATAC-seq
For both ChIP-seq and ATAC-seq, fastq files were trimmed with cutadapt (Martin, 2011), and the remaining reads were aligned to hg38 using bowtie2 2.3.4.1 (Langmead and Salzberg, 2012).
Peaks were called using MACS2 (Zhang et al., 2008) over respective mutant ChIP-input. Peaks within 500bp from all samples and peaks with a p-value of <=0.001 and outside the ENCODE blacklist region (Amemiya et al., 2019) were kept. The remaining peaks were merged and combined into a peak atlas. Peak intensity for each sample were counted using featureCounts from subreads 1.6.0 (Liao et al., 2014). Duplicate reads were removed using PICARD’s MarkDuplicates.
ChIP-seq and ATAC-seq peaks were associated to the gene with the closest TSS, except for intronic peaks which were associated with that gene.
RNA-seq
The fastq files were trimmed with cutadapt (Martin, 2011), and aligned to hg38 using STAR 2.6.0 (Dobin et al., 2013) HTSeq 0.9.1. (Anders et al., 2015) was using to count reads to genes towards gencode v28 (Frankish et al., 2019).
RNA-seq Integration with ESR1 Mutant Signatures
Accession PRJNA417235, https://www.ncbi.nlm.nih.gov/bioproject/PRJNA417235 was downloaded and aligned to genome reference hg38 using STAR (v2.7.0e). Differential expression analysis was performed using DESeq2 (v1.28.1). To ensure consistency we generated similar heatmaps and PCAs as found in the original Jeselsohn et al., 2018 publication.
GSEA analysis was performed using clusterProfiler (v3.16.0). GSEA ESR1 signatures were generated using the top 100 differentially expressed genes in each ESR1 comparison and used for enrichment analysis in FOXA1 RNA-seq samples.
Sample Normalization and Dynamic Peaks/Genes
For all assays, DESeq2 (Love et al., 2014) was used to normalize samples, and performing pair-wise differential expression/ dynamic peak calling between specified contrasts. Genes/peaks were termed differentially active if they had an absolute fold change >= 1.5 and a FDR <=0.1.
The DESeq2 size factors were used to create normalized bigwig files with bedtools genomeCoverageBed (Quinlan and Hall, 2010).
Motif and GSEA on Dynamic Peaks/Genes
The dynamic peaks per comparison were split into up- (FC >=1.5) and down-regulated (FC <= 0.67), and HOMER (Heinz et al., 2010) findMotifGenome was run with size = given and length = 8. For RNA, findMotifs.pl was used to get GO-enrichments of differential genes. GSEA was further used for each RNA-seq contrast against MSigDB (Subramanian et al., 2005) & (Liberzon et al., 2015). For SY242CS, GSEA was also evaluated toward C2 datasets only, using clusterProfiler (Yu et al., 2012) (v3.16.0). Gene signatures were considered significant if the false discovery adjusted p-value was < 0.05.
Heatmap Clustering and Motif/GO Enrichment
For each assay, all dynamic peaks/genes of interest were included and clustered using the k-means function in R after normalizing to z-score and setting a floor and ceiling to 2 and −2. The number of kmeans for each assay was decided manually to account for interesting biology. Heatmaps were plotted using ComplexHeatmaps (Gu et al., 2016). For ChIP/ATAC-seq, the motifs in each cluster were investigated using HOMER with the same parameters as above. For RNA-seq, the genes in each cluster was also analyzed using HOMER.
Integration of Public Data Sets
Data from ENCODE and GEO was downloaded (FOXA1, ENCSR126YEB; ER, GSE59530 (Franco et al., 2015); FOS, ENCSR569XNP; JUN, ENCSR176EXN; JUND, ENCSR000BSU; GATA3, ENCSR000BST; TEAD, ENCSR000BUO; AP2-gamma, GSE2671 (Tan et al., 2011); GRHL1, GSE124228 (Xu et al., 2020)) and processed as above.
Dynamic peaks between ER_E2 and ER_vehicle were computed using DEseq2, and the enrichment of FOXA1 was plotted using DeepTools.
Overlap between peaks were calculated using intersect from GenomicRanges (Lawrence et al., 2013).
Integration between RNA-seq and ChIP/ATAC-seq
Peaks associated with a specific gene were compared to the RNA-expression of that gene.
Waterfall plots were created by overlapping all SY242CS specific k-means clusters from ChIP/ATAC/RNA-seq and plotting the top 50 differential genes, based on FDR, with their respective associated peaks.
Plotting
DESeq2 normalized bigWigs were used for all plotting. Merging of replicates, tornado plots and genome tracks, were all created using DeepTools (Ramírez et al., 2016).
Molecular Dynamics Simulations of the 3-D Structure of FKHD FOXA1 – DNA Complex
The 3-D structure of the forkhead domain of the FOXA1 – DNA complex was generated by comparative homology modelling (Sali and Blundell, 1993) using the crystal structure (PDB 1VTN; resolution 2.5 Å) of the forkhead domain of the FOXA3 – DNA complex as template. FOXA1 and FOXA3 share high homology (95% identity) in their forkhead domains. In the crystal structure of the FoxA3 – DNA complex, the bound DNA is only 13 nucleotides long and hence we built a model of the complex of the forkhead domain of FOXA1 with a longer fragment of DNA (20 nucleotides) to minimize edge effects, for which we used a recently published model (Wang et al., 2018) of the FOXA1 – DNA complex. The 3D structures of mutant FOXA1 – DNA models were generated by using pymol (DeLano, 2002). All the modelled structures were then subjected to atomistic Molecular Dynamics (MD) simulations with the pmemd.cuda module of the program Amber18 (D.A. Case, 2018), using the Amber ff14SB force field (Maier et al., 2015) for proteins and the amber force field FF99BSC0 (Perez et al., 2007) for DNA. All the simulations were carried out at 300 K using standard protocols (Kannan et al., 2015). Three independent MD simulations (assigning different initial velocities) were carried out on each equilibrated FOXA1 - DNA complex for 100 ns each, with conformations saved every 10 ps. Simulation trajectories were visualized using VMD (Humphrey et al., 1996) and figures were generated using Pymol (DeLano, 2002). The binding free energies (enthalpic components) are calculated using the MMPBSA (Molecular Mechanics Poisson–Boltzmann Surface Area) methodology following the protocol set out in earlier work (Edgar et al., 2002; Kannan et al., 2015).
QUANTIFICATION AND STATISTICAL ANALYSIS
No statistics were applied to determine sample size. Only in vivo experiment was randomized. After tumor engraftment the 10 mice per condition were randomized into two groups (under estrogen supplementation or under estrogen pellet removal) with similar mean volume (250mm3). The investigators were not blinded to allocation during experiments and outcome assessment. Values of ‘n’ represent the number of biologically independent experiments performed or the number of individual mice or patient specimens. For each independent in vitro experiment, a minimum number of three experiments were performed to ensure adequate statistical power, with the exception of ChIP-seq and ATAC-seq, for which two biological replicates (for all but V5-tag ChIP-seq, done once for validation) were performed. Parametric Student’s t-test and Welch’s t-test were used to analyze two-component comparisons with equal or significantly different variances respectively. In the in vitro experiments, normal distribution was confirmed or assumed (for n < 7). Non-parametric Mann-Whitney’s U-test was used to analyze in vivo experiments. Two-tailed statistical analysis was applied for experimental design without predicted result, and one-tailed analysis for validation or hypothesis-driven experiments. All information regarding statistical test performed, ‘n’ values and p-values per experiment can be found in the figure legends, figures and results. The confidence level used for all the statistical analyses was 0.95 (α = 0.05), unless otherwise specified. Statistical analyses for the rest of the computational analyses are provided in the respective method section.
Supplementary Material
Highlights.
FOXA1 mutations are enriched in metastatic tumors
FOXA1 mutations are associated with worse outcome to aromatase inhibitors
Wing2 mutations promote an enhanced estrogen response upon estrogen
SY242CS induces alternative chromatin states by binding to a non-canonical motif
ACKNOWLEDGMENTS
We thank all the Scaltriti lab members for their advice and support. We would like to recognize Elisa de Stanchina and Xiaoping Chen from the Antitumor Assessment core; the Center for Epigenetics Research at MSKCC, the Epigenomics core of Weill Cornell Medical College and the Integrated Genomics Operation (IGO) core for help with experiments; and Dr. Wing Wei Chen of the protein production platform of the Nanyang Technical University of Singapore for providing FOXA1 proteins (https://proteins.sbs.ntu.edu.sg). We also acknowledge Elizabeth J. Adams for plasmid sharing. This work has been supported by NIH grants P30 CA008748 and RO1CA190642–01A1, the Breast Cancer Research Foundation, the Geoffrey Beene Cancer Research Center, Stand Up To Cancer, the V Foundation, and the National Science Foundation (to M.Scaltriti). E.T. and M.Scaltriti are supported by a kind gift from Mrs. Barbara Smith; E.T. by Breast Cancer Alliance; R.J. by the NSFC (no. 31771454), the RGC/GRF (no. 17128918), and the HMRF (no.06174006) of Hong Kong/China; A.A.-A. by a post-doctoral grant from the Education Department of the Basque Country Government in Spain, E.L. by grant no. NCI K00CA212478; and W.R.K. by a grant from the Prostate Cancer Foundation. E.C. is a recipient of an MSK Society Scholar Prize.
Footnotes
SUPPLEMENTAL INFORMATION
Supplemental Information can be found online at https://doi.org/10.1016/j.ccell.2020.08.003.
DECLARATION OF INTERESTS
J.L.V.M. is an employee at Inzen Therapeutics. M.Sallaku has received funds from Puma Biotechnology, AstraZeneca, Daiichi-Sankio, Immunomedics, Targimmune, and Menarini Ricerche, is a cofounder of Medendi.org and is on the advisory board of Menarini Ricerche. J.B. is an employee and shareholder of AstraZeneca, Board of Directors member of Foghorn Therapeutics, and is a past board member of Varian Medical Systems, Bristol-Myers Squibb, Grail, Aura Biosciences, and Infinity Pharmaceuticals. He has performed consulting and/or advisory work for Grail, PMV Pharma, ApoGen, Juno, Lilly, Seragon, Novartis, and Northern Biologics. He has stock or other ownership interests in PMV Pharma, Grail, Juno, Varian, Foghorn, Aura, Infinity, ApoGen, as well as Tango and Venthera, of which he is a co-founder. He has previously received Honoraria or Travel Expenses from Roche, Novartis, and Lilly. C.L.S. serves on the board of directors of Novartis, is a co-founder of ORIC Pharm and co-inventor of enzalutamide and apalutamide. He is a science advisor to Agios, Beigene, Blueprint, Column Group, Foghorn, Housey Pharma, Nextech, KSQ, Petra, and PMV. He was a co-founder of Seragon (purchased by Genentech/Roche, 2014). J.S.R.-F. is a consultant of Goldman Sachs and REPARE Therapeutics, a member of the Scientific Advisory Board of VolitionRx and Paige.AI, and an ad hoc member of the Scientific Advisory Board of Ventana Medical Systems, Roche, Genentech, Novartis, and Invi-CRO. C.S.V. has been the recipient of research grants from Ipsen Pharmaceuticals, MSD International, and Proctor & Gamble. E.T. has received Honoraria from AstraZeneca for invited lectures. P.R. has received consultation fees from Novartis, AstraZeneca, Foundation Medicine and institutional research funds from Grail, Novartis and Illumina. W.R.K. is a patent holder with KNAW, Organoid Technology shared with Hans Clevers.S.Kannan and C.S.V. are founder directors of SiNOPSEE Therapeutics and Aplomex. The other authors declare no competing interests.
REFERENCES
- Adams EJ, Karthaus WR, Hoover E, Liu D, Gruet A, Zhang Z, Cho H, DiLoreto R, Chhangawala S, Liu Y, et al. (2019). FOXA1 mutations alter pioneering activity, differentiation and prostate cancer phenotypes. Nature 571, 408–412. [DOI] [PMC free article] [PubMed] [Google Scholar]
- Akamatsu S, Takata R, Haiman CA, Takahashi A, Inoue T, Kubo M, Furihata M, Kamatani N, Inazawa J, Chen GK, et al. (2012). Common variants at 11q12, 10q26 and 3p11.2 are associated with prostate cancer susceptibility in Japanese. Nat. Genet 44, 426–429, s421. [DOI] [PubMed] [Google Scholar]
- Amemiya HM, Kundaje A, and Boyle AP (2019). The ENCODE blacklist: identification of problematic regions of the genome. Sci. Rep 9, 9354. [DOI] [PMC free article] [PubMed] [Google Scholar]
- Anders S, Pyl PT, and Huber W (2015). HTSeq‒a Python framework to work with high-throughput sequencing data. Bioinformatics (Oxford, England) 31, 166–169. [DOI] [PMC free article] [PubMed] [Google Scholar]
- Balko JM, Schwarz LJ, Luo N, Estrada MV, Giltnane JM, Davila-Gonzalez D, Wang K, Sanchez V, Dean PT, Combs SE, et al. (2016). Triple-negative breast cancers with amplification of JAK2 at the 9p24 locus demonstrate JAK2-specific dependence. Sci. Transl. Med 8, 334ra353. [DOI] [PMC free article] [PubMed] [Google Scholar]
- Banerji S, Cibulskis K, Rangel-Escareno C, Brown KK, Carter SL, Frederick AM, Lawrence MS, Sivachenko AY, Sougnez C, Zou L, et al. (2012). Sequence analysis of mutations and translocations across breast cancer subtypes. Nature 486, 405–409. [DOI] [PMC free article] [PubMed] [Google Scholar]
- Beloribi-Djefaflia S, Vasseur S, and Guillaumond F (2016). Lipid metabolic reprogramming in cancer cells. Oncogenesis 5, e189. [DOI] [PMC free article] [PubMed] [Google Scholar]
- Bertucci F, Ng CKY, Patsouris A, Droin N, Piscuoglio S, Carbuccia N, Soria JC, Dien AT, Adnani Y, Kamal M, et al. (2019). Genomic characterization of metastatic breast cancers. Nature 569, 560–564. [DOI] [PubMed] [Google Scholar]
- Brown GT, Cash BG, Blihoghe D, Johansson P, Alnabulsi A, and Murray GI (2014). The expression and prognostic significance of retinoic acid metabolising enzymes in colorectal cancer. PLoS One 9, e90776. [DOI] [PMC free article] [PubMed] [Google Scholar]
- Buenrostro JD, Giresi PG, Zaba LC, Chang HY, and Greenleaf WJ (2013). Transposition of native chromatin for fast and sensitive epigenomic profiling of open chromatin, DNA-binding proteins and nucleosome position. Nat. Methods 10, 1213–1218. [DOI] [PMC free article] [PubMed] [Google Scholar]
- Cao Y (2019). Adipocyte and lipid metabolism in cancer drug resistance. J. Clin. Invest 129, 3006–3017. [DOI] [PMC free article] [PubMed] [Google Scholar]
- Carracedo A, Weiss D, Leliaert AK, Bhasin M, de Boer VC, Laurent G, Adams AC, Sundvall M, Song SJ, Ito K, et al. (2012). A metabolic prosurvival role for PML in breast cancer. J. Clin. Invest 122, 3088–3100. [DOI] [PMC free article] [PubMed] [Google Scholar]
- Carroll JS, Liu XS, Brodsky AS, Li W, Meyer CA, Szary AJ, Eeckhoute J, Shao W, Hestermann EV, Geistlinger TR, et al. (2005). Chromosome-wide mapping of estrogen receptor binding reveals long-range regulation requiring the forkhead protein FoxA1. Cell 122, 33–43. [DOI] [PubMed] [Google Scholar]
- Case DA, I Y B -S, Brozell SR, Cerutti DS, Cheatham TE III, Cruzeiro VWD, Darden TA, Duke RE, Ghoreishi D, Gilson MK, et al. (2018). AMBER 2018 (University of California; ). [Google Scholar]
- Chen CW, Koche RP, Sinha AU, Deshpande AJ, Zhu N, Eng R, Doench JG, Xu H, Chu SH, Qi J, et al. (2015). DOT1L inhibits SIRT1-mediated epigenetic silencing to maintain leukemic gene expression in MLL-rearranged leukemia. Nat. Med 21, 335–343. [DOI] [PMC free article] [PubMed] [Google Scholar]
- Cheng DT, Mitchell TN, Zehir A, Shah RH, Benayed R, Syed A, Chandramohan R, Liu ZY, Won HH, Scott SN, et al. (2015). Memorial Sloan Kettering-integrated mutation profiling of actionable cancer targets (MSK-IMPACT): a hybridization capture-based next-generation sequencing clinical assay for solid tumor molecular oncology. J. Mol. Diagn 17, 251–264. [DOI] [PMC free article] [PubMed] [Google Scholar]
- Ciriello G, Gatza ML, Beck AH, Wilkerson MD, Rhie SK, Pastore A, Zhang H, McLellan M, Yau C, Kandoth C, et al. (2015). Comprehensive molecular portraits of invasive lobular breast cancer. Cell 163, 506–519. [DOI] [PMC free article] [PubMed] [Google Scholar]
- Cirillo LA, McPherson CE, Bossard P, Stevens K, Cherian S, Shim EY, Clark KL, Burley SK, and Zaret KS (1998). Binding of the winged-he-lix transcription factor HNF3 to a linker histone site on the nucleosome. EMBO J 17, 244–254. [DOI] [PMC free article] [PubMed] [Google Scholar]
- Corces MR, Trevino AE, Hamilton EG, Greenside PG, Sinnott-Armstrong NA, Vesuna S, Satpathy AT, Rubin AJ, Montine KS, Wu B, et al. (2017). An improved ATAC-seq protocol reduces background and enables interrogation of frozen tissues. Nat. Methods 14, 959–962. [DOI] [PMC free article] [PubMed] [Google Scholar]
- Davis CA, Hitz BC, Sloan CA, Chan ET, Davidson JM, Gabdank I, Hilton JA, Jain K, Baymuradov UK, Narayanan AK, et al. (2018). The Encyclopedia of DNA elements (ENCODE): data portal update. Nucleic Acids Res 46, D794–d801. [DOI] [PMC free article] [PubMed] [Google Scholar]
- DeLano WL (2002). The PyMOL Molecular Graphics System (De Lano Scientific; ). [Google Scholar]
- Dobin A, Davis CA, Schlesinger F, Drenkow J, Zaleski C, Jha S, Batut P, Chaisson M, and Gingeras TR (2013). STAR: ultrafast universal RNA-seq aligner. Bioinformatics (Oxford, England) 29, 15–21. [DOI] [PMC free article] [PubMed] [Google Scholar]
- Drost J, Karthaus WR, Gao D, Driehuis E, Sawyers CL, Chen Y, and Clevers H (2016). Organoid culture systems for prostate epithelial and cancer tissue. Nat. Protoc 11, 347–358. [DOI] [PMC free article] [PubMed] [Google Scholar]
- Duarte AA, Gogola E, Sachs N, Barazas M, Annunziato S, J, R.d.R., Velds A, Blatter S, Houthuijzen JM, van de Ven M, et al. (2018). BRCA-deficient mouse mammary tumor organoids to study cancer-drug resistance. Nat. Methods 15, 134–140. [DOI] [PubMed] [Google Scholar]
- Edgar R, Domrachev M, and Lash AE (2002). Gene Expression Omnibus: NCBI gene expression and hybridization array data repository. Nucleic Acids Res 30, 207–210. [DOI] [PMC free article] [PubMed] [Google Scholar]
- Ellis MJ, Ding L, Shen D, Luo J, Suman VJ, Wallis JW, Van Tine BA, Hoog J, Goiffon RJ, Goldstein TC, et al. (2012). Whole-genome analysis informs breast cancer response to aromatase inhibition. Nature 486, 353–360. [DOI] [PMC free article] [PubMed] [Google Scholar]
- Franco HL, Nagari A, and Kraus WL (2015). TNFalpha signaling exposes latent estrogen receptor binding sites to alter the breast cancer cell transcriptome. Mol. Cell 58, 21–34. [DOI] [PMC free article] [PubMed] [Google Scholar]
- Frankish A, Diekhans M, Ferreira AM, Johnson R, Jungreis I, Loveland J, Mudge JM, Sisu C, Wright J, Armstrong J, et al. (2019). GENCODE reference annotation for the human and mouse genomes. Nucleic Acids Res. 47, D766–d773. [DOI] [PMC free article] [PubMed] [Google Scholar]
- Fu X, Jeselsohn R, Pereira R, Hollingsworth EF, Creighton CJ, Li F, Shea M, Nardone A, De Angelis C, Heiser LM, et al. (2016). FOXA1 overexpression mediates endocrine resistance by altering the ER transcriptome and IL-8 expression in ER-positive breast cancer. Proc. Natl. Acad. Sci. U S A 113, E6600–e6609. [DOI] [PMC free article] [PubMed] [Google Scholar]
- Groner AC, and Brown M (2017). Role of steroid receptor and coregulator mutations in hormone-dependent cancers. J. Clin. Invest 127, 1126–1135. [DOI] [PMC free article] [PubMed] [Google Scholar]
- Gu Z, Eils R, and Schlesner M (2016). Complex heatmaps reveal patterns and correlations in multidimensional genomic data. Bioinformatics (Oxford, England) 32, 2847–2849. [DOI] [PubMed] [Google Scholar]
- Haisenleder DJ, Schoenfelder AH, Marcinko ES, Geddis LM, and Marshall JC (2011). Estimation of estradiol in mouse serum samples: evaluation of commercial estradiol immunoassays. Endocrinology 152, 4443–4447. [DOI] [PMC free article] [PubMed] [Google Scholar]
- Heinz S, Benner C, Spann N, Bertolino E, Lin YC, Laslo P, Cheng JX, Murre C, Singh H, and Glass CK (2010). Simple combinations of lineage-determining transcription factors prime cis-regulatory elements required for macrophage and B cell identities. Mol. Cell 38, 576–589. [DOI] [PMC free article] [PubMed] [Google Scholar]
- Hoadley KA, Yau C, Hinoue T, Wolf DM, Lazar AJ, Drill E, Shen R, Taylor AM, Cherniack AD, Thorsson V, et al. (2018). Cell-of-origin patterns dominate the molecular classification of 10,000 tumors from 33 types of cancer. Cell 173, 291–304.e6. [DOI] [PMC free article] [PubMed] [Google Scholar]
- Hu C, Malik V, Chang YK, Veerapandian V, Srivastava Y, Huang YH, Hou L, Cojocaru V, Stormo GD, and Jauch R (2017). Coop-seq analysis demonstrates that Sox2 evokes latent specificities in the DNA recognition by Pax6. J. Mol. Biol 429, 3626–3634. [DOI] [PubMed] [Google Scholar]
- Humphrey W, Dalke A, and Schulten K (1996). VMD: visual molecular dynamics. J. Mol. Graphics 14, 27–38. [DOI] [PubMed] [Google Scholar]
- Hurtado A, Holmes KA, Ross-Innes CS, Schmidt D, and Carroll JS (2011). FOXA1 is a key determinant of estrogen receptor function and endocrine response. Nat. Genet 43, 27–33. [DOI] [PMC free article] [PubMed] [Google Scholar]
- Iwafuchi-Doi M, Donahue G, Kakumanu A, Watts JA, Mahony S, Pugh BF, Lee D, Kaestner KH, and Zaret KS (2016). The pioneer transcription factor FoxA maintains an accessible nucleosome configuration at enhancers for tissue-specific gene activation. Mol. Cell 62, 79–91. [DOI] [PMC free article] [PubMed] [Google Scholar]
- Jerabek S, Ng CK, Wu G, Arauzo-Bravo MJ, Kim KP, Esch D, Malik V, Chen Y, Velychko S, MacCarthy CM, et al. (2017). Changing POU dimerization preferences converts Oct6 into a pluripotency inducer. EMBO Rep 18, 319–333. [DOI] [PMC free article] [PubMed] [Google Scholar]
- Jeselsohn R, Bergholz JS, Pun M, Cornwell M, Liu W, Nardone A, Xiao T, Li W, Qiu X, Buchwalter G, et al. (2018). Allele-specific chromatin recruitment and therapeutic vulnerabilities of ESR1 activating mutations. Cancer Cell 33, 173–186.e5. [DOI] [PMC free article] [PubMed] [Google Scholar]
- Jolma A, Yin Y, Nitta KR, Dave K, Popov A, Taipale M, Enge M, Kivioja T, Morgunova E, and Taipale J (2015). DNA-dependent formation of transcription factor pairs alters their binding specificity. Nature 527, 384–388. [DOI] [PubMed] [Google Scholar]
- Kannan S, Poulsen A, Yang HY, Ho M, Ang SH, Eldwin TS, Jeyaraj DA, Chennamaneni LR, Liu B, Hill J, et al. (2015). Probing the binding mechanism of Mnk inhibitors by docking and molecular dynamics simulations. Biochemistry 54, 32–46. [DOI] [PubMed] [Google Scholar]
- Koo BK, and Huch M (2016). Organoids: a new in vitro model system for biomedical science and disease modelling and promising source for cell-based transplantation. Dev. Biol. 420, 197–198. [DOI] [PubMed] [Google Scholar]
- Kwak JH, Lee NH, Lee HY, Hong IS, and Nam JS (2016). HIF2alpha/EFEMP1 cascade mediates hypoxic effects on breast cancer stem cell hierarchy. Oncotarget 7, 43518–43533. [DOI] [PMC free article] [PubMed] [Google Scholar]
- Langmead B, and Salzberg SL (2012). Fast gapped-read alignment with Bowtie 2. Nat. Methods 9, 357–359. [DOI] [PMC free article] [PubMed] [Google Scholar]
- Lawrence M, Huber W, Pages H, Aboyoun P, Carlson M, Gentleman R, Morgan MT, and Carey VJ (2013). Software for computing and annotating genomic ranges. PLoS Comput. Biol 9, e1003118. [DOI] [PMC free article] [PubMed] [Google Scholar]
- Lee JY, Schizas M, Geyer FC, Selenica P, Piscuoglio S, Sakr RA, Ng CKY, Carniello JVS, Towers R, Giri DD, et al. (2019). Lobular carcinomas in situ display intralesion genetic heterogeneity and clonal evolution in the progression to invasive lobular carcinoma. Clin. Cancer Res 25, 674–686. [DOI] [PMC free article] [PubMed] [Google Scholar]
- Leiserson MDM, Wu H-T, Vandin F, and Raphael BJ (2015). CoMEt: a statistical approach to identify combinations of mutually exclusive alterations in cancer. Genome Biol 16, 160. [DOI] [PMC free article] [PubMed] [Google Scholar]
- Liao Y, Smyth GK, and Shi W (2014). featureCounts: an efficient general purpose program for assigning sequence reads to genomic features. Bioinformatics (Oxford, England) 30, 923–930. [DOI] [PubMed] [Google Scholar]
- Liberzon A, Birger C, Thorvaldsdottir H, Ghandi M, Mesirov JP, and Tamayo P (2015). The Molecular Signatures Database (MSigDB) hallmark gene set collection. Cell Syst 1, 417–425. [DOI] [PMC free article] [PubMed] [Google Scholar]
- Love MI, Huber W, and Anders S (2014). Moderated estimation of fold change and dispersion for RNA-seq data with DESeq2. Genome Biol 15, 550. [DOI] [PMC free article] [PubMed] [Google Scholar]
- Lupien M, Eeckhoute J, Meyer CA, Wang Q, Zhang Y, Li W, Carroll JS, Liu XS, and Brown M (2008). FoxA1 translates epigenetic signatures into enhancer-driven lineage-specific transcription. Cell 132, 958–970. [DOI] [PMC free article] [PubMed] [Google Scholar]
- Maier JA, Martinez C, Kasavajhala K, Wickstrom L, Hauser KE, and Simmerling C (2015). ff14SB: improving the accuracy of protein side chain and backbone parameters from ff99SB. J. Chem. Theor. Comput 11, 3696–3713. [DOI] [PMC free article] [PubMed] [Google Scholar]
- Martin M (2011). Cutadapt removes adapter sequences from high-throughput sequencing reads 17, 3. [Google Scholar]
- Merenbakh-Lamin K, Ben-Baruch N, Yeheskel A, Dvir A, Soussan-Gutman L, Jeselsohn R, Yelensky R, Brown M, Miller VA, Sarid D, et al. (2013). D538G mutation in estrogen receptor-alpha: a novel mechanism for acquired endocrine resistance in breast cancer. Cancer Res 73, 6856–6864. [DOI] [PubMed] [Google Scholar]
- Myatt SS, and Lam EW (2007). The emerging roles of forkhead box (Fox) proteins in cancer. Nat. Rev. Cancer 7, 847–859. [DOI] [PubMed] [Google Scholar]
- Nik-Zainal S, Davies H, Staaf J, Ramakrishna M, Glodzik D, Zou X, Martincorena I, Alexandrov LB, Martin S, Wedge DC, et al. (2016). Landscape of somatic mutations in 560 breast cancer whole-genome sequences. Nature 534, 47–54. [DOI] [PMC free article] [PubMed] [Google Scholar]
- Paakinaho V, Swinstead EE, Presman DM, Grøntved L, and Hager GL (2019). Meta-analysis of chromatin programming by steroid receptors. Cell Rep 28, 3523–3534.e2. [DOI] [PMC free article] [PubMed] [Google Scholar]
- Parolia A, Cieslik M, Chu SC, Xiao L, Ouchi T, Zhang Y, Wang X, Vats P, Cao X, Pitchiaya S, et al. (2019). Distinct structural classes of activating FOXA1 alterations in advanced prostate cancer. Nature 571, 413–418. [DOI] [PMC free article] [PubMed] [Google Scholar]
- Pereira B, Chin SF, Rueda OM, Vollan HK, Provenzano E, Bardwell HA, Pugh M, Jones L, Russell R, Sammut SJ, et al. (2016). The somatic mutation profiles of 2,433 breast cancers refines their genomic and transcriptomic landscapes. Nat. Commun 7, 11479. [DOI] [PMC free article] [PubMed] [Google Scholar]
- Perez A, Marchan I, Svozil D, Sponer J, Cheatham TE 3rd, Laughton CA, and Orozco M (2007). Refinement of the AMBER force field for nucleic acids: improving the description of alpha/gamma conformers. Biophys. J 92, 3817–3829. [DOI] [PMC free article] [PubMed] [Google Scholar]
- Perou CM, Sorlie T, Eisen MB, van de Rijn M, Jeffrey SS, Rees CA, Pollack JR, Ross DT, Johnsen H, Akslen LA, et al. (2000). Molecular portraits of human breast tumours. Nature 406, 747–752. [DOI] [PubMed] [Google Scholar]
- Quinlan AR, and Hall IM (2010). BEDTools: a flexible suite of utilities for comparing genomic features. Bioinformatics 26, 841–842. [DOI] [PMC free article] [PubMed] [Google Scholar]
- Ramírez F, Ryan DP, Grüning B, Bhardwaj V, Kilpert F, Richter AS, Heyne S, Dündar F, and Manke T (2016). deepTools2: a next generation web server for deep-sequencing data analysis. Nucleic Acids Res 44, W160–W165. [DOI] [PMC free article] [PubMed] [Google Scholar]
- Razavi P, Chang MT, Xu G, Bandlamudi C, Ross DS, Vasan N, Cai Y, Bielski CM, Donoghue MTA, Jonsson P, et al. (2018). The genomic landscape of endocrine-resistant advanced breast cancers. Cancer Cell 34, 427–438.e6. [DOI] [PMC free article] [PubMed] [Google Scholar]
- Rheinbay E, Parasuraman P, Grimsby J, Tiao G, Engreitz JM, Kim J, Lawrence MS, Taylor-Weiner A, Rodriguez-Cuevas S, Rosenberg M, et al. (2017). Recurrent and functional regulatory mutations in breast cancer. Nature 547, 55–60. [DOI] [PMC free article] [PubMed] [Google Scholar]
- Robinson JL, Holmes KA, and Carroll JS (2013). FOXA1 mutations in hormone-dependent cancers. Front. Oncol 3, 20. [DOI] [PMC free article] [PubMed] [Google Scholar]
- Ross-Innes CS, Stark R, Teschendorff AE, Holmes KA, Ali HR, Dunning MJ, Brown GD, Gojis O, Ellis IO, Green AR, et al. (2012). Differential oestrogen receptor binding is associated with clinical outcome in breast cancer. Nature 481, 389–393. [DOI] [PMC free article] [PubMed] [Google Scholar]
- Ru G-Q, Han Y, Wang W, Chen Y, Wang H-J, Xu W-J, Ma J, Ye M, Chen X, He X-L, et al. (2017). CEACAM6 is a prognostic biomarker and potential therapeutic target for gastric carcinoma. Oncotarget 8, 83673–83683. [DOI] [PMC free article] [PubMed] [Google Scholar]
- Sali A, and Blundell TL (1993). Comparative protein modelling by satisfaction of spatial restraints. J. Mol. Biol 234, 779–815. [DOI] [PubMed] [Google Scholar]
- Serandour AA, Avner S, Percevault F, Demay F, Bizot M, Lucchetti-Miganeh C, Barloy-Hubler F, Brown M, Lupien M, Metivier R, et al. (2011). Epigenetic switch involved in activation of pioneer factor FOXA1-dependent enhancers. Genome Res 21, 555–565. [DOI] [PMC free article] [PubMed] [Google Scholar]
- Shah SP, Roth A, Goya R, Oloumi A, Ha G, Zhao Y, Turashvili G, Ding J, Tse K, Haffari G, et al. (2012). The clonal and mutational evolution spectrum of primary triple-negative breast cancers. Nature 486, 395–399. [DOI] [PMC free article] [PubMed] [Google Scholar]
- Shah SN, Cope L, Poh W, Belton A, Roy S, Talbot CC Jr., Sukumar S, Huso DL, and Resar LMS (2013). HMGA1: a master regulator of tumor progression in triple-negative breast cancer cells. PLoS One 8, e63419. [DOI] [PMC free article] [PubMed] [Google Scholar]
- Slattery M, Riley T, Liu P, Abe N, Gomez-Alcala P, Dror I, Zhou T, Rohs R, Honig B, Bussemaker HJ, et al. (2011). Cofactor binding evokes latent differences in DNA binding specificity between Hox proteins. Cell 147, 1270–1282. [DOI] [PMC free article] [PubMed] [Google Scholar]
- Sorlie T, Perou CM, Tibshirani R, Aas T, Geisler S, Johnsen H, Hastie T, Eisen MB, van de Rijn M, Jeffrey SS, et al. (2001). Gene expression patterns of breast carcinomas distinguish tumor subclasses with clinical implications. Proc. Natl. Acad. Sci. U S A 98, 10869–10874. [DOI] [PMC free article] [PubMed] [Google Scholar]
- Stephens PJ, Tarpey PS, Davies H, Van Loo P, Greenman C, Wedge DC, Nik-Zainal S, Martin S, Varela I, Bignell GR, et al. (2012). The landscape of cancer genes and mutational processes in breast cancer. Nature 486, 400–404. [DOI] [PMC free article] [PubMed] [Google Scholar]
- Subramanian A, Tamayo P, Mootha VK, Mukherjee S, Ebert BL, Gillette MA, Paulovich A, Pomeroy SL, Golub TR, Lander ES, et al. (2005). Gene set enrichment analysis: a knowledge-based approach for interpreting genome-wide expression profiles. Proc. Natl. Acad. Sci. U S A 102, 15545–15550. [DOI] [PMC free article] [PubMed] [Google Scholar]
- Swinstead EE, Miranda TB, Paakinaho V, Baek S, Goldstein I, Hawkins M, Karpova TS, Ball D, Mazza D, Lavis LD, et al. (2016). Steroid receptors reprogram FoxA1 occupancy through dynamic chromatin transitions. Cell 165, 593–605. [DOI] [PMC free article] [PubMed] [Google Scholar]
- Tan SK, Lin ZH, Chang CW, Varang V, Chng KR, Pan YF, Yong EL, Sung WK, and Cheung E (2011). AP-2gamma regulates oestrogen receptor-mediated long-range chromatin interaction and gene transcription. EMBO J 30, 2569–2581. [DOI] [PMC free article] [PubMed] [Google Scholar]
- TCGA. (2012). Comprehensive molecular portraits of human breast tumours. Nature 490, 61–70. [DOI] [PMC free article] [PubMed] [Google Scholar]
- Toska E, Osmanbeyoglu HU, Castel P, Chan C, Hendrickson RC, Elkabets M, Dickler MN, Scaltriti M, Leslie CS, Armstrong SA, et al. (2017). PI3K pathway regulates ER-dependent transcription in breast cancer through the epigenetic regulator KMT2D. Science 355, 1324–1330. [DOI] [PMC free article] [PubMed] [Google Scholar]
- Toska E, Castel P, Chhangawala S, Arruabarrena-Aristorena A, Chan C, Hristidis VC, Cocco E, Sallaku M, Xu G, Park J, et al. (2019). PI3K inhibition activates SGK1 via a feedback loop to promote chromatin-based regulation of ER-dependent gene expression. Cell Rep. 27, 294–306.e5. [DOI] [PMC free article] [PubMed] [Google Scholar]
- Toy W, Shen Y, Won H, Green B, Sakr RA, Will M, Li Z, Gala K, Fanning S, King TA, et al. (2013). ESR1 ligand-binding domain mutations in hormone-resistant breast cancer. Nat. Genet 45, 1439–1445. [DOI] [PMC free article] [PubMed] [Google Scholar]
- Vander Heiden MG, Cantley LC, and Thompson CB (2009). Understanding the Warburg effect: the metabolic requirements of cell proliferation. Science 324, 1029–1033. [DOI] [PMC free article] [PubMed] [Google Scholar]
- Wang X, Srivastava Y, Jankowski A, Malik V, Wei Y, Del Rosario RC, Cojocaru V, Prabhakar S, and Jauch R (2018). DNA-mediated dimerization on a compact sequence signature controls enhancer engagement and regulation by FOXA1. Nucleic Acids Res 46, 5470–5486. [DOI] [PMC free article] [PubMed] [Google Scholar]
- Wong H, Lau S, Cheung P, Wong TT, Parker A, Yau T, and Epstein RJ (2014). Lobular breast cancers lack the inverse relationship between ER/PR status and cell growth rate characteristic of ductal cancers in two independent patient cohorts: implications for tumor biology and adjuvant therapy. BMC Cancer 14, 826. [DOI] [PMC free article] [PubMed] [Google Scholar]
- Xu G, Chhangawala S, Cocco E, Razavi P, Cai Y, Otto JE, Ferrando L, Selenica P, Ladewig E, Chan C, et al. (2020). ARID1A determines luminal identity and therapeutic response in estrogen-receptor-positive breast cancer. Nat. Genet 52, 198–207. [DOI] [PMC free article] [PubMed] [Google Scholar]
- Yu G, Wang LG, Han Y, and He QY (2012). clusterProfiler: an R package for comparing biological themes among gene clusters. Omics 16, 284–287. [DOI] [PMC free article] [PubMed] [Google Scholar]
- Zaret KS, and Carroll JS (2011). Pioneer transcription factors: establishing competence for gene expression. Genes Dev 25, 2227–2241. [DOI] [PMC free article] [PubMed] [Google Scholar]
- Zehir A, Benayed R, Shah RH, Syed A, Middha S, Kim HR, Srinivasan P, Gao J, Chakravarty D, Devlin SM, et al. (2017). Mutational landscape of metastatic cancer revealed from prospective clinical sequencing of 10,000 patients. Nat. Med 23, 703–713. [DOI] [PMC free article] [PubMed] [Google Scholar]
- Zhang Y, Liu T, Meyer CA, Eeckhoute J, Johnson DS, Bernstein BE, Nusbaum C, Myers RM, Brown M, Li W, et al. (2008). Model-based analysis of ChIP-seq (MACS). Genome Biol 9, R137. [DOI] [PMC free article] [PubMed] [Google Scholar]
Associated Data
This section collects any data citations, data availability statements, or supplementary materials included in this article.
Supplementary Materials
Data Availability Statement
The datasets generated during this study (ChIP-seq/RNA-seq/ATAC-seq fastq files) are available at the Gene Expression Omnibus (GEO) database under GEO: GSE134657 accession code (https://www.ncbi.nlm.nih.gov/geo/query/acc.cgi?acc=GSE134657).