



Abstract
The calcium signaling protein calmodulin regulates numerous intracellular processes. We introduce a sensitive microchip assay to separate and detect calmodulin binding proteins. The assay utilizes an optimized microchip electrophoresis protein separation platform with laser-induced fluorescence detection. Fluorescence-labeled calmodulin modified with a photoreactive diazirine crosslinker allowed selective detection of calmodulin binding proteins. We demonstrate successful in-vitro crosslinking of calmodulin with two calmodulin binding proteins, calcineurin and nitric oxide synthase. We compare the efficacy of commonly applied electrophoretic separation modes: microchip capillary zone electrophoresis, microchip micellar electrokinetic chromatography/gel electrophoresis, and nanoparticle colloidal arrays. Out of the methods tested, polydymethylsiloxane/glass chips with microchip zone electrophoresis gave the poorest separation, whereas sieving methods in which electro-osmotic flow was suppressed gave the best separation of photoproducts of calmodulin conjugated with calmodulin binding proteins.
Keywords: calmodulin binding protein, colloidal array, micellar electrokinetic chromatography, microchip electrophoresis, photo-crosslinking
1. Introduction
Calmodulin (CaM) acts as a Ca2+-triggered molecular switch to regulate more than 100 enzymes involved in many biological pathways [1,2]. Sensitive and rapid analytical methods to detect the interaction of CaM with calmodulin-binding proteins (CBPs) are needed to profile the CBP “interactome.” Existing methods for analysis of CBPs, including the CaM-binding overlay technique [3,4], affinity chromatography [5], and SDS-PAGE [6], are limited by long analysis time and low sensitivity. Additionally, such methods require considerable amounts of sample—a significant limiting factor in analyzing biological samples. Recently, Persechini and coworkers described a survey of CaM-CBP interactions in live cells by photoactivated crosslinking with affinity-tagged CaM [7]. The method provides detailed information about interactions with CBPs but requires enrichment followed by mass spectrometry.
The goals of the present work are development of methods for rapid detection of CBPs. Microchip electrophoresis (MCE) affords the promise of rapid protein separation and sensitive detection coupled with laser induced fluorescence, allowing use of small sample volumes [8,9]. However, applications of MCE to proteins are potentially confounded by poor differentiation of SDS-protein complexes based on electrophoretic mobility alone [10]. Applications of microchip electrophoresis to proteins therefore often incorporate separation modes such as electrokinetic chromatography or sieving [11-14].
The aim of this work was to demonstrate separation and detection of CaM-CBP conjugates by microchip methods for two model CBPs—endothelial nitric oxide synthase (eNOS) and calcineurin (CN)—through detection of fluorescence-labeled CaM. eNOS has a molecular mass of ~135 kDa [15,16]. CN is a heterodimer consisting of a large subunit (calcineurin A, ~60 kDa), which binds to CaM, and a smaller subunit (calcineurin B, ~19 kDa) [17]. Our goal was first to demonstrate photo-reactive crosslinking of CaM with each of the model CBPs and then to evaluate various separation modes: microchip zone electrophoresis (MCZE), MEKC, and silica-nanoparticle colloidal arrays, under a variety of separation conditions.
2. Materials and Methods
2.1. Materials and reagents
All reagents and samples were prepared with doubly-deionized water from an ultrapure water system (Barnstead, Dubuque, IA). Alexa Fluor 647 C2-maleimide was obtained from Molecular Probes (Eugene, OR). T34C-CaM was expressed and labeled with Alexa Fluor 647 (AF647) as described previously [18]. Samples of eNOS were gifts from David Arnett (Northwestern College, Orange City, Iowa) and Dr. Anthony Persechini (School of Biological Sciences, University of Missouri, Kansas City). CN was kindly provided by Dr. Paul M. Stemmer (Wayne State University). Hetero bi-functional amine-reactive diazirine crosslinkers [succinimidyl 6-(4,4 ´-azipentanamido) hexanoate (NHS-LC-SDA)], and Zeba spin desalting columns were purchased from Pierce (Rockford, IL). Tris-HCl ready gels, tris-glycine buffer, and Precision Plus Protein dual-color standards were purchased from Bio-Rad (Hercules, CA). Polyvinylidene fluoride membranes (0.45 μm) were purchased from Millipore (Bedford, MA). Enhanced chemiluminiscence (ECL) detection kits were purchased from GE Healthcare (UK). CaM polyclonal and monoclonal antibodies were purchased from Santa Cruz Biotechnology (Paso Robles, CA). Polydimethylsiloxane (PDMS) and a curing agent were purchased from Ellsworth Adhesives (Minneapolis, MN). Poly(methyl methacrylate) (PMMA) was obtained from McMaster-Carr (Elmhurst, IL, USA). Fused silica capillaries (ID: 50μm and OD: 364 μm) were purchased from Polymicro Technology (Molex, Lisle, IL). SU8 10 negative photo resist and silicon wafers were purchased from Micro-Chem Corp. (Newton, MA) and Silicon Inc. (Boise, ID), respectively. Silicon nanobeads were purchased from Bangs Laboratories, Inc. (Fishers, IN). Platinum (Pt) wire was purchased from Ted Pella, Inc. (Redding, CA). n-Dodecyl-β-D-maltopyranoside (DDM), 4-(2-hydroxyethyl)-1-piperazineethanesulfonic acid (HEPES), DMSO, sodium hydroxide, and tris-HCl were purchased from Fisher Scientific (Fair Lawn, NJ). Tris-borate EDTA (TBE) 10X buffer (CE grade), boric acid, hydroxypropyl methylcellulose (HPMC), and SDS were acquired from Sigma-Aldrich (St. Louis. MO).
2.2. Methods
CE separations were performed in a Beckman P/ACETM MDQ instrument (Beckman, Fullerton, CA) as described elsewhere [19]. The electrophoresis platform used in this study is described elsewhere [19]. Microchips were mounted on X-Y translational stage (Newport, Irvine, CA). Fluorescence was excited by a 633-nm He-Ne laser. A Nikon TE 300 microscope was used for LIF detection. High voltage was supplied by four independently controlled high-voltage power supply (HVPS) channels (UltraVolt, Ronkonkoma, NY) and applied between the reservoirs of the microfluidic device. The reservoirs were connected to the HVPS channels with Pt leads. A LabVIEW program was used to control the HVPS and data collection. PDMS-based microchips were fabricated by standard soft lithography at the Adams Micro-Fabrication facility (University of Kansas) as described previously [19]. Glass microchips were fabricated as described previously [20,21]. Microfluidic channels in the device were checked under a microscope, and any particles were removed using 0.1 M NaOH or isopropyl alcohol with pressure. PDMS/glass and glass chips were conditioned with 0.1 M NaOH and deionized water for 5 min each followed by run buffer for another 5 min. Before the separation, the device was checked again for any clogging. Silicon nanoparticle microfluidic chips were based on a chip with a simple “T” wafer (10 mm separation channel and 4 mm side arms). Self-assembly of beads in the separation channel was carried out as previously described [22]. After self-assembly of the colloidal array, silica-nanoparticle microfluidic devices were equilibrated with the run buffer for 20 min prior to use.
The Cys residue in T34C-CaM was labeled with AF647 through maleimide chemistry as described previously [18]. The labeled protein is hereafter referred to as CaM-AF647. Samples were heat-denatured in the presence of 3.5 mM SDS at 95°C for 5 min prior to the separation. CN and eNOS were crosslinked separately with NHS-diazirine according to the manufacturer’s protocol [23]. Briefly, NHS-LC-diazirine (10 mM) was prepared in DMSO. Solutions of ~50 μM CaM-AF647 and ~25 μM CBP were prepared in 10 mM HEPES buffer, pH 7.4, containing 2 mM Ca2+. The crosslinker and CaM-AF647 (50:1) were incubated for 30 min at room temperature. The reaction was quenched by adding tris·HCl, pH 8, to obtain a final concentration of 100 mM tris, followed by incubation at room temperature for 5 min. Unreacted linker and salts were removed by Zeba desalting spin columns. CaM-AF647 labeled with crosslinker was mixed with a solution of CBP (CN or eNOS) at a 1:1 ratio (~10 μM each). The mixture was incubated for 30 min at room temperature, followed by argon saturation for 30 min. The mixture was photo-irradiated at 350 nm for 15 min in a Rayonet photo-chemical reactor (Bradford, CT) with four bulbs (15 W each) [24].
3. Results
3.1. Photochemical crosslinking of calmodulin-diazirine with calcineurin and endothelial nitric oxide synthase
NHS-LC-SDA with a 12.5-Å spacer was selected to capture CBPs by crosslinking. Such linkers have been successful in inter-protein cross linking [25]. Figure 1 shows the SDS-PAGE and western-blot analysis of CBPs photochemically crosslinked with CaM-AF647. The monoclonal CaM antibody recognized a band corresponding to the CaM-CN photoproduct, which has an expected molecular mass of ~77 kDa (Lane 5), and the CaM-eNOS photoproduct, which has an expected molecular mass of ~153 kDa (Lane 6), respectively. However, binding of CaM monoclonal antibody was also observed to CN (Lane 3), apparently to the CN-A subunit (~60 kDa), and to a band with lower molecular mass, possibly containing the CN-B subunit. Recognition of the CN-B subunit may result from its 35% homology with CaM [26].
Figure 1. Detection of photochemically crosslinked CaM-CN and CaM-eNOS by NHS-LC-SDA.
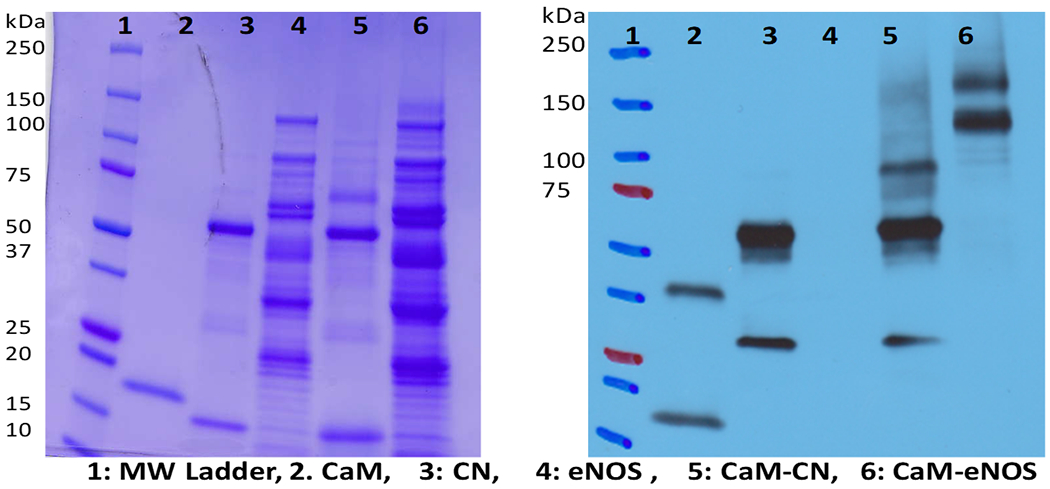
SDS-PAGE (left) and western blot (right) showing photoproducts of CaM-CN (~77 kDa) in lane 5 and CaM-eNOS (~153 kDa) lane 6.
Other crosslinkers were not as successful for crosslinking CaM with CBPs (data not shown). For example, NHS-SDA with a short spacer did not yield inter-protein crosslinking under our experimental conditions. Multiple labeling of CaM-AF647 with NHS-LC-SDA was also observed by mass spectrometry (see Supporting Information). Therefore, a mixture of multiple AF647-labeled species was likely formed by the photo-crosslinking reaction. The presence of CaM-CN in crosslinked samples was checked by in-gel digestion and mass spectrometric analysis of bands isolated by SDS-PAGE. Mass spectrometric analysis of tryptic digested peptides verified the presence of CaM and CN in the CaM-CN crosslinked sample (Supporting Information Figure S3). However, the presence of CaM in CaM-eNOS crosslinked sample could not be verified by analysis of tryptic peptides, suggesting that this photoproduct, whose presence was detected by western blotting and microchip electrophoresis (see below) is present in lower abundance.
3.2. Capillary electrophoresis of calmodulin conjugates with calmodulin binding proteins
As a benchmark for microchip separations, CE was carried out for the CaM-CBP conjugates. Methods are described in ref. [19]. Figure 2 shows electropherograms obtained for the separation of CaM-eNOS (A) and CaM-CN (B) photoproducts separately. In this analysis, HPMC was added to the BGE (75 mM boric acid, pH 9.2, 3.5 mM SDS, and 0.05 % (m/v) HPMC). HPMC is expected to reduce the EOF and non-specific surface adsorption of analytes onto the capillary wall by coating the capillary surface [27].
Figure 2. CZE of CaM-CBP conjugates.
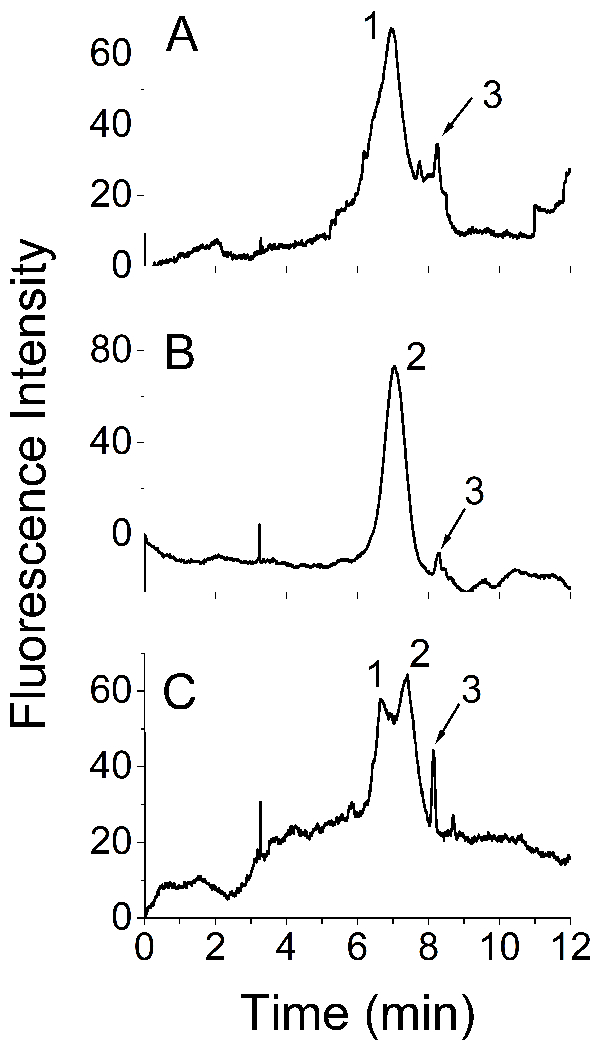
Electropherograms of (A) CaM-eNOS and CaM-AF647; (B) CaM-CN and CaM-AF647; (C) a mixture of CaM-eNOS and CaM-CN. Peaks 1, 2, and 3 are CaM-eNOS, CaM-CN, and CaM-AF647, respectively. The field strength was 241.9 × 10³ V/m with a 0.31-m bare silica capillary (id 50 μm), BGE: 75 mM boric acid, pH 9.2, 3.5 mM SDS, 0.05% (m/v) HPMC.
Peaks 1, 2 and 3 in Figure 2C were assigned to CaM-eNOS, CaM-CN and CaMAF647, respectively, based on migration times of individual samples of CaM-CN and CaM-eNOS, (Figures 2A and 2B). Analytes migrated in reverse order according to molecular mass. However, a mixture of CaM-CN and CaM-eNOS photoproducts could not be fully resolved under the same experimental conditions (Figure 2C).
3.3. Separation of calmodulin conjugates with calmodulin binding proteins by microchip electrophoresis with gated injection
MCZE separation of CBPs crosslinked with CaM-AF647 was tested with several different microfluidic devices (glass, PDMS/glass, PMMA/glass, different injection methods (gated and crossed), and different run buffers (tris, HEPES, TBE and boric acid) to compare the resolution achieved. Gated injection is driven by EOF whereas crossed injection is based on the electrophoretic mobility of analytes. Under MCZE with normal polarity, cathodic EOF drives the net flow towards the cathodic lead. Separation is based on the electrophoretic mobility relative to the EOF.
Figure 3 shows MCZE of CaM-AF647 and CaM-CBP photoproducts in a 0.10-m glass serpentine chip. The EOF was adjusted by changing the pH and ionic strength of the BGE. Among a range of separation conditions tried, the best separation was obtained with a BGE of 50 mM boric acid, pH 9.2, with 3.5 mM SDS. Higher pH and higher field strengths generated higher EOF but some low-abundance photoproducts could not be detected, possibly due to the band broadening and co-migration (data not shown). Low ionic strength buffers reduced the resolution whereas high ionic strength buffers such as 150 mM boric acid, pH 9.2 resulted in inconsistent gating, high Joule heating, and electrolysis (data not shown).
Figure 3. Microchip electrophoresis of CaM-CN and CaM-eNOS photoproducts with a 0.10-m serpentine glass chip.
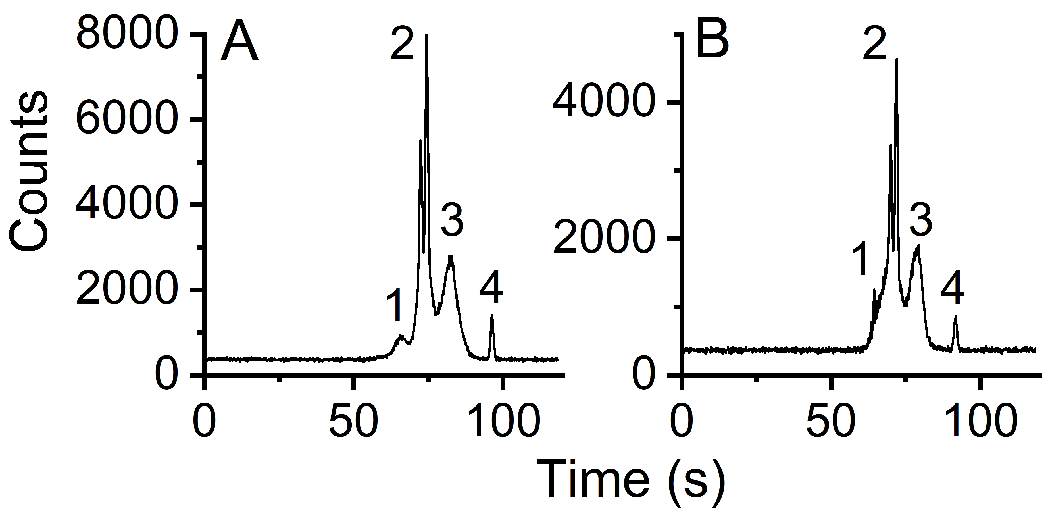
(A) Mixture of CaM-AF647 (~150 nM), CaM-CN photoproducts (~100 nM), and AF647 (10 nM). Peaks 1 and 3 are assigned to CaM-CN photoproducts, peak 2 to CaM-AF647, and peak 4 to AF647. (B) Mixture of CaM-AF647, CaM-eNOS photoproducts, and AF647. Peaks 1 and 3 are assigned to CaM-eNOS photoproducts, peak 2 to CaM-AF647, and peak 4 to AF647. For both separations the buffer composition was 50 mM boric acid, pH 9.2, 3.5 mM SDS, separation potential 7.5 kV, injection time 0.3 s. The detection length was ~0.08 m.
A mixture of CaM-AF647 and CaM-CN photoproduct was separated by MCZE (Figure 3A). AF647 was also included in the mixture as a positive marker. Peaks 1 and 3 can be assigned to CaM-CN photoproducts and peaks 2 and 4 to CaM-AF647 and AF647, respectively. Migration times of CaM-AF647 and AF647 were determined in a separate experiment. CaM-AF647 was assigned by the peak shape, peak intensity, and migration time. The identity of the AF647 peak was confirmed by spiking with AF647. The assignment of the CaM-CN photoproduct is based upon migration times and peak shapes observed for CaM-CN photoproducts alone. The signal-to-noise ratio (S/N) was above 5 for peak 1 (Figure 3A). Dual peaks for CaM-AF647 were observed at concentrations of CAM-AF647 of roughly 50 nM or higher whereas only a single peak was resolved at lower concentrations (5-10 nM).
Similarly, Figure 3B shows the separation of a mixture of CaM-AF647, CaM-eNOS photoproducts, and AF647 in a 0.10-m glass serpentine chip. Conditions, including the run buffer, were the same as that for Figure 3A. Peaks 2 and peak 4 were assigned as CaM-AF647 and AF647, respectively. Increasing the concentration of CaM-eNOS photoproduct in the sample verified the identity of peak 3 (Figure 3B). A possible shoulder (peak 1) also corresponds to a band observed in CaM-eNOS photoproducts alone.
Separation of a mixture of CaM-CN and CaM-eNOS photoproducts was attempted with a 0.10-m glass serpentine microchip under the same conditions described above. However, it was not possible to resolve CaM-CN and CaM-eNOS photoproducts due to similar migration times (see Figure S4 in Supporting Information). The peaks labeled 3 in Figures 3A and 3B have similar migration times in the two samples (80 to 85 s in Figure 3A or at 75 to 80 s in Figure 3B). The position of the peak between CaM-AF647 (peak 2) and AF647 suggests that the electrophoretic mobility of CaM-CN (Figure 3A) or CaM-eNOS (Figure 3B) lies between that of CaM-AF647 and AF647 itself. They may also correspond to fragments of CaM-CN or CaM-eNOS photoproducts with similar migration times. As a result of the similar migration times for CaM-CN and CaM-eNOS photoproducts (Figures 3A and 3B), it was not possible to separate them by MCZE.
Applying different separation voltages (5-10 kV), ionic strengths (10-150 mM boric acid), pH (8.2-10), and separation lengths (0.040-0.095 m) did not improve the resolution of co-migrating peaks (data not shown). Further, it was very difficult to maintain high voltages due to Joule heating and electrolysis, and bubbles generated at the electrodes caused chip failure. To suppress EOF, a polymer additive, HPMC was used in separate experiments (results not shown). However, even with very low concentrations of HPMC (0.01% m/v) it was impossible to obtain reproducible gated injections. The reduction of EOF decreased the ability to establish the fluidic gate and hence the reproducibility of gated injections.
3.4. Separation of calmodulin conjugates with calmodulin binding proteins by pinched injection
As an alternative to MCZE, microchip-based methods were also tested under conditions chosen to suppress EOF. Gated injection is not efficient with low EOF. Therefore, pinched (or cross) injection with “pull back” was used to inject the sample. Voltages were controlled via a high-voltage relay box to perform injections and separations [19]. During the resting stage, a positive voltage was applied to the sample waste reservoir, while no voltage was applied to the buffer and buffer waste reservoirs. During the injection step a high positive voltage was applied to the buffer waste reservoir while the buffer reservoir was grounded. At the same time a relatively low positive voltage was applied to both the sample and sample waste reservoirs to prevent leaking into the separation channel. HPMC (90 kDa) and a high ionic strength buffer, 4X tris-borate EDTA (4X TBE, consisting of 360 mM tris-borate, 8.0 mM EDTA), pH 8.3, were used to suppress EOF [28].
Figure 4 shows the electropherogram for a mixture of CaM-CN and CaM-eNOS. A sample plug was introduced into the separation channel of a 0.035-m PDMS/glass chip by cross-injection. To promote the formation of micelles 10 mM SDS, which is above the critical micelle concentration, was used in both the sample and run buffers. Multiple runs under these conditions are shown in Figure 4A, which shows four distinct peaks. The peaks were identified based on their migration times. Consistent injections and migration times were maintained throughout the analysis. Figure 4B shows the dependence on the log mobility on molecular mass for the separations in Fig. 4A.
Figure 4. Separation of CaM-CN and CaM-eNOS photoproducts with a PDMS/glass chip and EOF suppression.
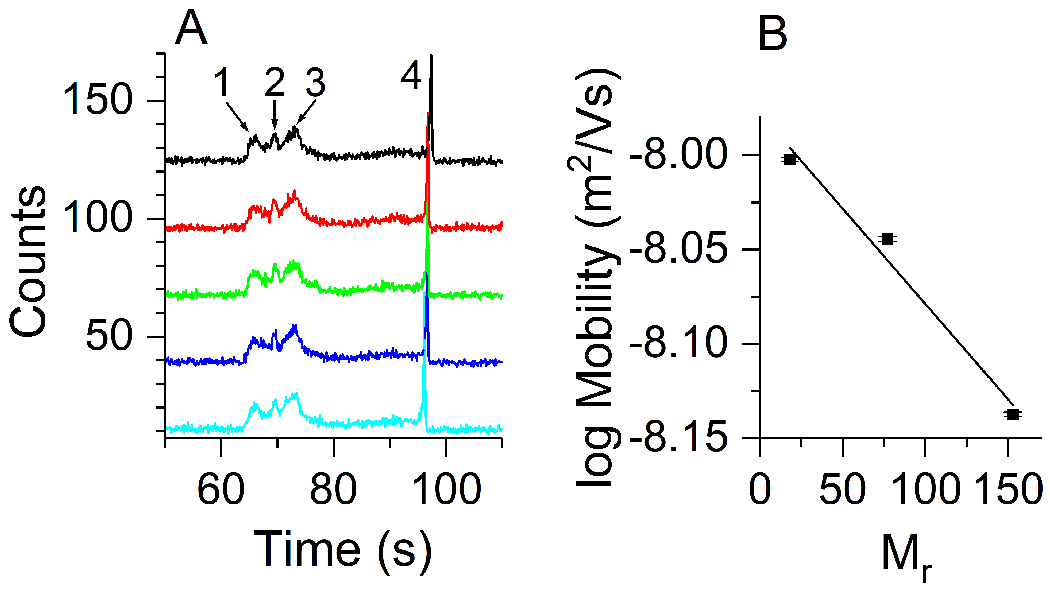
(A) Electropherograms for a series of repeated injections. A simple “T” PDMS/glass chip with a 0.035-m separation channel was used. Peak 1 was identified as CaM, peaks 2 and 3 as CaM-CN photoproducts, and peak 4 as CaM-eNOS photoproducts. Consecutive multiple runs (n=5) show consistent migration times. (B) Apparent mobility vs. relative molecular mass of analytes. The linear least squares fit yields log μ = −0.0010 Mr − 7.98, where Mr is the relative molecular mass. Peak 3 was used for the mobility calculation of CaM-CN. Error bars show the standard error. The separation conditions were as follows: 4X TBE (360 mM tris-borate, 8.0 mM EDTA), pH 8.3, 0.05% (m/v) HPMC, 10 mM SDS, separation potential 800 V, detection length ~0.015 m.
Similar electropherograms obtained with PDMS/PMMA chips are shown in the Supporting Information (Figure S4). Adjustments of analyte concentrations, field strengths, and run buffer conditions did not improve the resolution in either PDMS/glass or PDMS/PMMA chips. HPMC adsorbed onto the PDMS channel walls, as observed through the microscope. The buildup caused band broadening and clogging of channels. Maximum usage time of a microchip with those separation conditions was approximately thirty minutes.
3.5. Separation of calmodulin conjugates with calmodulin binding proteins by silica-nanoparticle chips
Silica-nanoparticle colloidal arrays have proven useful for size-based microfluidic separations [19,22]. A self-assembled colloidal array with 170-nm silica-nanoparticles in a 0.01-m PDMS/glass microchip was used for the analysis. TBE 3X (270 mM tris-borate, 6.0 mM EDTA), pH 8.3 with 3.5 mM SDS was selected for low conductivity and low EOF. The detection length was ~5 mm. Figure 5 shows electropherograms of a mixture of CaM-AF647, CaM-CN photoproducts, and CaM-eNOS photoproducts. Each peak was identified by its migration time and by spiking of individual samples. CaM-AF647, CaM-CN, and CaM-eNOS photoproducts were partially resolved with a 3X TBE run buffer (Fig. 5A). The migration order was compatible with sieving by the silica nanoparticle array where smaller analytes migrate more quickly followed by larger analytes [29]. The presence of unresolved shoulders suggests the presence of multiple photoproducts. Resolution depended on the ionic strength. With 4X TBE, CaM-CN and CaM-eNOS photoproducts were not resolved in a mixture containing both proteins (Fig. 5B). Peak 3 corresponds to an apparent low-abundance photoproduct of CaM-eNOS, which was only observed in concentrated samples under relatively low field strengths. Separation was further degraded with a 5X TBE run buffer (data not shown). Deviations of migration times, peak shape, and intensity of proteins were observed in consecutive runs. Background also increased, decreasing sensitivity to species with low abundance. The relation between the log mobility and molecular mass for the separation in Figure 5A is shown in Figure 5C.
Figure 5. Separation of CaM-CBP photoproducts in a silica-nanoparticle colloidal array in a PDMS/glass microfluidic device.
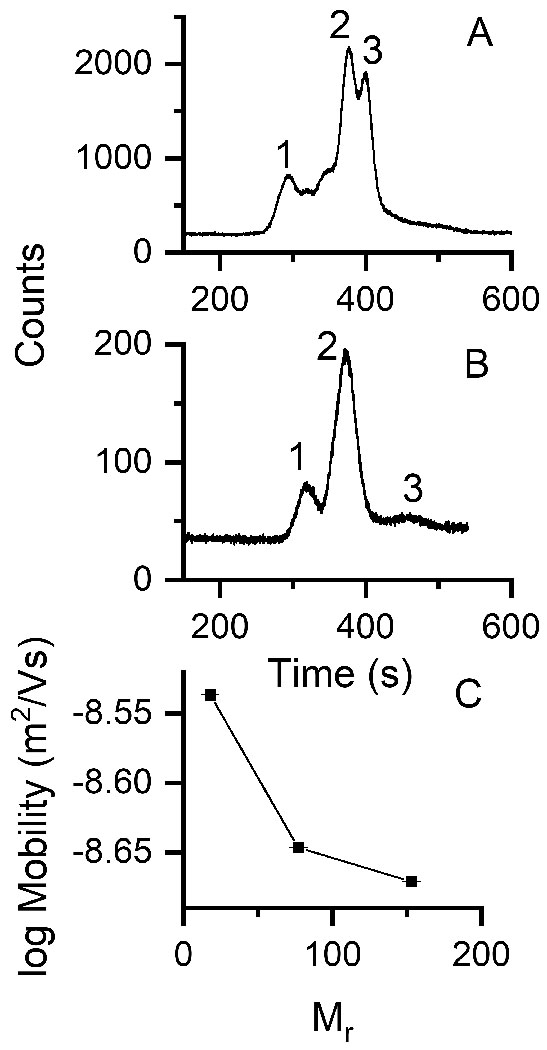
The particle diameter was 170 nm, detection length, ~5 mm. (A) Run buffer: 3X TBE, pH 8.5 with 3.5 mM SDS, separation field strength 5.8 × 10³ V/m. Peaks 1, 2 and 3 can be identified with CaM-AF647, CaM-CN photoproduct, and CaM-eNOS photoproduct, respectively. (B) Run buffer: 4X TBE, pH 8.5 with 3.5mM SDS, field strength 4.3 × 10³ V/m, total concentration of the mixture ~60 nM. Peak 1 corresponds to CaM-AF647, peak 2 to both CaM-CN and CaM-eNOS photoproducts, and peak 3 to a CaM-eNOS photoproduct. (C) Apparent log mobility vs. relative molecular mass of analytes for the separation shown in A with 3X TBE, n=3.
4. Discussion
CBPs were selectively detected by fluorescence of CaM-AF647 bound to CBPs. The binding affinity of CaM with CBPs is typically very strong with Kd values in the nanomolar or sub-nanomolar range and with correspondingly slow off-rates [11,12]. However, electrophoretic separation conditions, such as heat denaturation in the presence of SDS and buffers with high ionic-strength, could disrupt CaM-CBP complexes. Hence, photo-induced cross linking was used to preserve conjugation of CBPs with CaM-AF647 under the denaturing conditions used for separation. SDS-PAGE and western blotting demonstrate the formation of conjugates (Figure 1), as do the results from the separations shown in this paper.
Separation of the CBP photoproducts by CZE was poor (Figure 2), consistent with our previous observation for a set of model proteins [19]. MCZE was also ineffective (Figure 3). The most effective separation conditions for CaM-AF647, CaM-CN photoproduct, and CaM-eNOS photoproduct resulted from suppression of EOF and pinched injection (Figure 4). The migration order was from smaller molecules (highest mobility) to larger molecules (lowest mobility). The separation conditions used for that analysis, with SDS concentrations higher than the critical micelle concentration, could be conducive to separation by sieving or MEKC. In the latter, separation depends on differential interactions of the proteins with micelles [29,30]. However, the peak ordering is consistent with sieving, in which the largest molecule has the lowest mobility and the smallest molecule has the highest. An Ogston sieving model predicts a linear relationship between the log of the apparent mobility, log μ, and the relative molecular mass, Mr [31-33]. The approximate linearity of the plot (Fig. 4B) suggests that the separation is roughly consistent with the Ogston sieving model. This observed behavior might be explained by the presence of HPMC in the run buffer. HPMC was added to suppress EOF, but might also act as a sieving matrix as reported in previous studies [34,35].
Separation by silica-nanoparticle colloidal arrays was somewhat less effective. Although the mobility decreased with molecular mass, the log mobility does not fit well to a linear dependence. This may be a result of uncertainties in the molecular mass of the CaM-CBP photoproducts. In contrast, a set of model proteins (CaM, BSA, and concanavalin) separated in a microchip silica-nanoparticle array yielded mobilities with a linear dependence of the log of the mobility on molecular mass, consistent with the Ogston model [19]. The effective pore size of the colloidal array plays a major role in sieving-based separations with a short detection length (~5 mm). The thickness of the electrical double-layer around a silica-nanoparticle depends on the ionic strength of the BGE [22]. The resolution with 5X TBE may be poor compared to that with 3X or 4X TBE because the reduced width of the double layer permits closer approach of the negatively charged protein-SDS complex to the negatively charged surface of the nanoparticles, resulting in an effectively larger pore size. Hence, sieving by the silica-nanoparticle array appears to be more effective with 3X TBE than with 5X TBE, enhancing the band separation.
It is important to consider the possibility that more than one photoproduct may be formed by the photo-crosslinking reaction. Multiple labeling of CaM with the crosslinker (Figure S2) may have generated different photo-reactive species, and the non-specific reactions of diazirine with any C-H bond could lead to the formation of multiple photoproducts. The presence of multiple photoproducts with low abundance might be responsible for the decreased resolution in CaM-CBP separations compared to separations of a set of three standard proteins [19].
5. Concluding Remarks
The work reported here demonstrates the development of a fast and sensitive (LOD, ~5 nM) method for detecting CBPs. We tested the efficacy of separation of model CBPs using a variety of microfluidic devices, separation modes, and dynamically modified channel surfaces. Dynamic coating with additives such as SDS, and HPMC were used to control the surface adsorption of proteins. The best separations were obtained by suppressing EOF and using sieving. Separations were likely further complicated by the apparent presence of a distribution of photoproducts. Further optimization of the separations of a mixture of CaM-CBP could likely be achieved by using a combination of two or more separation modes on a single device. The separation module of the developed platform could be converted in to a two-dimensional separation method to enhance the separation efficiency and peak capacity. For example, a silica-nanoparticle colloidal array could be coupled with MCZE under low-EOF conditions.
Supplementary Material
Acknowledgements
We thank David Weis and his research group for assistance with mass spectrometry. We thank Wenju Xu and Yiqiu Yin, for fabrication and assembly of the silica-nanoparticle chips. We thank Prof. Sue Lunte and Prof. Chris Culbertson for invaluable advice and insightful discussion, Ryan Grigsby for providing the LabVIEW program, Ken Ratzlaff, Instrumentation Design Laboratory, University of Kansas, for designing and building the high voltage relay box, and Prof. Christian Schoenich for use of the photo-chemical reactor. We thank Anthony Persechini, University of Missouri Kansas City and David Arnett, Northwestern College, for gifts of eNOS, and Paul Stemmer, Wayne State University, for a gift of CN. This project was funded in part by a Patton Trust Research Development Grant from the Kansas City Area Life Sciences Institute.
Abbreviations:
- AF647
Alexa Fluor 647
- CaM
calmodulin
- CBP
calmodulin binding proteins
- CN
calcineurin
- DDM
n-dodecyl-β-D-maltopyranoside
- eNOS
endothelial nitric oxide syntheses
- HEPES
4-(2-hydroxyethyl)-1-piperazineethanesulfonic acid
- HPMC
hydroxypropyl methylcellulose
- HVPS
high-voltage power supply
- MCE
microchip electrophoresis
- MCZE
microchip zone electrophoresis
- NHS-LC-SDA
succinimidyl 6-(4,4′-azipentanamido) hexanoate
- PDMS
polydymethylsiloxane
- PMMA
poly(methyl methacrylate)
- TBE
Tris-borate EDTA
Footnotes
Conflict of interest statement
The authors declare no financial/commercial conflicts of interest.
Supporting Information
Additional supporting information may be found online in the Supporting Information section at the end of the article.
References
- [1].Chin D, Means AR, Calmodulin: A prototypical calcium sensor. Trends Cell Biol. 2000, 10, 322–328. [DOI] [PubMed] [Google Scholar]
- [2].Means AR, in: Bradshaw RA, Dennis EA (Eds.), Handbook of cell signaling. Academic Press, San Diego: 2004, pp. 83–85. [Google Scholar]
- [3].O’Day DH, CaMBOT: Profiling and characterizing calmodulin-binding proteins. Cell. Signal. 2003, 15, 347–354. [DOI] [PubMed] [Google Scholar]
- [4].O’Day DH, Myre MA, Calmodulin-binding domains in Alzheimer’s disease proteins: Extending the calcium hypothesis. Biochem. Biophys. Res. Commun. 2004, 320, 1051–1054. [DOI] [PubMed] [Google Scholar]
- [5].Berggård T, Arrigoni G, Olsson O, Fex M, Linse S, James P, 140 mouse brain proteins identified by Ca2+-calmodulin affinity chromatography and tandem mass spectrometry. J. Proteome Res. 2006, 5, 669–687. [DOI] [PubMed] [Google Scholar]
- [6].Jang D-J, Guo M, Wang D, Proteomic and biochemical studies of calcium- and phosphorylation-dependent calmodulin complexes in mammalian cells. J. Proteome Res. 2007, 6, 3718–3728. [DOI] [PubMed] [Google Scholar]
- [7].Black DJ, Tran Q-K, Keightley A, Chinawalkar A, Mcmullin C, Persechini A, Evaluating calmodulin–protein interactions by rapid photoactivated cross-linking in live cells metabolically labeled with photo-methionine. J. Proteome Res. 2019, 18, 3780–3791. [DOI] [PubMed] [Google Scholar]
- [8].Huang B, Wu H, Bhaya D, Grossman A, Granier S, Kobilka BK, Zare RN, Counting low-copy number proteins in a single cell. Science 2007, 315, 81–84. [DOI] [PubMed] [Google Scholar]
- [9].Dorfman KD, King SB, Olson DW, Thomas JD, Tree DR, Beyond gel electrophoresis: Microfluidic separations, fluorescence burst analysis, and DNA stretching. Chem. Rev. 2013, 113, 2584–2667. [DOI] [PMC free article] [PubMed] [Google Scholar]
- [10].Karim MR, Shinagawa S, Takagi T, Electrophoretic mobilities of the complexes between sodium dodecyl sulfate and various peptides or proteins determined by free solution electrophoresis using coated capillaries. Electrophoresis 1994, 15, 1141–1146. [DOI] [PubMed] [Google Scholar]
- [11].Štěpánová S, Kašička V, Recent applications of capillary electromigration methods to separation and analysis of proteins. Anal. Chim. Acta 2016, 933, 23–42. [DOI] [PubMed] [Google Scholar]
- [12].Dawod M, Arvin NE, Kennedy RT, Recent advances in protein analysis by capillary and microchip electrophoresis. Analyst 2017, 142, 1847–1866. [DOI] [PMC free article] [PubMed] [Google Scholar]
- [13].Štěpánová S, Kašička V, Analysis of proteins and peptides by electromigration methods in microchips. J. Sep. Sci. 2017, 40, 228–250. [DOI] [PubMed] [Google Scholar]
- [14].Štěpánová S, Kašička V, Recent developments and applications of capillary and microchip electrophoresis in proteomics and peptidomics (2015–mid 2018). J. Sep. Sci. 2019, 42, 398–414. [DOI] [PubMed] [Google Scholar]
- [15].Cho HJ, Xie QW, Calaycay J, Mumford RA, Swiderek KM, Lee TD, Nathan C, Calmodulin is a subunit of nitric oxide synthase from macrophages. J. Exp. Med. 1992, 176, 599–604. [DOI] [PMC free article] [PubMed] [Google Scholar]
- [16].Rafikov R, Fonseca FV, Kumar S, Pardo D, Darragh C, Elms S, Fulton D, Black SM, eNOS activation and no function: Structural motifs responsible for the posttranslational control of endothelial nitric oxide synthase activity. J. Endocrinol. 2011, 210, 271–284. [DOI] [PMC free article] [PubMed] [Google Scholar]
- [17].Mondragon A, Griffith EC, Sun L, Xiong F, Armstrong C, Liu JO, Overexpression and purification of human calcineurin α from Escherichia coli and assessment of catalytic functions of residues surrounding the binuclear metal center. Biochemistry 1997, 36, 4934–4942. [DOI] [PubMed] [Google Scholar]
- [18].Allen MW, Urbauer RJ, Zaidi A, Williams TD, Urbauer JL, Johnson CK, Fluorescence labeling, purification, and immobilization of a double cysteine mutant calmodulin fusion protein for single-molecule experiments. Anal. Biochem. 2004, 325, 273–284. [DOI] [PubMed] [Google Scholar]
- [19].Samarasinghe TN, Zeng Y, Johnson CK, Comparison of separation modes for microchip electrophoresis of proteins. J. Sep. Sci. 2020, in press. [DOI] [PMC free article] [PubMed] [Google Scholar]
- [20].Scott DE, Grigsby RJ, Lunte SM, Microdialysis sampling coupled to microchip electrophoresis with integrated amperometric detection on an all-glass substrate. Chemphyschem 2013, 14, 2288–2294. [DOI] [PMC free article] [PubMed] [Google Scholar]
- [21].Allen PB, Chiu DT, Calcium-assisted glass-to-glass bonding for fabrication of glass microfluidic devices. Anal. Chem. 2008, 80, 7153–7157. [DOI] [PMC free article] [PubMed] [Google Scholar]
- [22].Zeng Y, Harrison DJ, Self-assembled colloidal arrays as three-dimensional nanofluidic sieves for separation of biomolecules on microchips. Anal. Chem. 2007, 79, 2289–2295. [DOI] [PubMed] [Google Scholar]
- [23].http://www.piercenet.com/instructions/2162067.pdf (last time accessed: 2013).
- [24].Haywood J, Mozziconacci O, Allegre KM, Kerwin BA, Schoneich C, Light-induced conversion of Trp to Gly and Gly hydroperoxide in IgG1. Mol. Pharm. 2013, 10, 1146–1150. [DOI] [PMC free article] [PubMed] [Google Scholar]
- [25].Gomes AF, Gozzo FC, Chemical cross-linking with a diazirine photoactivatable cross-linker investigated by MALDI- and ESI-MS/MS. J. Mass Spectrom. 2010, 45, 892–899. [DOI] [PubMed] [Google Scholar]
- [26].Rusnak F, Mertz P, Calcineurin: Form and function. Physiol. Rev. 2000, 80, 1483–1521. [DOI] [PubMed] [Google Scholar]
- [27].Doherty EA, Meagher RJ, Albarghouthi MN, Barron AE, Microchannel wall coatings for protein separations by capillary and chip electrophoresis. Electrophoresis 2003, 24, 34–54. [DOI] [PubMed] [Google Scholar]
- [28].Alarie JP, Jacobson SC, Ramsey JM, Electrophoretic injection bias in a microchip valving scheme. Electrophoresis 2001, 22, 312–317. [DOI] [PubMed] [Google Scholar]
- [29].Shadpour H, Soper SA, Two-dimensional electrophoretic separation of proteins using poly(methyl methacrylate) microchips. Anal. Chem. 2006, 78, 3519–3527. [DOI] [PubMed] [Google Scholar]
- [30].Yasui T, Reza Mohamadi M, Kaji N, Okamoto Y, Tokeshi M, Baba Y, Characterization of low viscosity polymer solutions for microchip electrophoresis of non-denatured proteins on plastic chips. Biomicrofluidics 2011, 5, 44114–441149. [DOI] [PMC free article] [PubMed] [Google Scholar]
- [31].Ogston AG, The spaces in a uniform random suspension of fibres. T. Faraday Soc. 1958, 54, 1754–1757. [Google Scholar]
- [32].Rodbard D, Chrambach A, Unified theory for gel electrophoresis and gel filtration. Proc. Natl. Acad. Sci. USA 1970, 65, 970–977. [DOI] [PMC free article] [PubMed] [Google Scholar]
- [33].Viovy J-L, Electrophoresis of DNA and other polyelectrolytes: Physical mechanisms. Rev. Mod. Phys. 2000, 72, 813–872. [Google Scholar]
- [34].Fruetel JA, Renzi RF, Vandernoot VA, Stamps J, Horn BA, West JA, Ferko S, Crocker R, Bailey CG, Arnold D, Wiedenman B, Choi WY, Yee D, Shokair I, Hasselbrink E, Paul P, Rakestraw D, Padgen D, Microchip separations of protein biotoxins using an integrated hand-held device. Electrophoresis 2005, 26, 1144–1154. [DOI] [PubMed] [Google Scholar]
- [35].Strege MA, Lagu AL, Capillary electrophoretic protein separations in polyacrylamide-coated silica capillaries and buffers containing ionic surfactants. J. Chromatogr. A 1993, 630, 337–344. [Google Scholar]
Associated Data
This section collects any data citations, data availability statements, or supplementary materials included in this article.