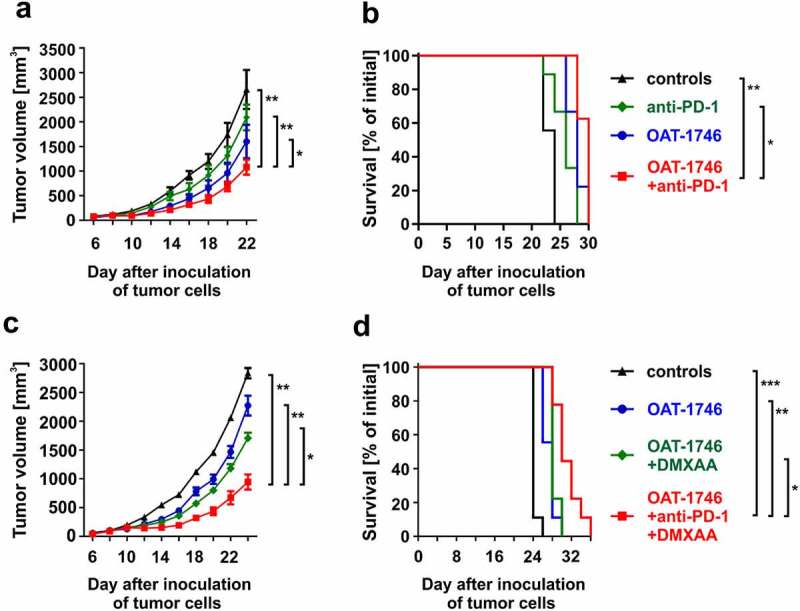
Figure 7.

Arginase inhibitor potentiates antitumor activity of immunotherapies. A-B. C57BL/6 mice were inoculated with 0.1 × 10⁶ of 3LL tumor cells. OAT-1746 was administered twice daily by an intraperitoneal route at a dose of 20 mg/kg for the first 14 days, and anti-PD-1 or isotype control antibodies i.p. at the dose of 10 mg/kg on days 6, 9, 12, 15, and 18. Number of mice in the experimental groups: ctrl n = 9, anti-PD-1 n = 9, OAT-1746 n = 9, OAT-1746+ anti-PD-1 n = 8. A. The graph shows tumor volumes in time. Data show means ± SD; n = 8–10. P values were calculated with two-way ANOVA. *P = .0151; **P < .0001. Individual growth curves are presented in the Supplementary Fig. 16. B. Animal survival curve. P values were calculated with log-rank test. *P = .0011; **P < .0001. C-D. C57BL/6 mice were inoculated with 0.1 × 10⁶ of 3LL tumor cells. OAT-1746 was administered twice daily by an intraperitoneal route at a dose of 20 mg/kg for the first 14 days, anti-PD-1 or isotype control antibodies i.p. at the dose of 10 mg/kg on days 6, 9, 12, 15, and 18 and DMXAA (or NaHCO3 used as DMXAA diluent) by intratumoral injection at a dose of 0.5 µg/mouse on day 8. Number of mice in the experimental groups: ctrl n = 9, OAT-1746 n = 9, OAT-1746+ DMXAA n = 9, OAT-1746+ anti-PD-1+ DMXAA n = 9. C. The graph presents tumor volumes in time. Data show means ± SD; n = 9–10. P values were calculated with two-way ANOVA. *P = .0002; **P < .0001. Individual growth curves are presented in the Supplementary Fig. 17. D. Animal survival curve. P values were calculated with log-rank test. *P = .0078; **P = .0017; ***P < .0001. Additional experimental groups for C and D are shown in Supplementary Figure 12
