

Abstract
Messenger RNA (mRNA) isolated from single cells can generate powerful biological insights, including the discovery of new cell types with unique functions as well as markers potentially predicting a cell’s response to various therapeutic agents. We previously introduced an oligonucleotide-based technique for site-selective, photoinduced biotinylation and capture of mRNA within a living cell called transcriptome in vivo analysis (TIVA). Successful application of the TIVA technique hinges upon its oligonucleotide probe remaining completely inert (or “caged”) to mRNA unless photoactivated. To improve the reliability of TIVA probe caging in diverse and challenging biological conditions, we applied a rational design process involving iterative modifications to the oligonucleotide construct. In this work, we discuss these design motivations and present an optimized probe with minimal background binding to mRNA prior to photolysis. We assess its caging performance through multiple in vitro assays including FRET analysis, native gel comigration, and pull down with model mRNA transcripts. Finally, we demonstrate that this improved probe can also isolate mRNA from single living neurons in brain tissue slices with excellent caging control.
Graphical Abstract
Despite ongoing efforts, much of the brain’s vast circuitry remains unexplored. Programs like the Human Cell Atlas initiative, the NIH Brain Research through Advancing Innovative Neurotechnologies (BRAIN) Initiative, the European Human Brain Project, and others aim to catalyze neurological research by generating a complete catalogue of every major transcriptomics-based cell type found in the brain and other tissues.1,2 These catalogues would serve as scaffolds upon which additional data sets could be interconnected, e.g., linking gene expression profiles with cell surface markers, morphological images, and phenotype descriptions. Single-cell transcriptomics has also been used to better understand and subsequently predict drug sensitivity.3–6 While the potential therapeutic rewards may seem distant, single cell transcriptomics is already driving actionable findings in the clinic. Incorporation of tumor sequencing data into a study conducted at Columbia University Medical Center discovered likely pathogenic germline alterations in 20% of patients, aided diagnostic information in 26% of patients, and identified therapeutic targets in 23% of patients. The sequencing was overall determined to have been clinically impactful in 66% of cases.7
Currently, popular transcriptomic methods present clear strengths coupled with significant drawbacks. Dissociative transcriptomic methods1,2,8–11 often generate huge data sets with significant discovery power and therapeutic predictive potential. However, the combination of (1) stresses imparted during mechanical and enzymatic dissociation, (2) the relatively lengthy time between processing and sequencing, as well as (3) the lack of contextual spatial information on a cell’s point of origin within a tissue all heighten the challenge of identifying functionally important heterogeneity and deducing its biological relevance.12–14 Furthermore, sequencing a vast number of cells can be at odds with sequencing cells at a sufficient depth to study low-abundance transcripts. Conversely, spatial methods15–18 such as FISH-variants preserve spatial information, successfully image some low-abundance transcripts, and capture a finer temporal window of the transcriptome when utilizing fast fixation techniques. However, such methods typically only process a limited number of known genes in a single experiment. Notably, recent advancements have allowed for processing a wider range of genes18 or spatial imaging in live cells.19–23 Lineage reconstruction through computational techniques, scratchpads, and other elements offer a pseudotime element,24–27 but neither dissociative nor spatial methods allow for capture of mRNA at multiple time points in a tissue region or the continued observation of a tissue region after the point of mRNA capture.
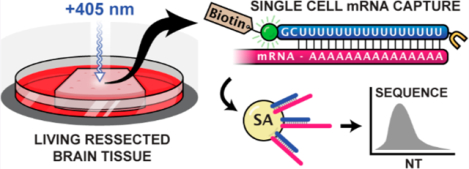
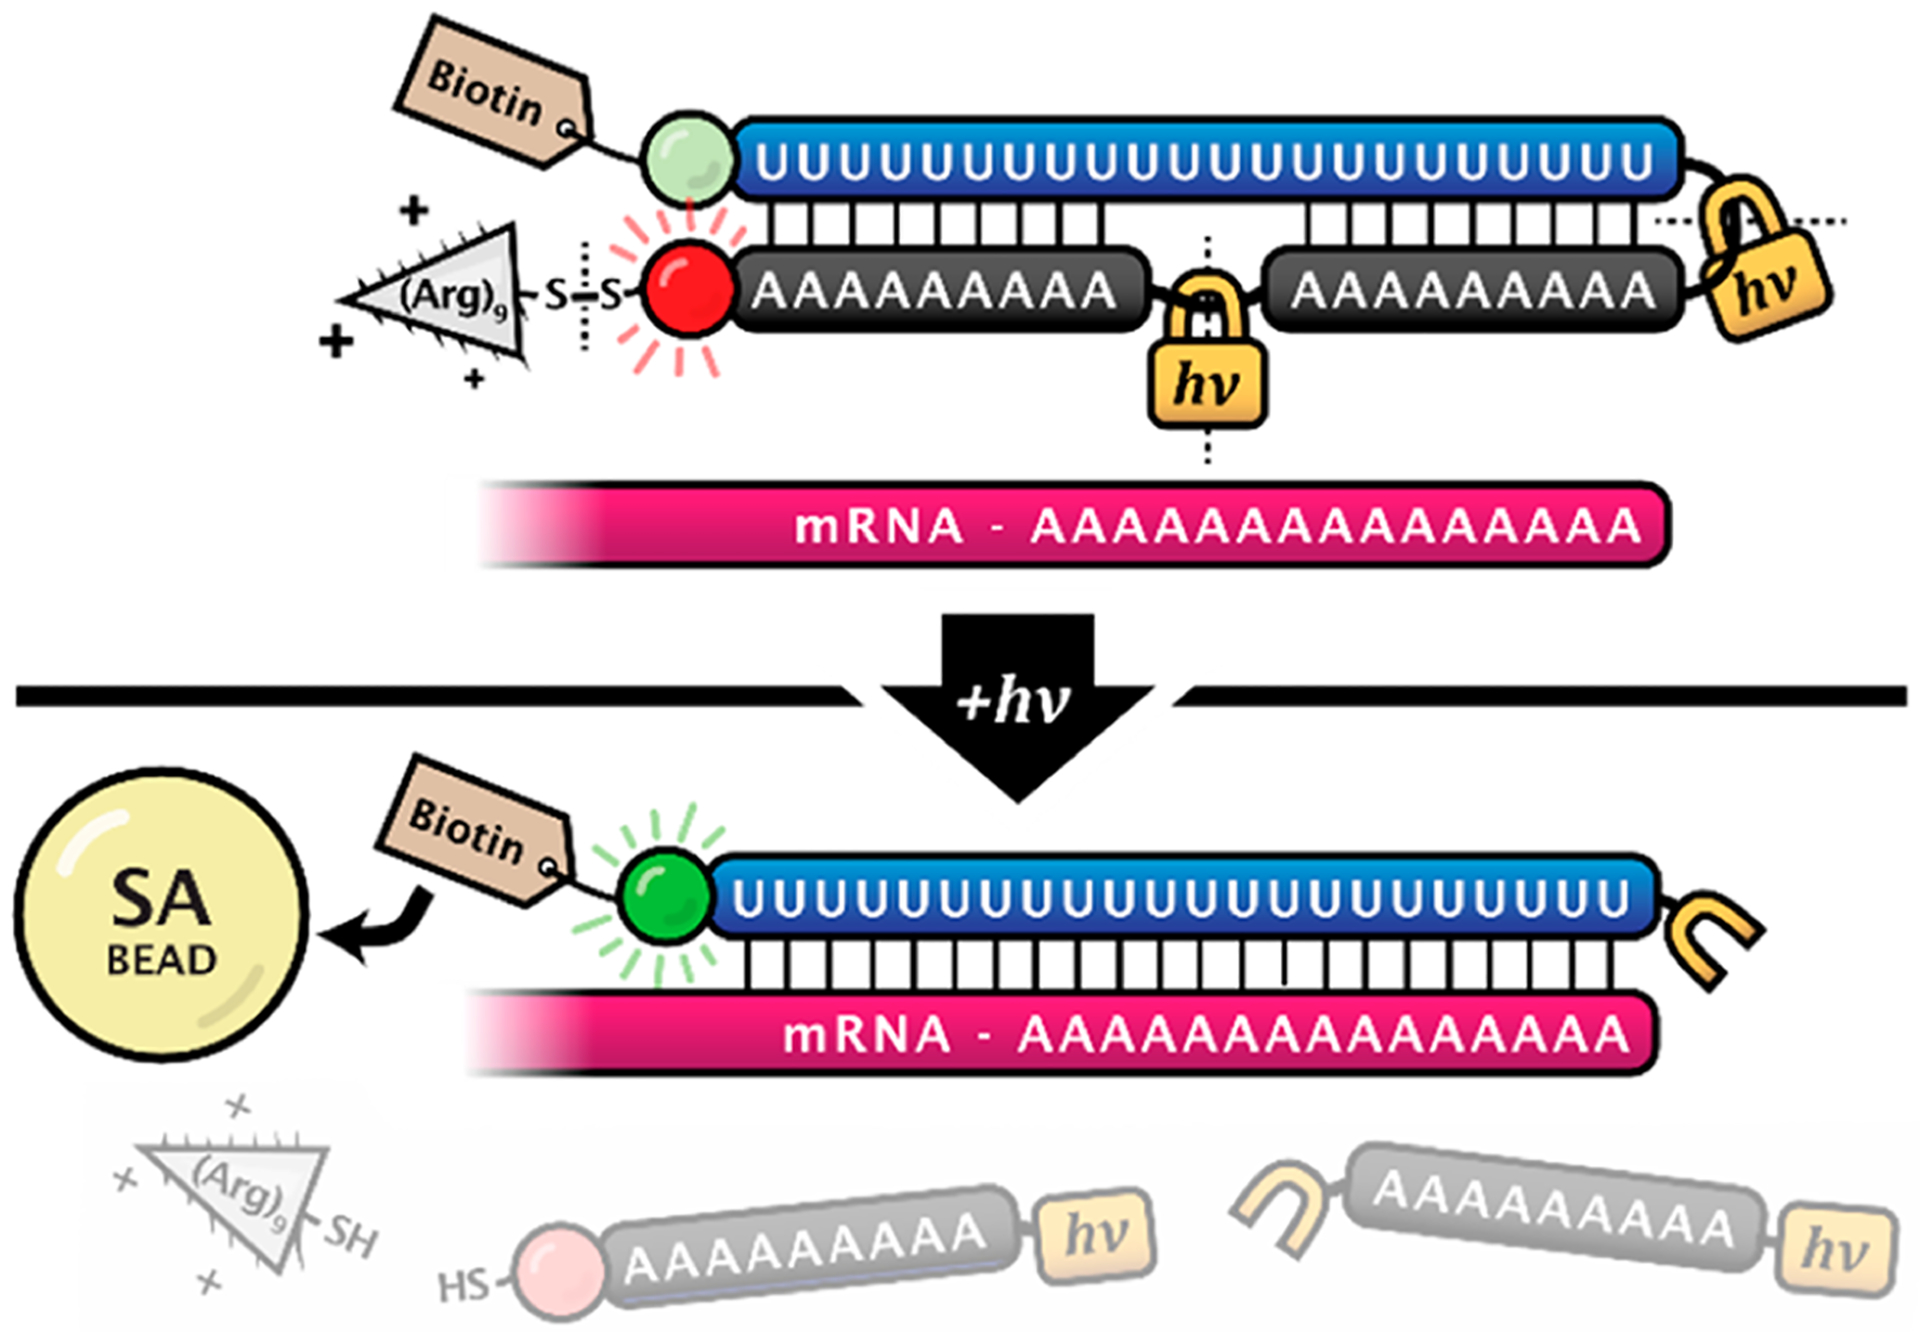
To advance methods for mRNA analysis in live tissue preparations, our lab previously developed a photochemical approach to single-cell transcriptomics, transcriptome in vivo analysis (TIVA) (Figure 1).28 This method utilizes a highly modified oligonucleotide hairpin delivered into cells with a 5′ disulfide-linked (d-Arg)9 cell-penetrating peptide. In the original TIVA probe (“18/7/7”), an 18mer poly-U capture strand was attached via nitrobenzyl photocleavable linker to a chain of two 7mer poly-A blocking strands with an intervening nitrobenzyl linker. Once broadly delivered into a tissue slice, the probe in a specific cell or region of interest was photoactivated under confocal scanning microscopy using a 405 nm laser. A Cy3-Cy5 FRET pair situated at the hairpin termini enabled tracking of probe-labeled cells during development or migration events, and light-mediated hairpin cleavage resulted in a readily observable (>60%) loss of FRET within the target region.
Figure 1.
TIVA probe is an oligonucleotide hairpin capable of penetrating and fluorescently labeling living tissue (Cy3 = green orb, Cy5 = red orb). Once delivered, activation of the target cell or region with a 405 nm laser triggers localized hairpin cleavage, resulting in loss of Cy3-Cy5 FRET and biotinylation of polyadenylated mRNA. mRNA from activated regions can be subsequently purified with streptavidin (SA) beads and sequenced.
TIVA probe photoactivation occurs by cleaving the nitrobenzyl linkers within the oligo hairpin backbone, revealing the poly-U capture strand capable of binding to the poly-A tail of mRNA, effectively biotinylating it for subsequent pull down. Cells containing a photoactivated probe can be extracted from tissue using patch-pipette aspiration, after which they are lysed and mRNA is pulled down by biotin–streptavidin affinity purification. Relative to patch-pipette aspiration alone, the finer spatiotemporal control afforded by TIVA’s light-mediated activation allows for cleaner capture of target mRNA, which is especially useful in complex tissues such as the brain where cleanly isolating single cells by hand can be challenging or even impossible. Furthermore, finer spatial control may enable the study of not only single cells but also subcellular regions of single cells. Thus, TIVA is ideally situated as a method to fluorescently label cells in living tissue and then selectively activate and isolate mRNA from cells of interest while retaining the contextual knowledge of the individual cell histories and local microenvironments.
Achieving cellular specificity with the TIVA method requires the probe to remain inert to its target mRNA (or “caged”) until it is photoactivated in the target cell and also caged in nonphotoactivated, nontarget cells for the duration of the experiment. We recently discovered that the original 18/7/7 TIVA construct (Figure 2A) exhibited a partial loss of FRET (−36%) when incubated with a 30mer poly-A model target without photolysis, indicating imperfect caging.29 To address this, we introduced a variation of the first-generation TIVA probe, “22/9/9 (GC)”, featuring a terminal GC pair and lengthened hairpin (18x → 22x poly-U capture strand, two 7mer →9mer poly-A blocking strands) (Figure 2A). These modifications were meant to align the probe’s nonspecific poly-U/poly-A strands and improve caging, and they succeeded in diminishing the loss of FRET (−18%) for 22/9/9 (GC) incubated with 30mer poly-A RNA strand prior to photolysis.29 While these modifications produced a significant improvement in caging integrity, further work was necessary to address the remaining FRET loss. We present here a third-generation TIVA construct, “22/12/8 (GC)2”, with an additional GC pair and modified hairpin linker (Figure 2C), which shows greatly improved caging. This caging was rigorously assessed in vitro by FRET perturbation, native PAGE comigration, and biotin-mediated pull down of both a polyadenylated GFP transcript as well as complete cellular lysate. In vivo performance was also validated by measuring pre- and postphotolysis mRNA pull down in resected murine brain tissue.
Figure 2.
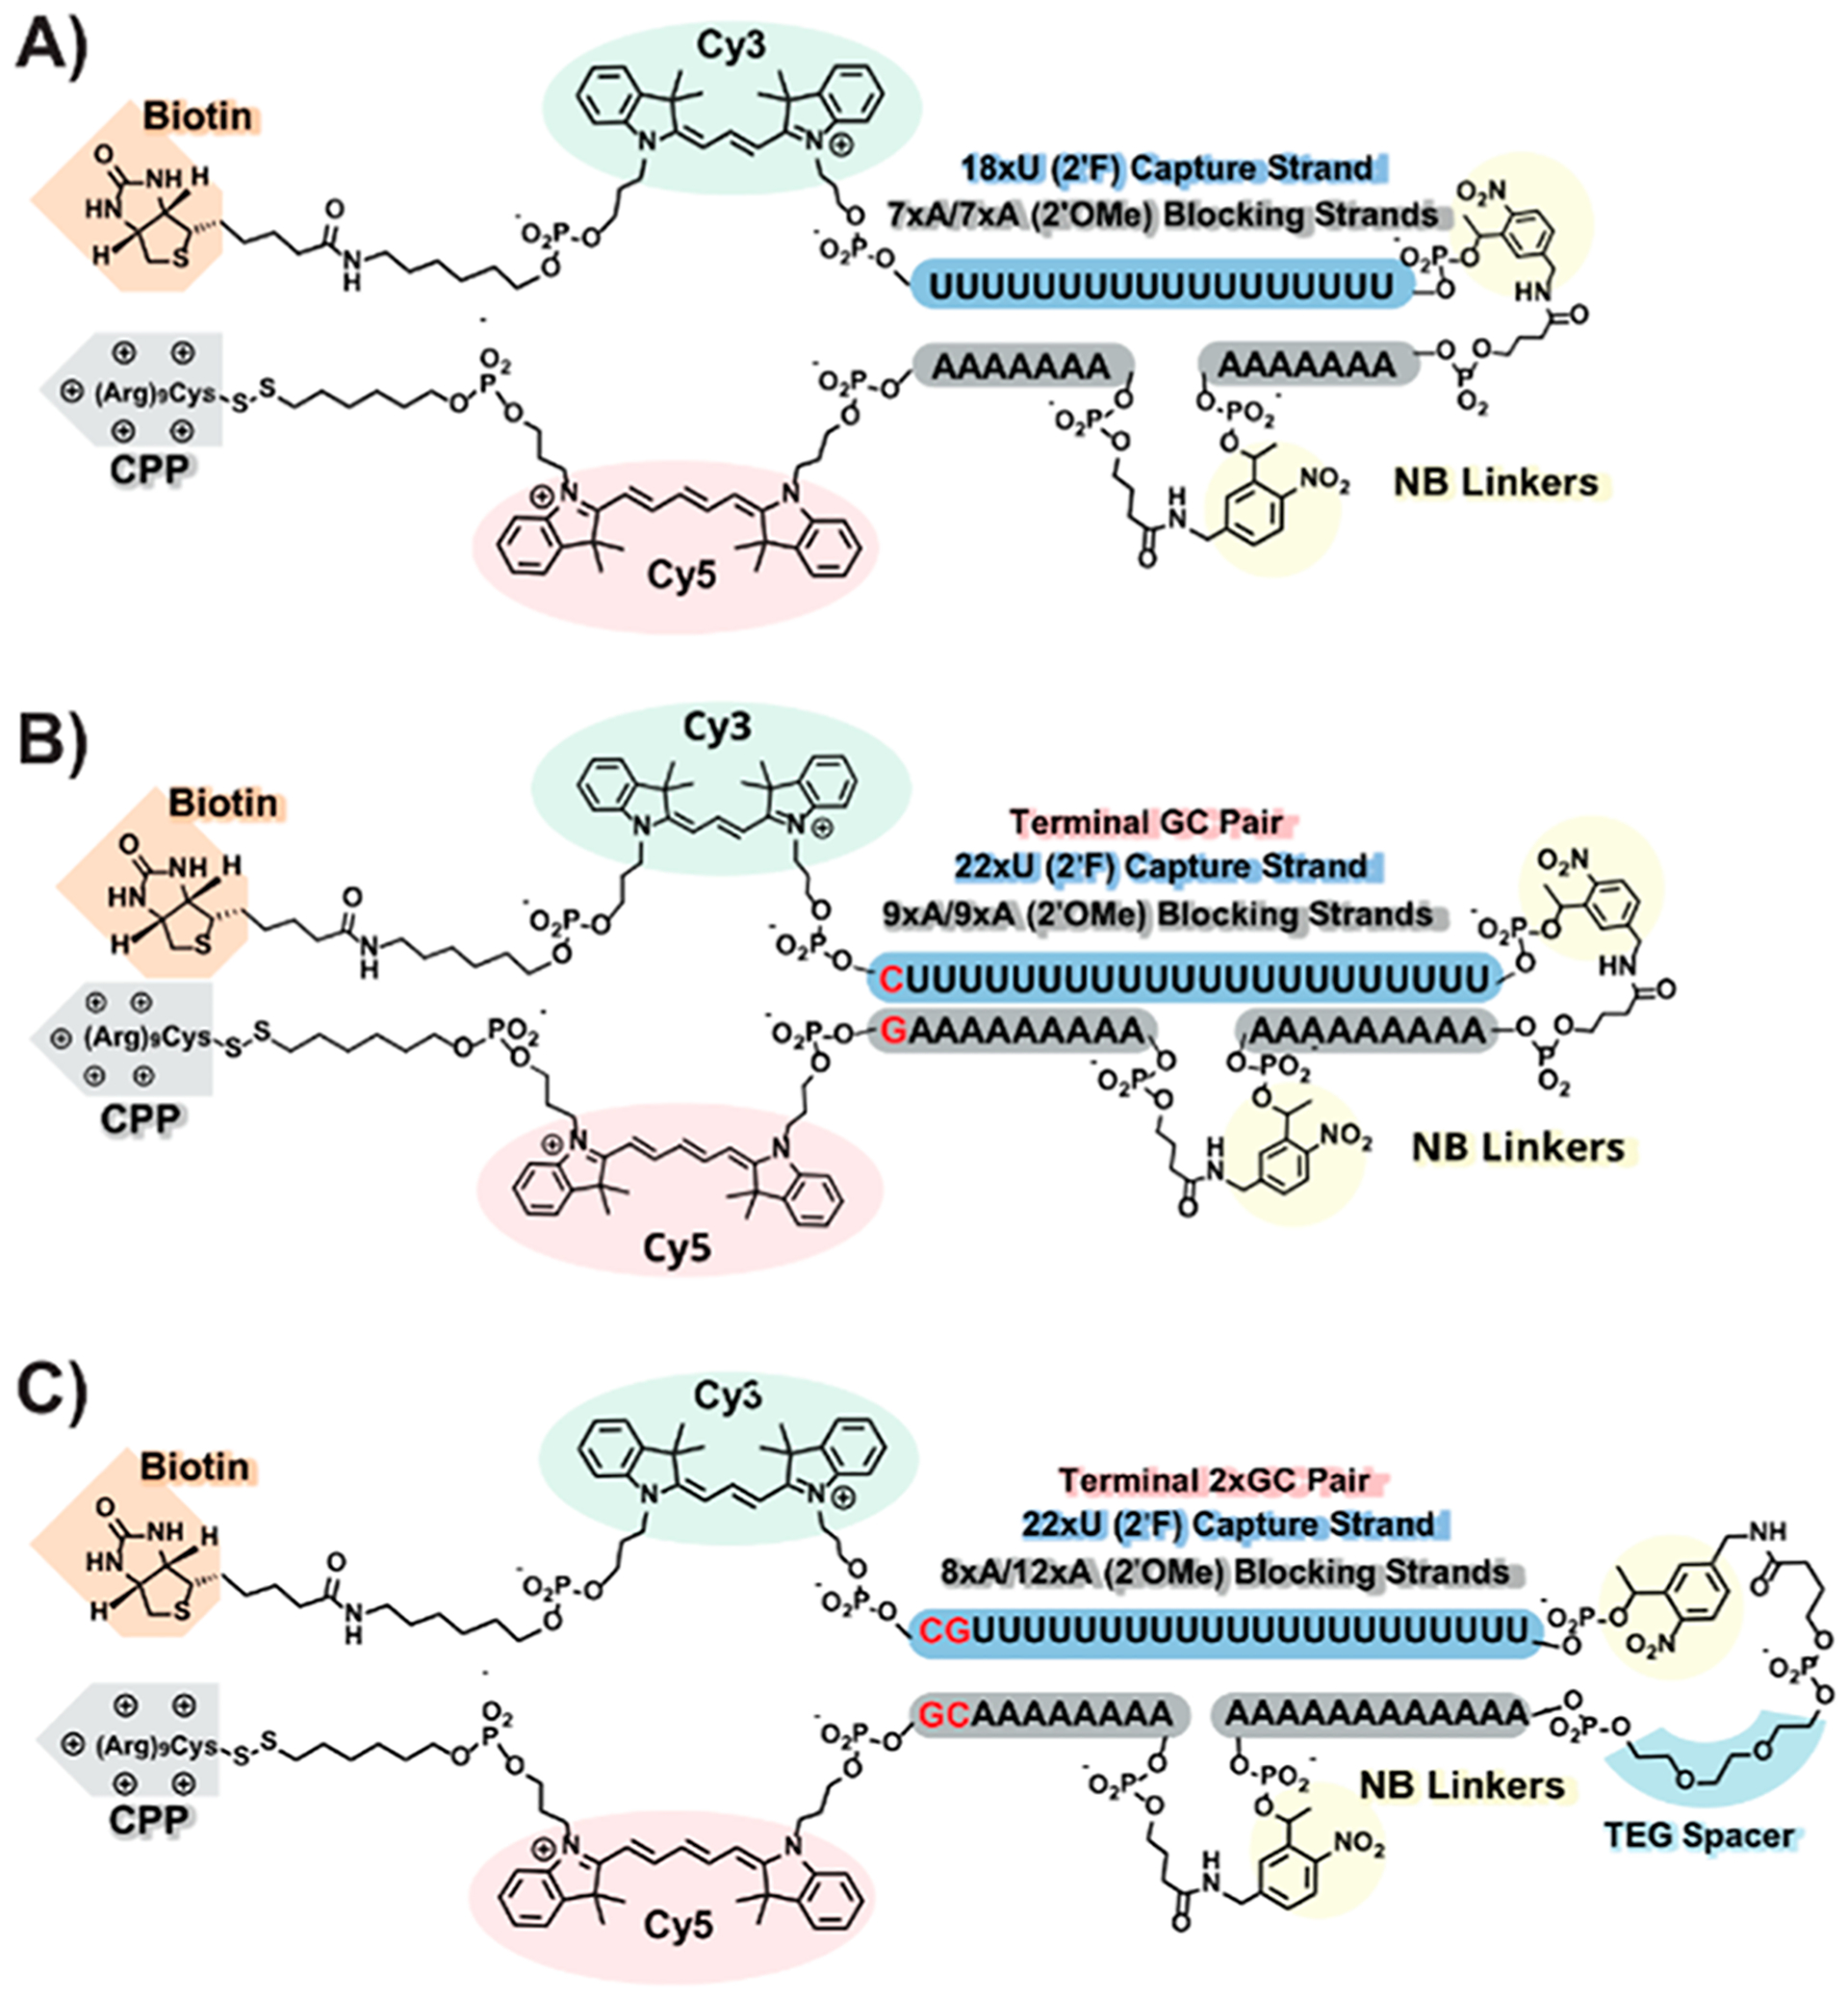
Molecular features of (A) 18/7/7, (B) 22/9/9 (GC), and (C) 22/12/8 (GC)2 TIVA oligo probes.
Finally, to gain insight into factors controlling probe-cell uptake and in vivo stability, we performed additional physical characterization of 22/12/8 (GC)2 by investigating oligo particle size, surface charge, degradation rate, and putative delivery mechanisms. Brain slice studies confirmed the role of the 5′ disulfide-linked (d-Arg)9 cell-penetrating peptide in promoting cell uptake and efficient cytoplasmic delivery. However, solution studies indicated that 22/12/8 (GC)2 adopts a compact, highly anionic, spherical structure—most likely with cationic CPP at the core instead of the exterior. Presentation of the anionic oligo at the outer surface of the oligonucleotide–peptide particle rather than the core is a structural feature shared with other molecular “spherical nucleic acids” (SNAs) that have been engineered.30,31 In these systems, a sufficiently dense surface of oligos appears to mediate cellular uptake. Unlike SNAs, however, neuronal uptake of the 22/12/8 (GC)2 probe does not appear to be mediated by cell-surface scavenger receptors.
RESULTS AND DISCUSSION
Probe Design.
To improve the caged TIVA probe’s duplex alignment and stability against mRNA binding, an additional terminal GC pair was added, for a total of two terminal GC pairs. This inclusion raised the predicted melting temperature of the GC 5′ blocking strand enough that an adenosine was shifted from the 5′ blocking strand (9xA → 8xA) to the 3′ blocking strand (9xA → 10xA) to maintain facile postphotolysis strand dissociation. Furthermore, to improve caging, two additional adenosines were added to the 3′ blocking strand (10xA → 12xA). Finally, we introduced a triethylene glycol (TEG) spacer into the hairpin turn. Simple modeling experiments indicated that the photocleavable linker alone (~16 Å) was too short to accommodate a natural hairpin turn (25–30 Å). This tension likely pulled nearby bases into the turn, straining the alignment of the duplex and leaving bases in the turn exposed as potential toeholds for binding. By introducing the TEG spacer we extended the turn to a more natural 30–32 Å. With the relaxed hairpin turn and a blocking strand that is longer and better aligned to the capture strand we anticipated a significant improvement in caging stability.
Probe Synthesis.
22/12/8 (GC)2 TIVA solid-phase synthesis was performed with an automated ABI 394 DNA/RNA synthesizer using standard phosphoramidite chemistry. To enable a final cell-penetrating peptide (CPP) conjugation step, a terminal 5′-dimethoxytrityl (DMT)-protected disulfide linker was incorporated into the design. After the final coupling, the 5′ DMT protecting group was left intact to improve separation of the completed sequence from truncated products. Cleavage of the probe from the resin was achieved after incubation in ammonium hydroxide at room temperature (rt) for 17 h. The solution-phase product was then separated from failed sequences via reversed-phase high-performance liquid chromatography (RP-HPLC) with a C18 column (Figure S1) and concentrated by vacufuge. The disulfide linkage connecting the 5′ alkyl-DMT moiety was subsequently reduced with a 1 h incubation in 500 mM TCEP, and the liberated alkyl-DMT group was removed using a NAP-10 Sephadex column. CPP conjugation was achieved by incubating the TIVA probe with 6–8 equiv of Cys(Npys)-(d-Arg)9 for 24–36 h in a 1:1 formamide/TEAA buffer solution at rt. The successfully CPP-conjugated probe was then isolated on a Resource Q column using anion-exchange (AX)-HPLC (Figure S1). The collected product was concentrated to 100 μM and buffer-exchanged into 1× STE buffer (pH = 8.0) through a 10k MWCO Amicon spin filter for improved shelf life. The finished 22/12/8 (GC)2 + (d-Arg)9 TIVA probe was stored as 3.0 nmol aliquots at −20 °C.
General Characterization.
22/12/8 (GC)2 + (d-Arg)9 TIVA probe identity was verified by electrospray ionization mass spectrometry (ESI-MS) (Figure S2A), with an expected principal mass of 19 168.8 Da and an observed mass of 19 168.2 Da. Adducts of + 31.2, + 59.7, + 167.8, and +195.5 Da were also identified, likely corresponding to combinations of sodium, acetate, and HFIPA ions retained from the purification or electrospray preparation process. On the basis of the ESI-MS results and polyacrylamide gel electrophoresis (PAGE) separation, we estimated the product purity to be roughly 94%. Two additional species (at <3% intensity) contained one extra adenosine in the blocking strand or one missing uridine in the capture strand. These single deletions or additions are common in oligonucleotides containing long stretches of repeating bases and are especially challenging to remove by HPLC. Fortunately, these species are not expected to affect TIVA functionality. The remaining ~1% impurity are truncation products that failed to deblock prior to Cy5 conjugation. Because these oligo probes lack cell-penetrating peptides, they are not anticipated to enter the cell and subsequently are not expected to pull down cellular mRNA or otherwise affect downstream results. Next, the thermal stability of the probe was characterized (Figure S2B). As expected, the terminal 2xGC pair raised the prephotolysis Tm by ~5° (to 69 °C) relative to first-generation (18/7/7) TIVA (Tm = 64 °C) and ~3° relative to a similar probe with only a single terminal GC pair (Tm = 66 °C) (“22/9/9 (GC) + (d-Arg)9”).29 The addition of a second GC pair did not affect the postphotolysis, target-bound Tm, at 54 °C.
Structural Characterization with DLS and ζ Potential.
To investigate structural details of TIVA probe in solution, dynamic light scattering (DLS) and electrophoretic velocity measurements were performed. Measurements were conducted using TIVA probes lacking Cy5, either with (TIVA-CPP) or without the thiol and CPP (TIVA-NT). Cy5 was excluded to avoid the fluorophore absorbing 633 nm light used in DLS measurements. TIVA-CPP was synthesized and purified as 22/12/8 (GC)2 but without incorporating Cy5. HPLC traces of TIVA-CPP after (d-Arg)9 conjugation are shown in Figure S3A, and the final product was confirmed by ESI-MS (Figure S3B). For TIVA-NT, the synthesis was completed after adding all the adenosines. DMT protecting group was left on for a better separation on HPLC. To remove the DMT group, purified oligo was treated with 10% acetic acid for 2 h at rt (Figure S3C). Product was also confirmed by ESI-MS (Figure S3D). For TIVA-NT measured at 10 μM, the DLS-determined hydrodynamic mean diameter was 8.6 nm, which was comparable to the size of a typical 22mer oligo (estimated from 0.34 nm per nucleotide). The diameter measured at the same concentration for TIVA-CPP was 6.7 nm, surprisingly smaller than that of TIVA-NT. Both probes were under 10 nm, indicating they stayed in molecular forms without forming large nanocomplexes (Figure S4A). The smaller size of TIVA-CPP is likely to arise from a more compact structure formed between (d-Arg)9 CPP and oligo backbone through complementary electrostatic interactions. The ζ potential (Figure S4B) of TIVA-NT was determined to be −11.34 mV in PBS and slightly less negative in water. However, for the TIVA probe modified with (d-Arg)9 CPP, the ζ potential was −20.83 mV in PBS, which is considerably more negative than that of TIVA-NT and reflects its greater electrical stabilization and lower propensity to aggregate in solution. These results suggest a “histone-like” structure for TIVA-CPP, with the (d-Arg)9 CPP forming a dense H-bonded core with oligo closely packed on the outer surface. This compact, anionic structure also appears to have features in common with recently described molecular spherical nucleic acids (SNAs).32,33
These results are consistent with a previous report using noncovalently linked (d-Arg)9, which similarly observe formation of (d-Arg)9-oligo complexes with negative ζ potential at lower ratios of CPP.34 The ζ potential of (d-Arg)9-only in HEPES was measured to be +28.1 mV because of the positively charged guanidino groups. Notably, (d-Arg)9 was observed by DLS to form large, micron-sized particles in solution, highlighting its propensity for inter- and intra-molecular self-association.
FBS Stability.
The serum stability of TIVA probe was evaluated through FRET measurement by monitoring the FRET efficiency of TIVA incubating with 10% FBS at 37 °C for 24 h (Figure 3). For the TIVA 18/7/7 probe, the FRET efficiency decreased about 40%, while the TIVA 22/12/8 (GC)2 kept a high FRET signal comparable to the control groups without FBS and was not affected by the attachment of CPP. The high stability could be attributed to the longer duplex, better alignment with terminal GC pair, and the TEG linker at the turn. This feature provides opportunities to conduct cell loading with FBS-containing media and may allow in vivo studies that require long exposures to nucleases in both extracellular and intracellular environments.
Figure 3.
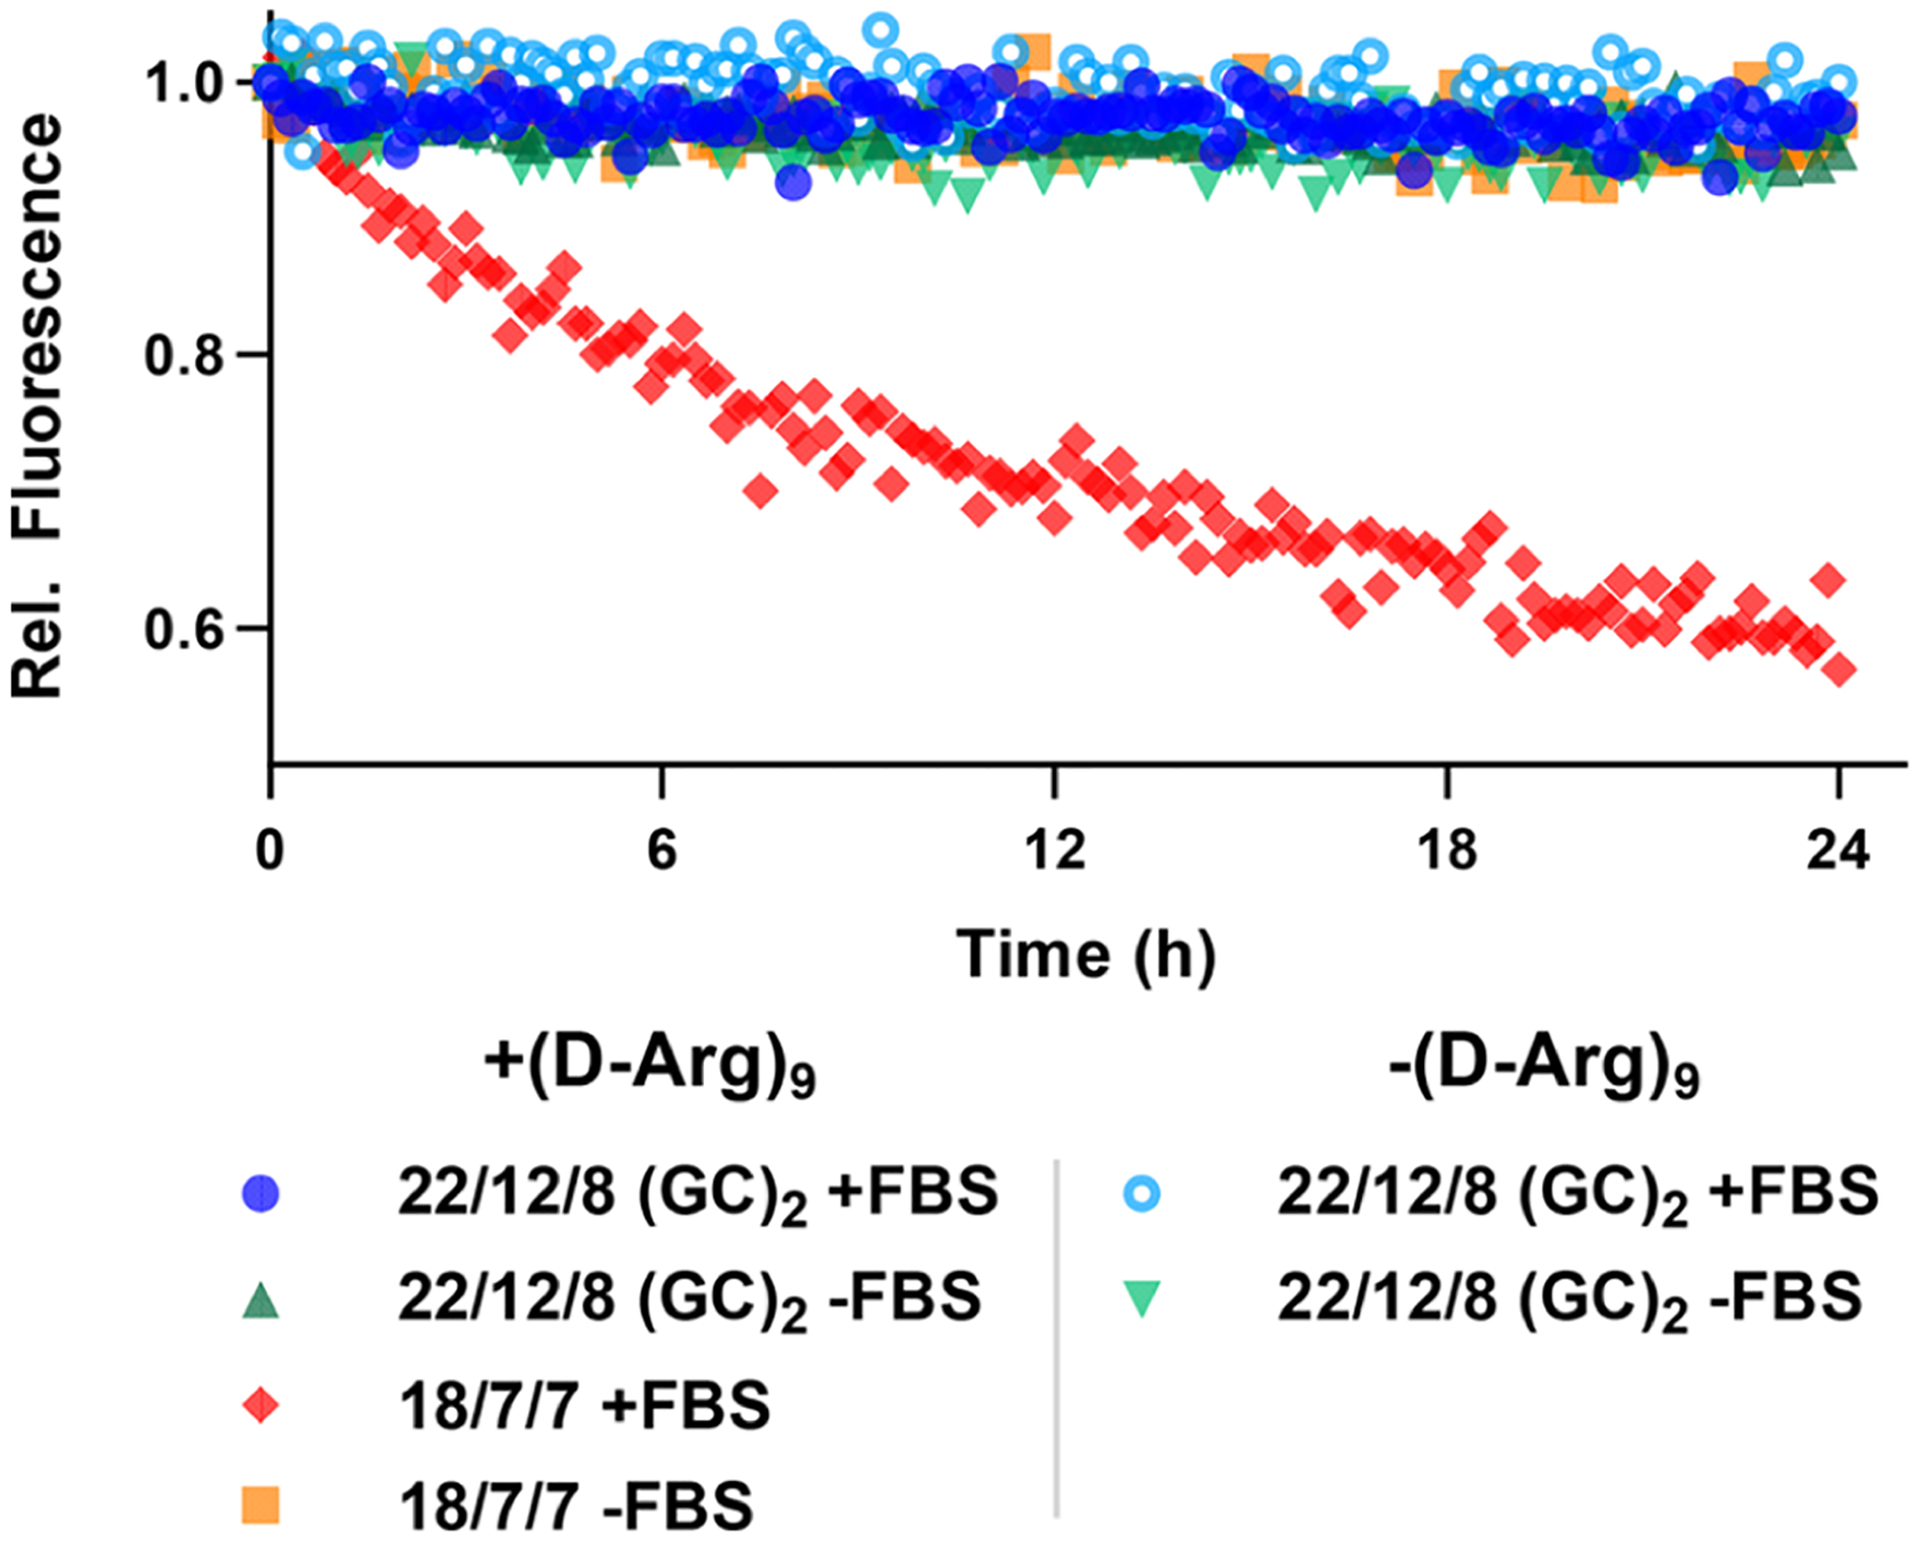
Cy3-Cy5 FRET fluorescence of 22/12/8 (GC)2 ± (d-Arg)9 and 18/7/7 + (d-Arg)9 TIVA probes in PBS incubated at 37 °C with and without 10% FBS.
In Vivo Delivery.
TIVA uptake studies were conducted on mouse brain slices, using TIVA-NT and TIVA-CPP, monitoring the intensity of the Cy3 signal (Figure S5). Fluorescence intensity in samples incubated with TIVA-NT was slightly increased in the first 10 min but remained flat in the next 80 min, while samples incubated with TIVA-CPP showed a continuous increase in Cy3 fluorescence and achieved much greater cytoplasmic delivery in the 90 min period. The comparison showed that CPP is necessary for efficient cellular delivery. Scavenger receptor (SR) has previously been reported to assist delivery of peptide-oligo conjugates35 and was also implicated in delivery of a nanoparticle-containing spherical nucleic acid.36 To investigate a possible role for SRs in the uptake of TIVA probe by mouse brain slice, 10 mM amiloride was loaded with TIVA probe to block scavenger receptors. In this experiment, Cy3 fluorescence in cells continued increasing to a high level over 60 min, suggesting that scavenger receptor is not a major pathway for TIVA delivery in the mouse brain slice. Studies of the molecular mechanism of TIVA probe cell uptake are ongoing.
Assessing Caging in Vitro.
To assess caging, we first measured the Cy3-Cy5 FRET efficiency of the probe pre- and postphotolysis (±hν) and in the absence or presence of 1 eq of a 30mer poly-A model target RNA (±poly-A) (Figure 4). Adding the second GC pair reduced the prephotolysis FRET of the new probe to 72% (Figure 4, group 1), which is slightly lower than those of previous TIVA probe designs: 82% for 22/9/9 GC and 87% for 18/7/7. A lower FRET signal may be caused by the GC base pairs favoring orientations of the Cy3-Cy5 fluorophore pair that contribute less dipolar coupling. It is also likely that the proximal G and C nucleotides contribute to fluorescence quenching of Cy3 and a lower FRET efficiency.37 Unlike previous TIVA probes, we observed no statistically significant change in FRET for 22/12/8 (GC)2 TIVA with the addition of 1 eq poly-A (72.2 ± 2.6% −poly-A → 73.6 ± 1.7% + poly-A). As a result of TIVA duplex stabilization, the probe was more dependent on the presence of poly-A RNA to displace the blocking strand postphotolysis, as evidenced by the relatively high postphotolysis FRET signal (44%) before poly-A RNA was added. With the 18/7/7 TIVA probe, a large decrease in FRET signal after activation was reported mostly upon the immediate photocleavage events. With this newer probe, a decrease in FRET signal may give some indication that the probe not only is photolyzed but also has bound to its mRNA target. Taken together, these results represent improvements in TIVA probe caging stability as well as the ability of the FRET pair to report on probe caging, uncaging, and target binding.
Figure 4.
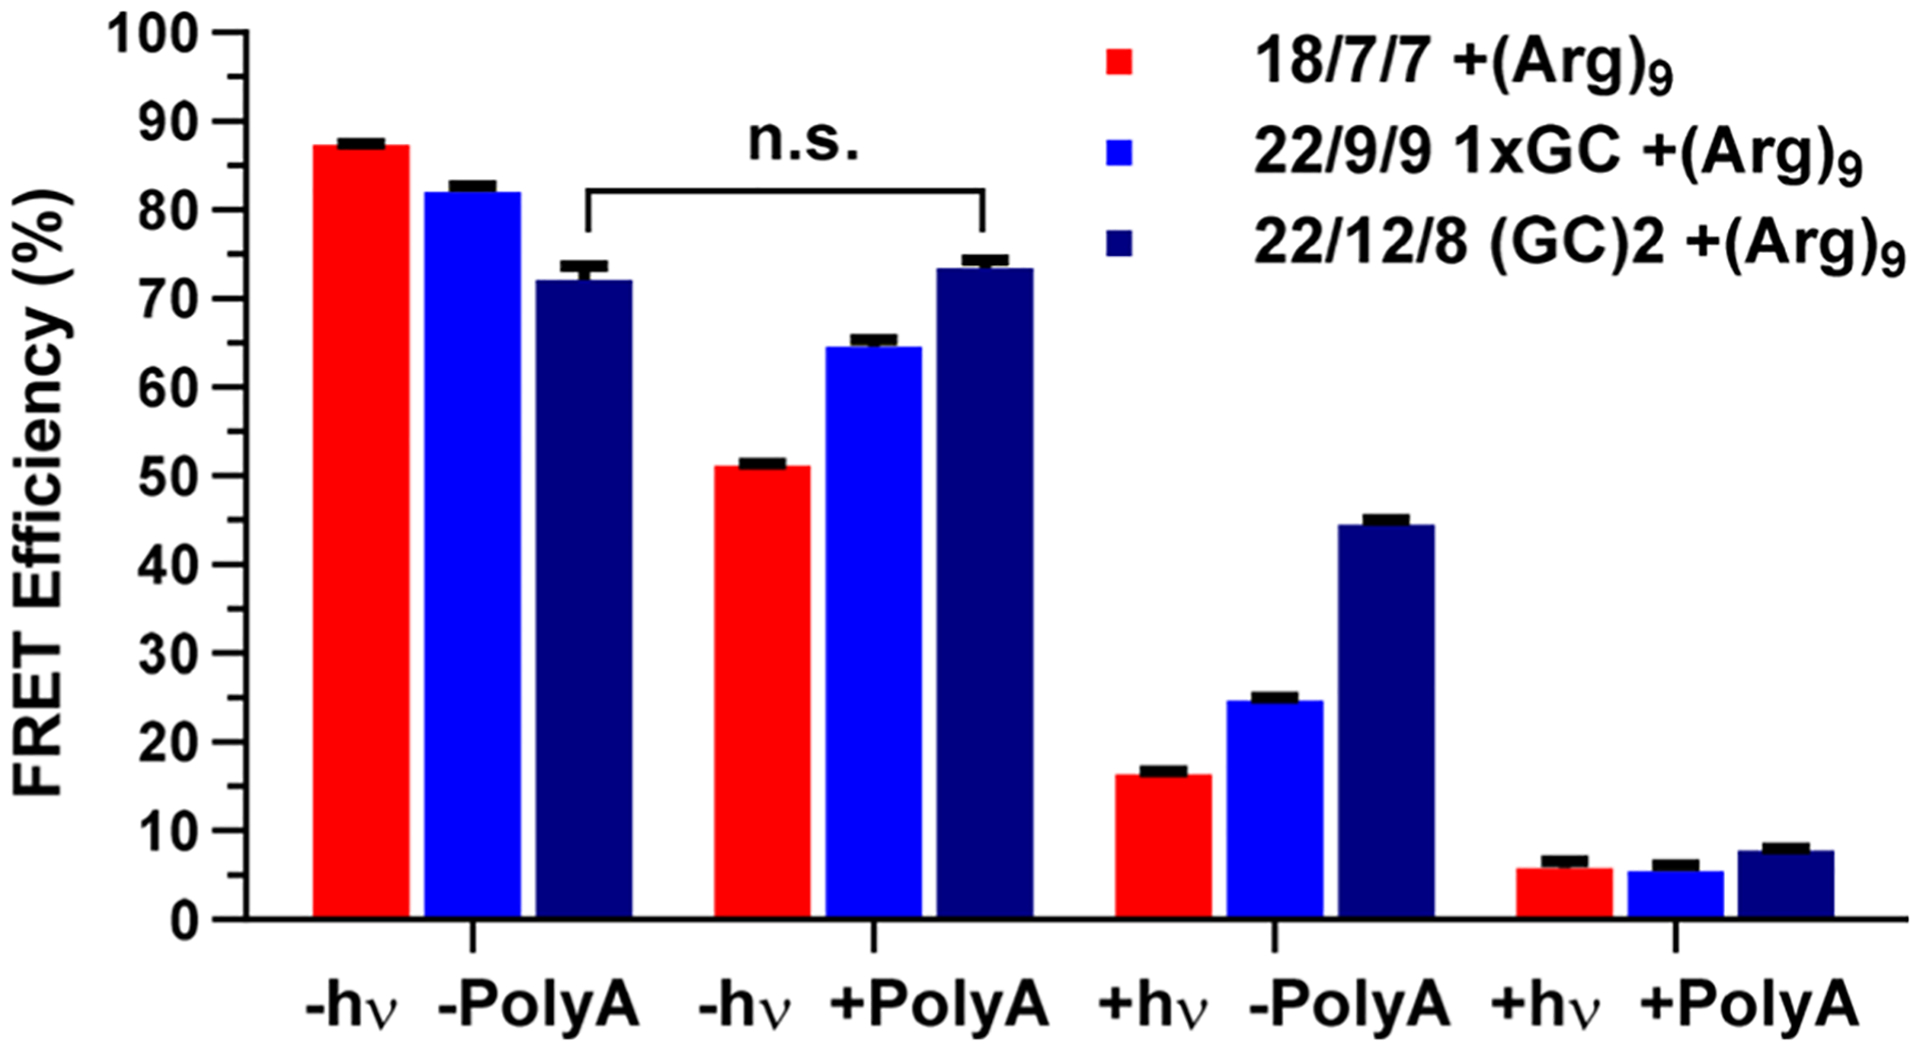
Cy3-Cy5 FRET efficiency comparison of three TIVA probes, with or without photolysis (±hν) and with or without 1 eq of 30mer 2′-OMe poly-A RNA (±poly-A).
As a second method of examining TIVA probe interaction with poly-A RNA, we assessed 18/7/7 and 22/12/8 (GC)2 TIVA probe comigration with poly-A RNA using native PAGE (Figure 5). Interestingly, control bands for both 18/7/7 and 22/12/8 (GC)2 probes displayed a Cy3-dominant leading edge and Cy5-dominant trailing edge (Figure 5a,b, lane 1). Although this would be most simply explained by the presence of a minor truncation or photolysis product, we did not observe obvious corresponding impurities by ESI-MS (Figures S2 and S3). Alternatively, the presence of the highly cationic (d-Arg)9 on the Cy5 terminus may bias the electrophoresis of that end relative to the more anionic Cy3 leading end. The 18/7/7 probe showed a smeared comigration in the presence of poly-A RNA (Figure 5a, lane 2), shifting its prephotolysis band closer to the postphotolysis position (Figure 5A, lane 4). Conversely, 22/12/8 (GC)2 showed no change in band shape or migration in the presence of poly-A RNA (Figure 5b, lane 2 vs lane 1). A faint Cy3 shadow can be observed at the leading edge of the prephotolysis bands for both probes, which is likely caused by the cationic (d-Arg)9 peptide delaying the electrophoretic migration of the probe’s Cy5-containing blocking strands. FRET measurement and gel migration are useful proxies for estimating the TIVA probe caging efficacy. To investigate the TIVA probe caging in a more biological context, we sought to measure how much RNA is captured by the intact and photolyzed probe in a pull-down experiment. Notably, fraying or misalignment of the duplex terminus could theoretically perturb the FRET signal without impacting caging, and the hybridization strength necessary for comigration on a gel may not reflect the hybridization strength needed for mRNA to remain annealed to the TIVA-Biotin/Streptavidin bead complex throughout the repeated washes of the pull-down procedure. Therefore, as a final in vitro control in buffer solution, we performed a pull-down assay using a purified polyadenylated GFP transcript as a model mRNA target (~1200 nt, Figure 6a). This experiment was performed on a sufficiently large scale to allow for direct analysis of any isolated mRNA by nano chip capillary electrophoresis without the need for amplification. In this way, we sought to measure the background signal caused by unwanted probe binding, without additional sources of background signal introduced by amplification. Gratifyingly, we found that 22/12/8 (GC)2 TIVA did not pull down a significant amount of mRNA prior to photolysis (Figure 6b) but did pull down mRNA matching the target length after photolysis (Figure 6c). A similar pull-down experiment was conducted with human fibroblast lysate. The concentration of mRNA was measured by a Qubit 2.0 fluorometer, showing a 12-fold increase with photoactivation (Figure S6). These findings corroborate the FRET (Figure 4) and PAGE (Figure 5) results, giving confidence that PAGE could be used in future experiments to assess caging without the need for a longer, more experimentally challenging RNA pull-down procedure.
Figure 5.
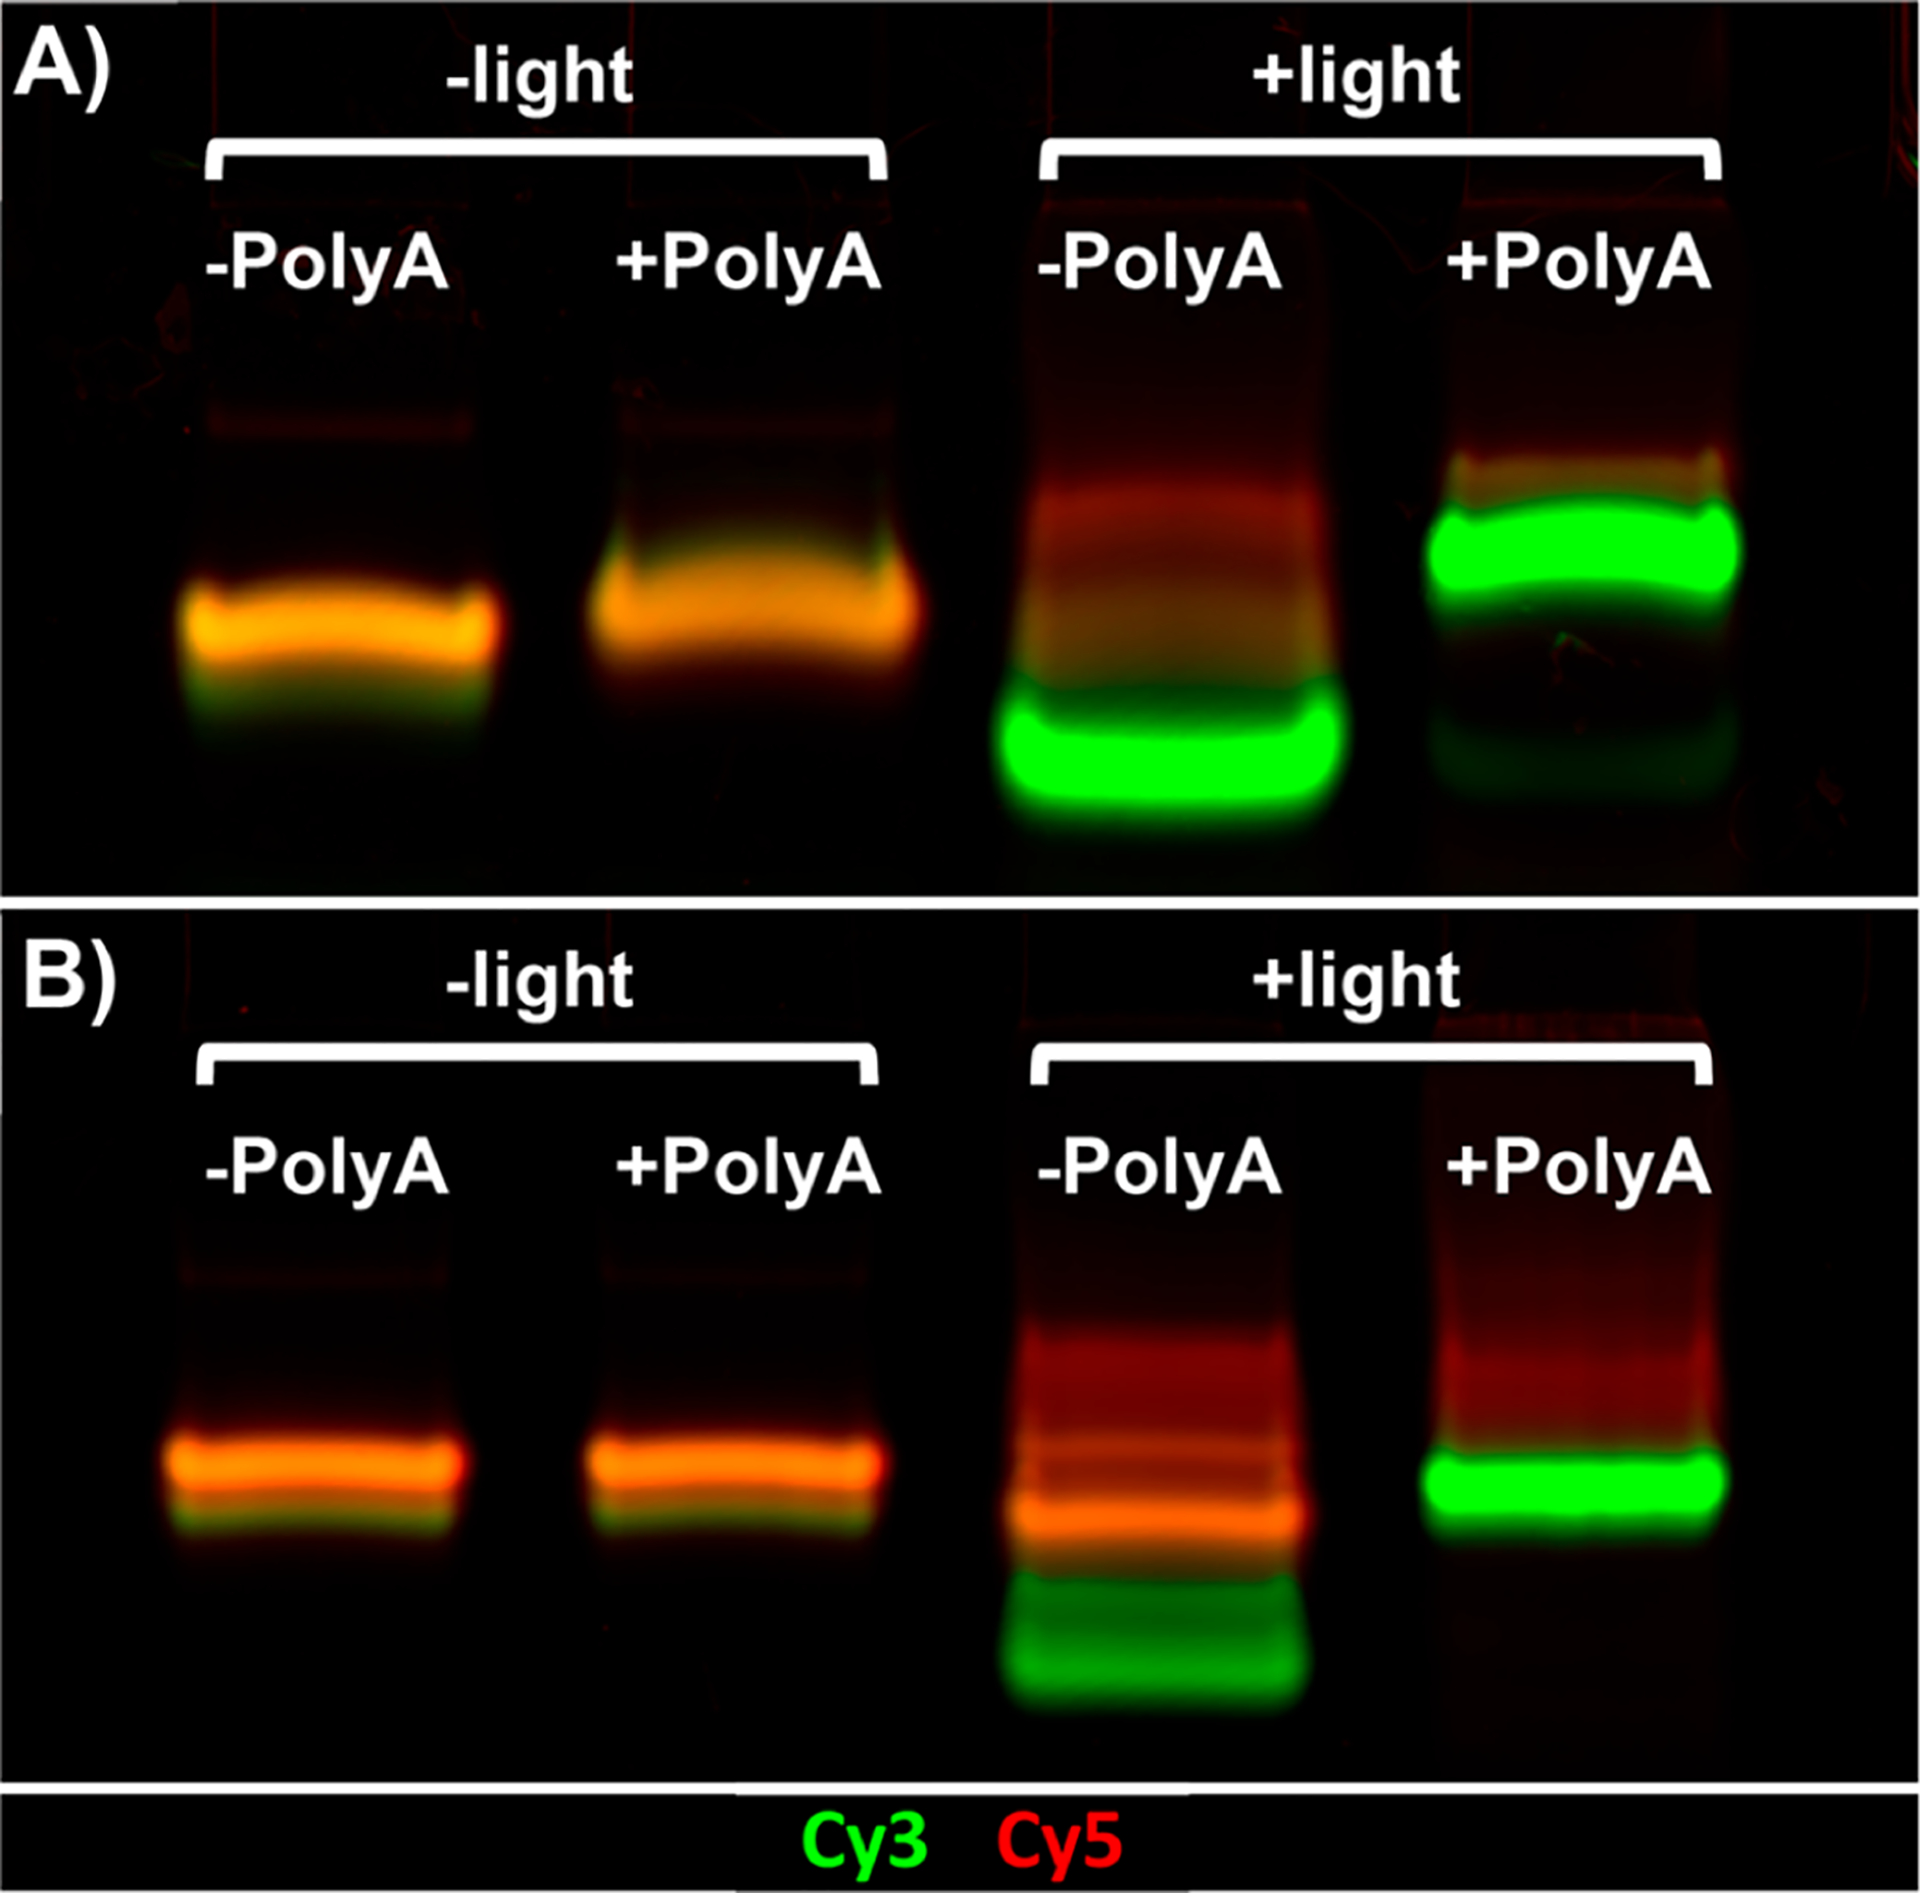
Native PAGE analysis of (A) 18/7/7 + (d-Arg)9 and (B) 22/12/8 (GC)2 TIVA + (d-Arg)9.
Figure 6.
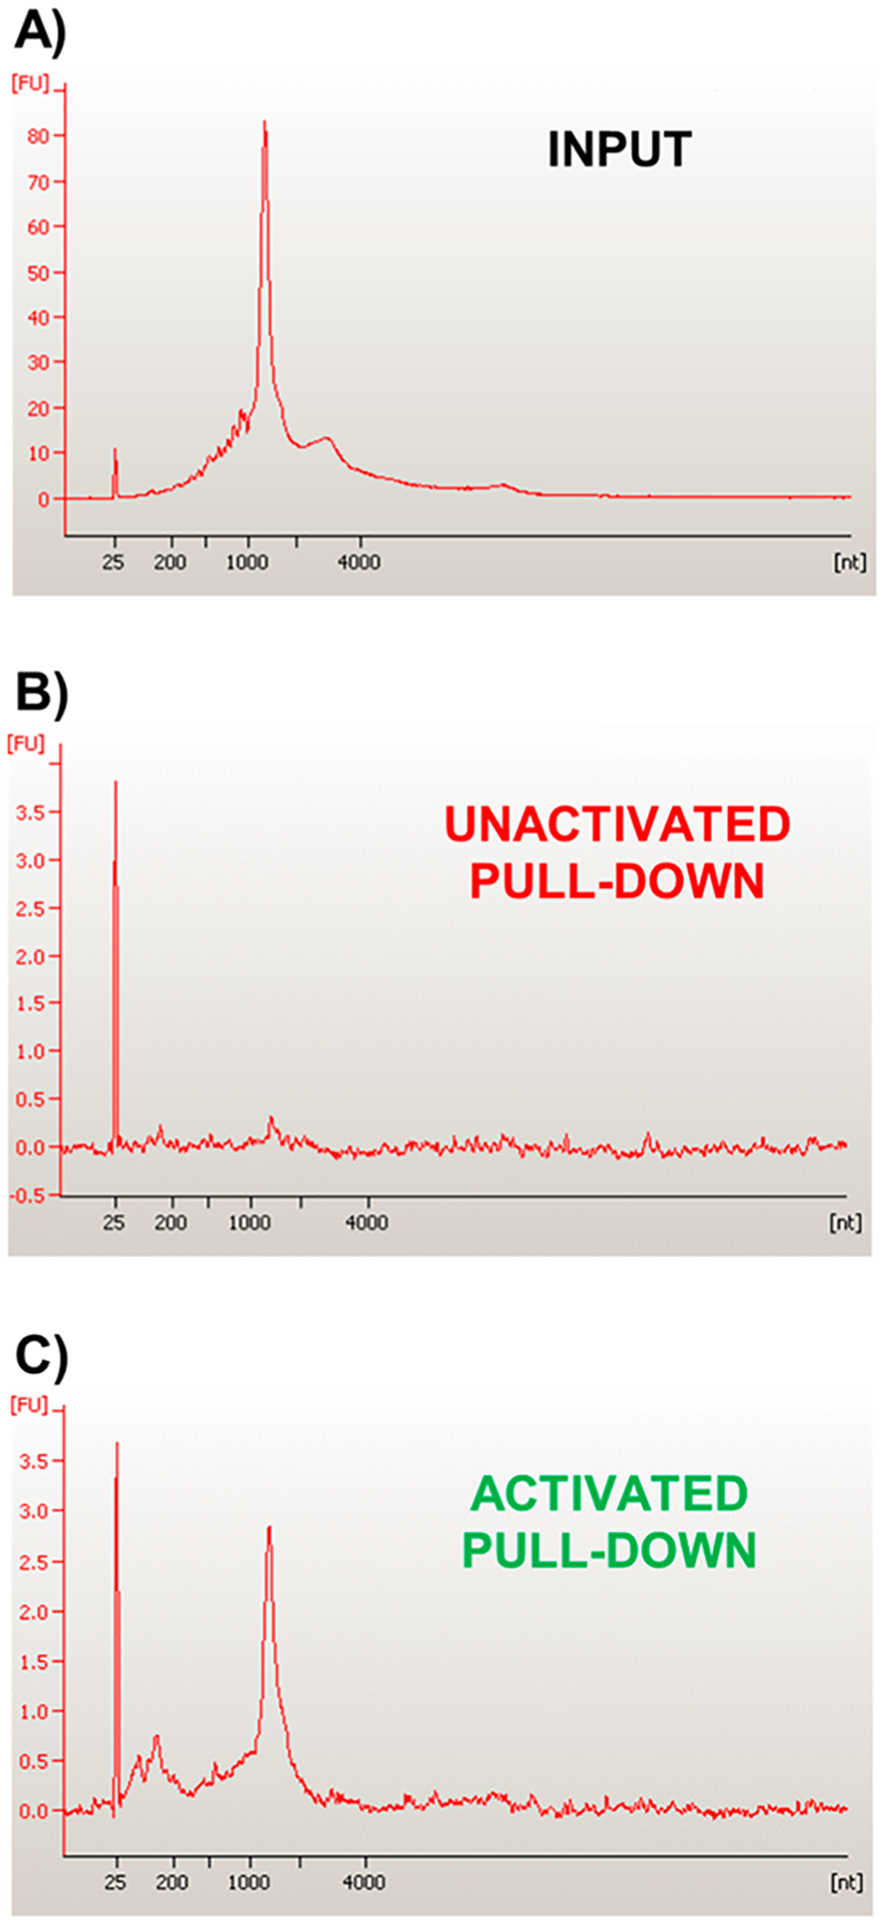
Nanochip capillary electrophoresis of 22/12/8 (GC)2 TIVA probe in the presence of a GFP-poly-A mRNA transcript. (A) Direct electrophoresis of GFP input transcript (~1200 nt). (B) Prephotolysis pull down of GFP transcript by 22/12/8 (GC)2 probe. (C) Postphotolysis pull down of GFP transcript by 22/12/8 (GC)2 probe.
Validating Caging and mRNA Capture in Vivo
TIVA analysis of single-cell mRNA populations is a multistep process that requires (1) preparation of tissue/cells for TIVA compound administration, (2) uptake of the TIVA compound into cells, (3) selection of cells of interest, (4) selected cell TIVA photoactivation, (5) TIVA/mRNA complex isolation, (6) mRNA removal from TIVA compound, (7) amplification of the isolated RNA, and (8) sequencing of RNA. Steps 1–4 are performed in vivo in live cells, while steps 5–8 are ex vivo. The methodology for isolation of the TIVA/mRNA complex, mRNA removal from the TIVA compound, and amplification of the RNA involve manipulation of small amounts in large volumes in microcentrifuge tubes. This requires a robust isolation procedure where contamination (such as bacterial contamination) and other cellular RNA contamination are minimized. There are various procedures that can be employed for these steps, but here, we used a minimal amount of streptavidin-coated, well-blocked magnetic beads (binding to the biotin on the TIVA/mRNA complex) with 4 °C incubations to limit the amount of background RNA/DNA bound to the beads while stabilizing the TIVA/mRNA hybrid to enable purification. Large amounts of magnetic beads will increase the amount of nonspecific background RNA contamination.
To verify that the robust caging observed in the previous in vitro assays translated to in vivo applications, we performed a simple TIVA experiment in freshly sectioned murine brain tissue incubated in artificial cerebrospinal fluid (aCSF). The 22/12/8 (GC)2 + (d-Arg)9 TIVA probe (3 μM) was incubated with brain slices for 90 min at rt. The photolysis was performed under a confocal microscope with a 405 nm laser on visually selected cells. After patch pipet aspiration, cells were lysed in a high-salt buffer and the lysate was incubated with streptavidin beads to isolate any mRNA biotinylated by TIVA probe. Isolated mRNA was then linearly amplified, and the resulting RNA pool was measured by Bioanalyzer Nanogel capillary electrophoresis. Control samples without TIVA exhibited negligible pull down (Figure 7b, top), with the minute amount of signal likely attributed to nonspecific hydrophobic interaction of short mRNA with streptavidin beads. Cells incubated with 3 μM TIVA showed an effective uptake, as evidenced by Cy3-Cy5 FRET labeling (Figure 7a). Isolation of labeled cells without photoactivation again resulted in negligible pull down, with a small amount of background likely from the beads themselves. Finally, cells loaded with TIVA probe exhibited a significant FRET shift prephotolysis (Figure 7a, top) to postphotolysis (Figure 7a, bottom), corresponding to activation and dissociation of the TIVA hairpin within the tissue. Activation of the target cell (red arrow) occurred with successive photolysis raster scans repeated until the Cy3 and Cy5 emission ratio plateaued. Bioanalyzer results for the activated cell exhibited the distinctive size-distribution curve typically observed in broad capture of the polyadenylated transcriptome. These results closely corroborate the in vitro assessments and show us that 22/12/8 (GC)2 is delivered into cells in resected brain tissue, remains inert until photoactivation, and then captures resident mRNA.
Figure 7.
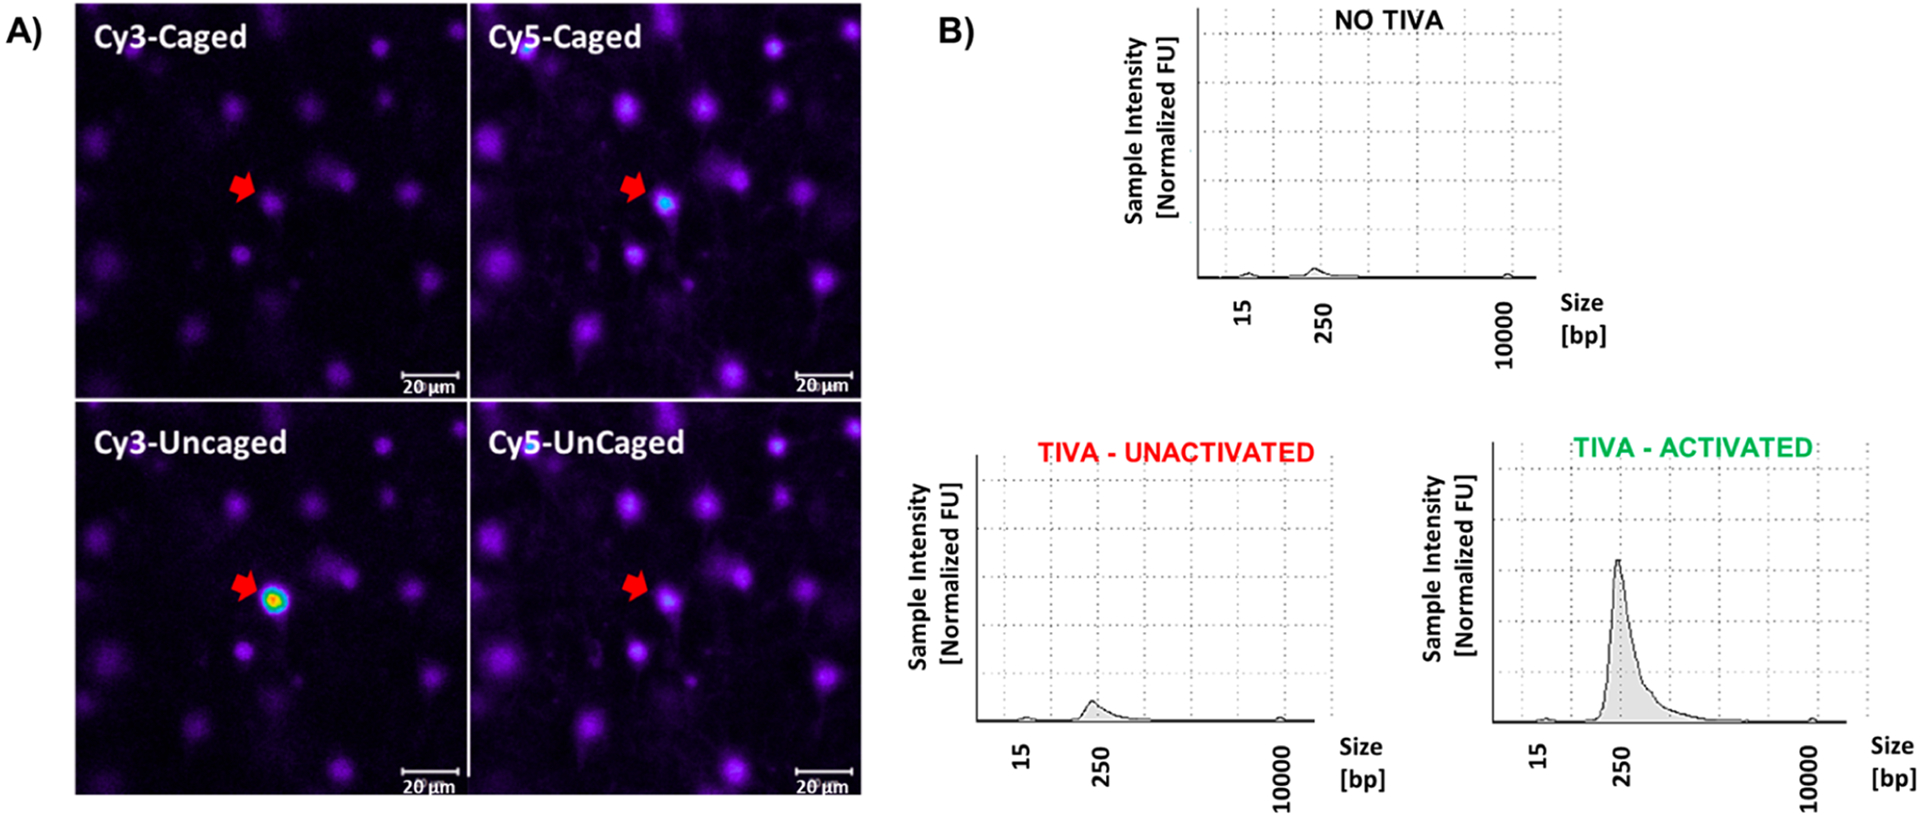
In situ live mouse brain single neuron transcriptome analysis. (A) Confocal micrographs of 22/12/8(GC)2 + (d-Arg)9 probe loaded brain cells in live mouse cortical brain section. Top panels show the labeled neurons as visualized by the Cy3 and Cy5 dyes on the probe. Upon activation (bottom panels), the Cy3 signal increases and Cy5 signal decreases, consistent with loss of the FRET signal. The TIVA/RNA hybrids in the cell highlighted by the red arrow were isolated and sequenced. The calibration bar = 20 μm. (B) Bioanalyzer traces of RNA made from controls and RNA isolated using 22/12/8 (GC)2 TIVA from three representative cell samples: top trace, single cell that had no TIVA loaded; bottom-left trace, a cell where TIVA was loaded but was not activated; and bottom-right trace, a cell in which the TIVA probe was photoactivated. The individual mouse cells were pipet isolated, and the material was processed through the TIVA/RNA isolation procedure regardless of TIVA being present or absent.
Upon sequencing of individual 22/12/8 (GC)2 TIVA-queried single cells we found that, on average, 29% of the reads mapped to mRNA exons, while the controls gave significantly lower percentages, including RNA isolated from cells where the TIVA probe was not activated (average of 8% exons) and no TIVA probe (average 7.5% exons). After normalization using counts-per-million so that the libraries were normalized to their individual read depths, we then averaged samples for each group and subtracted the background reads from the experimental data. There was ~6 times more bacterial contamination of the no-TIVA probe control because there was no TIVA-isolated RNA to amplify from the sample so the bacterial sequences were at a higher percentage of the final product. There were 1879 differentially expressed mRNAs in individual cortical neurons relative to nonphotoactivated TIVA controls, with a greater than 10 read count difference. Among the most highly differentially expressed mRNAs were SNAP25 (1423 read difference), CALM2 (832 read difference), MAP2 (218 read difference), and many others confirming that the selected cells were mouse neurons. There were no canonical glial markers (GFAP, aquaporin) showing that there was little glial contamination of the in vivo TIVA-isolated RNA samples. These data show that the 22/12/8 (GC)2 + (d-Arg)9 TIVA probe can enter cells, be identified, undergo photouncaging, and capture mRNA from a specified cell.
In conclusion, we have introduced a new design of TIVA probe, 22/12/8 (GC)2 + (d-Arg)9, with robust caging stability. The ESI-MS-confirmed probe demonstrated improved nuclease-resistance relative to the original 18/7/7 probe. Furthermore, performance in FRET efficiency and native gel comigration assays indicated that the lengthened hairpin, terminal GC pair, and added TEG spacer minimized prephotolysis interactions with mRNA. We subsequently applied the TIVA probe 22/12/8 (GC)2 + (d-Arg)9 in live brain slices with an optimized downstream isolation and processing protocol. High reads compared to the controls and the expression of cell-specific markers demonstrated that this optimized TIVA probe was effective for extracting mRNA from selected single cells.
We also note that the rapid and efficient probe uptake observed in brain slices is an especially attractive feature. The fact that this uptake is significantly more efficient in live brain slices than in many other cell types tested (data not shown) raises the exciting possibility of designing probes that can selectively target the brain for diagnostic and/or therapeutic applications. Having used DLS in this study to identify the very anionic nature of the CPP-conjugated TIVA probe, more work is underway to elucidate structural features of the probe that are critical for molecular interactions with proteins in the extracellular space and/or at the cell surface to mediate probe uptake.
Supplementary Material
ACKNOWLEDGMENTS
The authors would like to thank the UPenn Chemistry Biological Chemistry Resource Center for access to instrumentation used in this study. The authors would also like to thank J. Wang for performing the TIVA-RNA amplifications for RNAseq analysis.
Funding
This project was supported by National Institute of General Medical Sciences, R01 GM-083030 to I.J.D. and J.H.E. and R35 GM-131907 to I.J.D.
Footnotes
Supporting Information
The Supporting Information is available free of charge at https://pubs.acs.org/doi/10.1021/acschembio.0c00499.
Figures of HPLC traces, ESI-MS spectra, abs vs temperature plot, AX- and RP-HPLC purification, DLS characterization, ζ potential, time course fluorescence intensity, uptake of TIVA-CPP, and RNA concentration and discussions of methods used (PDF)
The authors declare no competing financial interest.
Complete contact information is available at: https://pubs.acs.org/10.1021/acschembio.0c00499
Contributor Information
Sean B. Yeldell, Department of Chemistry, University of Pennsylvania, Philadelphia, Pennsylvania 19104-6323, United States
Linlin Yang, Department of Chemistry, University of Pennsylvania, Philadelphia, Pennsylvania 19104-6323, United States.
Jaehee Lee, Department of Pharmacology, University of Pennsylvania, Philadelphia, Pennsylvania 19104-6084, United States.
James H. Eberwine, Department of Pharmacology, University of Pennsylvania, Philadelphia, Pennsylvania 19104-6084, United States
Ivan J. Dmochowski, Department of Chemistry, University of Pennsylvania, Philadelphia, Pennsylvania 19104-6323, United States;.
REFERENCES
- (1).Macosko EZ, Basu A, Satija R, Nemesh J, Shekhar K, Goldman M, Tirosh I, Bialas AR, Kamitaki N, Martersteck EM, Trombetta JJ, Weitz DA, Sanes JR, Shalek AK, Regev A, and McCarroll SA (2015) Highly Parallel Genome-wide Expression Profiling of Individual Cells Using Nanoliter Droplets. Cell 161 (5), 1202–1214. [DOI] [PMC free article] [PubMed] [Google Scholar]
- (2).Habib N, Avraham-Davidi I, Basu A, Burks T, Shekhar K, Hofree M, Choudhury SR, Aguet F, Gelfand E, Ardlie K, Weitz DA, Rozenblatt-Rosen O, Zhang F, and Regev A (2017) Massively parallel single-nucleus RNA-seq with DroNc-seq. Nat. Methods 14 (10), 955–958. [DOI] [PMC free article] [PubMed] [Google Scholar]
- (3).Chang JC, Wooten EC, Tsimelzon A, Hilsenbeck SG, Gutierrez MC, Elledge R, Mohsin S, Osborne CK, Chamness GC, Allred DC, and O’Connell P (2003) Gene expression profiling for the prediction of therapeutic response to docetaxel in patients with breast cancer. Lancet 362 (9381), 362–9. [DOI] [PubMed] [Google Scholar]
- (4).Costello JC, Heiser LM, Georgii E, Gonen M, Menden MP, Wang NJ, Bansal M, Ammad-ud-din M, Hintsanen P, Khan SA, Mpindi J-P, Kallioniemi O, Honkela A, Aittokallio T, Wennerberg K, Collins JJ, Gallahan D, Singer D, SaezRodriguez J, Kaski S, Gray JW, and Stolovitzky G (2014) A community effort to assess and improve drug sensitivity prediction algorithms. Nat. Biotechnol 32 (12), 1202–1212. [DOI] [PMC free article] [PubMed] [Google Scholar]
- (5).Lamb J, Crawford ED, Peck D, Modell JW, Blat IC, Wrobel MJ, Lerner J, Brunet JP, Subramanian A, Ross KN, Reich M, Hieronymus H, Wei G, Armstrong SA, Haggarty SJ, Clemons PA, Wei R, Carr SA, Lander ES, and Golub TR (2006) The Connectivity Map: using gene-expression signatures to connect small molecules, genes, and disease. Science 313 (5795), 1929–35. [DOI] [PubMed] [Google Scholar]
- (6).Staunton JE, Slonim DK, Coller HA, Tamayo P, Angelo MJ, Park J, Scherf U, Lee JK, Reinhold WO, Weinstein JN, Mesirov JP, Lander ES, and Golub TR (2001) Chemosensitivity prediction by transcriptional profiling. Proc. Natl. Acad. Sci. U. S. A 98 (19), 10787–92. [DOI] [PMC free article] [PubMed] [Google Scholar]
- (7).Oberg JA, Glade Bender JL, Sulis ML, Pendrick D, Sireci AN, Hsiao SJ, Turk AT, Dela Cruz FS, Hibshoosh H, Remotti H, Zylber RJ, Pang J, Diolaiti D, Koval C, Andrews SJ, Garvin JH, Yamashiro DJ, Chung WK, Emerson SG, Nagy PL, Mansukhani MM, and Kung AL (2016) Implementation of next generation sequencing into pediatric hematology-oncology practice: moving beyond actionable alterations. Genome Med. 8 (1), 133. [DOI] [PMC free article] [PubMed] [Google Scholar]
- (8).Hashimshony T, Senderovich N, Avital G, Klochendler A, de Leeuw Y, Anavy L, Gennert D, Li S, Livak KJ, Rozenblatt-Rosen O, Dor Y, Regev A, and Yanai I (2016) CEL-Seq2: sensitive highly-multiplexed single-cell RNA-Seq. Genome Biol. 17 (1), 77. [DOI] [PMC free article] [PubMed] [Google Scholar]
- (9).Zilionis R, Nainys J, Veres A, Savova V, Zemmour D, Klein AM, and Mazutis L (2017) Single-cell barcoding and sequencing using droplet microfluidics. Nat. Protoc 12 (1), 44–73. [DOI] [PubMed] [Google Scholar]
- (10).Uzbas F, Opperer F, Sonmezer C, Shaposhnikov D, Sass S, Krendl C, Angerer P, Theis FJ, Mueller NS, and Drukker M (2019) BART-Seq: cost-effective massively parallelized targeted sequencing for genomics, transcriptomics, and single-cell analysis. Genome Biol. 20 (1), 155. [DOI] [PMC free article] [PubMed] [Google Scholar]
- (11).Rodriguez-Meira A, Buck G, Clark SA, Povinelli BJ, Alcolea V, Louka E, McGowan S, Hamblin A, Sousos N, Barkas N, Giustacchini A, Psaila B, Jacobsen SEW, Thongjuea S, and Mead AJ (2019) Unravelling Intratumoral Heterogeneity through High-Sensitivity Single-Cell Mutational Analysis and Parallel RNA Sequencing. Mol. Cell 73 (6), 1292–1305. [DOI] [PMC free article] [PubMed] [Google Scholar]
- (12).Alles J, Karaiskos N, Praktiknjo SD, Grosswendt S, Wahle P, Ruffault PL, Ayoub S, Schreyer L, Boltengagen A, Birchmeier C, Zinzen R, Kocks C, and Rajewsky N (2017) Cell fixation and preservation for droplet-based single-cell transcriptomics. BMC Biol. 15 (1), 44. [DOI] [PMC free article] [PubMed] [Google Scholar]
- (13).Wu H, Kirita Y, Donnelly EL, and Humphreys BD (2019) Advantages of Single-Nucleus over Single-Cell RNA Sequencing of Adult Kidney: Rare Cell Types and Novel Cell States Revealed in Fibrosis. J. Am. Soc. Nephrol 30 (1), 23–32. [DOI] [PMC free article] [PubMed] [Google Scholar]
- (14).Adam M, Potter AS, and Potter SS (2017) Psychrophilic proteases dramatically reduce single-cell RNA-seq artifacts: a molecular atlas of kidney development. Development 144 (19), 3625–3632. [DOI] [PMC free article] [PubMed] [Google Scholar]
- (15).Moffitt JR, Hao J, Wang G, Chen KH, Babcock HP, and Zhuang X (2016) High-throughput single-cell gene-expression profiling with multiplexed error-robust fluorescence in situ hybridization. Proc. Natl. Acad. Sci. U. S. A 113 (39), 11046–51. [DOI] [PMC free article] [PubMed] [Google Scholar]
- (16).Lee JH, Daugharthy ER, Scheiman J, Kalhor R, Ferrante TC, Terry R, Turczyk BM, Yang JL, Lee HS, Aach J, Zhang K, and Church GM (2015) Fluorescent in situ sequencing (FISSEQ) of RNA for gene expression profiling in intact cells and tissues. Nat. Protoc 10 (3), 442–58. [DOI] [PMC free article] [PubMed] [Google Scholar]
- (17).Xia C, Fan J, Emanuel G, Hao J, and Zhuang X (2019) Spatial transcriptome profiling by MERFISH reveals subcellular RNA compartmentalization and cell cycle-dependent gene expression. Proc. Natl. Acad. Sci. U. S. A 116 (39), 19490–19499. [DOI] [PMC free article] [PubMed] [Google Scholar]
- (18).Eng CL, Lawson M, Zhu Q, Dries R, Koulena N, Takei Y, Yun J, Cronin C, Karp C, Yuan GC, and Cai L (2019) Transcriptome-scale super-resolved imaging in tissues by RNA seqFISH. Nature 568 (7751), 235–239. [DOI] [PMC free article] [PubMed] [Google Scholar]
- (19).Oomoto I, Suzuki-Hirano A, Umeshima H, Han YW, Yanagisawa H, Carlton P, Harada Y, Kengaku M, Okamoto A, Shimogori T, and Wang DO (2015) ECHO-liveFISH: in vivo RNA labeling reveals dynamic regulation of nuclear RNA foci in living tissues. Nucleic Acids Res. 43 (19), e126. [DOI] [PMC free article] [PubMed] [Google Scholar]
- (20).Batani G, Bayer K, Boge J, Hentschel U, and Thomas T (2019) Fluorescence in situ hybridization (FISH) and cell sorting of living bacteria. Sci. Rep 9 (1), 18618. [DOI] [PMC free article] [PubMed] [Google Scholar]
- (21).Ebrahimi SB, Samanta D, and Mirkin CA (2020) DNA-Based Nanostructures for Live-Cell Analysis. J. Am. Chem. Soc 142 (26), 11343–11356. [DOI] [PubMed] [Google Scholar]
- (22).Briley WE, Bondy MH, Randeria PS, Dupper TJ, and Mirkin CA (2015) Quantification and real-time tracking of RNA in live cells using Sticky-flares. Proc. Natl. Acad. Sci. U. S. A 112 (31), 9591–5. [DOI] [PMC free article] [PubMed] [Google Scholar]
- (23).Qiu L, Wu C, You M, Han D, Chen T, Zhu G, Jiang J, Yu R, and Tan W (2013) A targeted, self-delivered, and photocontrolled molecular beacon for mRNA detection in living cells. J. Am. Chem. Soc 135 (35), 12952–5. [DOI] [PMC free article] [PubMed] [Google Scholar]
- (24).Wang S, Karikomi M, MacLean AL, and Nie Q (2019) Cell lineage and communication network inference via optimization for single-cell transcriptomics. Nucleic Acids Res. 47 (11), e66. [DOI] [PMC free article] [PubMed] [Google Scholar]
- (25).See P, Dutertre CA, Chen J, Gunther P, McGovern N, Irac SE, Gunawan M, Beyer M, Handler K, Duan K, Sumatoh HRB, Ruffin N, Jouve M, Gea-Mallorqui E, Hennekam RCM, Lim T, Yip CC, Wen M, Malleret B, Low I, Shadan NB, Fen CFS, Tay A, Lum J, Zolezzi F, Larbi A, Poidinger M, Chan JKY, Chen Q, Renia L, Haniffa M, Benaroch P, Schlitzer A, Schultze JL, Newell EW, and Ginhoux F (2017) Mapping the human DC lineage through the integration of high-dimensional techniques. Science 356 (6342), eaag3009. [DOI] [PMC free article] [PubMed] [Google Scholar]
- (26).Wang Z, and Zhu J (2017) MEMOIR: A Novel System for Neural Lineage Tracing. Neurosci. Bull 33 (6), 763–765. [DOI] [PMC free article] [PubMed] [Google Scholar]
- (27).Zafar H, Lin C, and Bar-Joseph Z (2020) Single-cell lineage tracing by integrating CRISPR-Cas9 mutations with transcriptomic data. Nat. Commun 11 (1), 3055. [DOI] [PMC free article] [PubMed] [Google Scholar]
- (28).Lovatt D, Ruble BK, Lee J, Dueck H, Kim TK, Fisher S, Francis C, Spaethling JM, Wolf JA, Grady MS, Ulyanova AV, Yeldell SB, Griepenburg JC, Buckley PT, Kim J, Sul JY, Dmochowski IJ, and Eberwine J (2014) Transcriptome in vivo analysis (TIVA) of spatially defined single cells in live tissue. Nat. Methods 11 (2), 190–6. [DOI] [PMC free article] [PubMed] [Google Scholar]
- (29).Yeldell SB, Ruble BK, and Dmochowski IJ (2017) Oligonucleotide modifications enhance probe stability for single cell transcriptome in vivo analysis (TIVA). Org. Biomol. Chem 15 (47), 10001–10009. [DOI] [PMC free article] [PubMed] [Google Scholar]
- (30).Brodin JD, Sprangers AJ, McMillan JR, and Mirkin CA (2015) DNA-Mediated Cellular Delivery of Functional Enzymes. J. Am. Chem. Soc 137 (47), 14838–41. [DOI] [PMC free article] [PubMed] [Google Scholar]
- (31).Cutler JI, Auyeung E, and Mirkin CA (2012) Spherical nucleic acids. J. Am. Chem. Soc 134 (3), 1376–91. [DOI] [PubMed] [Google Scholar]
- (32).Hu X, Ke G, Liu L, Fu X, Kong G, Xiong M, Chen M, and Zhang XB (2019) Valency-Controlled Molecular Spherical Nucleic Acids with Tunable Biosensing Performances. Anal. Chem 91 (17), 11374–11379. [DOI] [PubMed] [Google Scholar]
- (33).Li H, Zhang B, Lu X, Tan X, Jia F, Xiao Y, Cheng Z, Li Y, Silva DO, Schrekker HS, Zhang K, and Mirkin CA (2018) Molecular spherical nucleic acids. Proc. Natl. Acad. Sci. U. S. A 115 (17), 4340–4344. [DOI] [PMC free article] [PubMed] [Google Scholar]
- (34).Law M, Jafari M, and Chen P (2008) Physicochemical characterization of siRNA-peptide complexes. Biotechnol. Prog 24 (4), 957–63. [DOI] [PubMed] [Google Scholar]
- (35).Lindberg S, Munoz-Alarcon A, Helmfors H, Mosqueira D, Gyllborg D, Tudoran O, and Langel U (2013) PepFect15, a novel endosomolytic cell-penetrating peptide for oligonucleotide delivery via scavenger receptors. Int. J. Pharm 441 (1–2), 242–7. [DOI] [PubMed] [Google Scholar]
- (36).Choi CH, Hao L, Narayan SP, Auyeung E, and Mirkin CA (2013) Mechanism for the endocytosis of spherical nucleic acid nanoparticle conjugates. Proc. Natl. Acad. Sci. U. S. A 110 (19), 7625–30. [DOI] [PMC free article] [PubMed] [Google Scholar]
- (37).Mao H, Luo G, Zhan Y, Zhang J, Yao S, and Yu Y (2018) The mechanism and regularity of quenching the effect of bases on fluorophores: the base-quenched probe method. Analyst 143 (14), 3292–3301. [DOI] [PubMed] [Google Scholar]
Associated Data
This section collects any data citations, data availability statements, or supplementary materials included in this article.