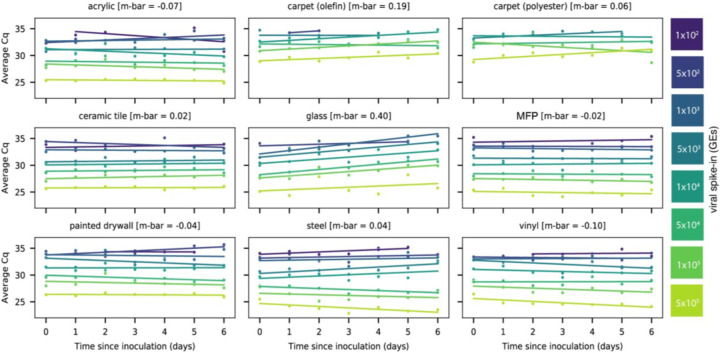
Figure 1:
Scatterplots showing the average Cq of RT-qPCR viral gene calls for corresponding heat-inactivated viral spike-in over seven days. Viral spike-in concentrations reported as GE’s from ddPCR. Linear regressions of average Cq on days since inoculation per spike-in were overlaid on the measured data. Average decay slope (m-bar) reported alongside each surface type.

