

Abstract
Hypertrophic cardiomyopathy (HCM) is a genetic heart disease that is the leading cause of sudden cardiac death (SCD) in young adults. Despite the well-known risk factors and existing clinical practice guidelines, HCM patients are underdiagnosed and sub-optimally managed. Developing machine learning models on electronic health record (EHR) data can help in better diagnosis of HCM and thus improve hundreds of patient lives. Automated phenotyping using HCM billing codes has received limited attention in the literature with a small number of prior publications. In this paper, we propose a novel predictive model that helps physicians in making diagnostic decisions, by means of information learned from historical data of similar patients.
We assembled a cohort of 11,562 patients with known or suspected HCM who have visited Mayo Clinic between the years 1995 to 2019. All existing billing codes of these patients were extracted from the EHR data warehouse. Target ground truth labeling for training the machine learning model was provided by confirmed HCM diagnosis using the gold standard imaging tests for HCM diagnosis echocardiography (echo), or cardiac magnetic resonance (CMR) imaging. As the result, patients were labeled into three categories of “yes definite HCM”, “no HCM phenotype”, and “possible HCM” after a manual review of medical records and imaging tests.
In this study, a random forest was adopted to investigate the predictive performance of billing codes for the identification of HCM patients due to its practical application and expected accuracy in a wide range of use cases. Our model performed well in finding patients with “yes definite”, “possible” and “no” HCM with an accuracy of 71%, weighted recall of 70%, the precision of 75%, and weighted F1 score of 72%. Furthermore, we provided visualizations based on multidimensional scaling and the principal component analysis to provide insights for clinicians’ interpretation. This model can be used for the identification of HCM patients using their EHR data, and help clinicians in their diagnosis decision making.
Keywords: hypertrophic cardiomyopathy (HCM), billing code, machine learning, electronic health records (EHR), diagnostic codes, random forest, decision making, classification
Introduction
Hypertrophic cardiomyopathy (HCM) is the most common monogenetic heart disease, a leading cause of sudden death in young patients all over the world, and affects individuals in all age groups. [2, 3] HCM patients have increased thickness of the left ventricular heart wall. [4]
Population studies have shown the prevalence of HCM in the range of 0.02–0.5% in adults. However, accurate HCM diagnosis is still a challenge and may be delayed as the majority of HCM patients are asymptomatic [2, 4]. It is estimated that in the US, 750,000 individuals are affected by HCM but only 100,000 (13%) patients are diagnosed using noninvasive cardiac imaging modalities including echo and CMR. [5] In other words, patients are frequently identified only incidentally while a subset of HCM patients is at high risk for sudden cardiac death which may be the initial manifestation of the disease. [6] Current approaches for risk stratification of HCM often misclassify risk. This motivates the need to accurately identify HCM cases by means of related historical data available in the EHR.
Analyzing EHR repositories to conduct additional studies on HCM cohorts will save lives by elaborating on other means of finding patients at risk for HCM. [2] There have been studies in the identification of HCM patient cohorts using EHR-based billing code algorithms. [7, 8] The existing HCM billing code algorithms have limited performance due to a high proportion of false positives. A prior observational study showed that one-third of HCM positive patients (identified by at least one ICD-10 diagnostic billing code) were misclassified due to mimics of HCM diagnosis including hypertensive cardiomyopathy, and aortic stenosis [8]. HCM mimics are conditions that also manifest with increased thickness of the heart walls and billing codes for HCM may be assigned during the medical investigation before establishing the reason for the increased thickness of the heart muscle. We hypothesize that a well-defined machine learning model can utilize historical information on the similarity of billing code and HCM comorbidities, and help in the early identification of HCM patients.
Machine learning approaches facilitate efficient and accurate phenotyping of HCM patients using EHR data whereas the traditional approaches to manually review the medical records and clinical registries were time-consuming and subject to human errors. [9] Additionally, instead of relying only on a single performance metric such as the accuracy, we elaborated on providing reasonable insights and visualization of the results to help physicians in better interpretation of the problems. [10] Magnusson, et al. [8] by focusing on the misdiagnosis of one-third of HCM patients, emphasizes that the correct diagnosis is important for both individual decision-making and research purposes. Fan, et al. [9] have described an approach for using an EHR-based billing code algorithm for cohort identification for another cardiovascular disease named peripheral artery disease. This methodology combined various diagnostic and procedural codes for cohort identification in a logistic regression model, using traditional statistical methodologies. Bhattacharya, et al. [11] have used patients’ clinical attributes as an input to their ensemble classifier of logistic regression and naive Bayes to identify HCM patients with ventricular arrhythmias that lead to SCD. Their cohort consists of only 711 patients with a clinical diagnosis of HCM and billing codes were not used as variables of their model.
In this paper, a billing code-based model over 24-year HCM-EHR data at Mayo Clinic Rochester, Minnesota is developed and validated. We propose to combine various billing codes for reliable identification of HCM cases from EHR data. We expand the billing code categories from i) disease-specific diagnostic codes, ii) associated symptoms and iii) therapeutic strategies endorsed by HCM clinical practice guidelines. The random forest model for HCM cohort identification is proposed followed by different visualization of the model results. Multidimensional scaling and principal component analysis provide insights for clinicians interpreting the model. The last section provides our discussions on the utilization of this approach for a decision support system in the medical environments.
Material And Methods
A. Data and Design of Study
In the current study, we used structured data from an EHR-based HCM cohort of 11,562 patients with a median age of 66 years (25th% = 53 years; 75th% = 77 years; women 44.3%) with at least one diagnostic billing code for HCM from 1995 to March 2019. The study was approved by the institutional review board of the Mayo Clinic. Six percent of the patients refused authorization and their medical records were excluded from this study (n=742). Billing codes used were ICD 10th revision (ICD-10) I42.1 and I42.2, and 9th revision (ICD-9) 425.11 and 425.18. Mayo Clinic also has a dedicated HCM Registry; 1,820 patients enrolled in this registry from 1995 - 2016 with medical records in electronic format were included in the study set and comprised a subset of HCM cases with diagnosis confirmed by echo as well as by the manual review of EHRs.
Image-based ground truth labeling:
To train the machine learning models, the patients in our cohort were labeled into three HCM groups: [1] yes (definite HCM), [2] no, and [3] possible using the gold standard imaging tests for HCM diagnosis. Among these patients, 7,889 (71%) had an echo and 1,457 (13%) had CMR. CMR diagnosis of HCM was extracted by natural language processing applied to CMR reports. Among 7,889 patients who had an echo 3,810 (48%) received a confirmed diagnosis and among 1,457 patients who had CMR, 1,087 (75%) has definite HCM confirmation. Patients with confirmed HCM by echo, CMR, or echo plus the manual review of EHRs were classified as HCM-Yes (i.e. definite HCM cases) (n=7,211). Patients without HCM phenotype diagnosed by imaging (n=426) were considered as no-HCM by echo (n=238) or CMR (n=188). Remaining patients in the cohort who have been reported with HCM related billing codes but have no evidence of HCM diagnosis by echo (n=3,808) or CMR (n=117) were classified as possible HCM (n=3,923).
All historical billing codes for selected patients were extracted from the Mayo clinic system’s EHR over the course of 1985 to 2019 which covers more than 2.142 million encounters related to 11,475 patients. Among these historical data, there are 1,055,598 encounters with the prior confirmed diagnosis for HCM yes 52,126 encounters to HCM No, and 1,016,141 encounters to HCM possible patients (Figure 1).
Fig. 1.

HCM target ground truth labeling (Yes / No / Possible) used as the target of our machine learning prediction model. The EHR data of HCM related billing codes and patients. These patients were classified into three categories of yes (definite HCM), no HCM, and possible HCM based on manual review of medical records and results of the gold standard imaging tests for HCM diagnosis, echo, or CMR imaging
Extended billing code features:
As shown in Figure 2, clinicians focused on important diagnostic features to extract HCM related billing codes from 14,800 ICD-9 and ICD-10 billing codes. Among them, 81 features were identified as important in HCM diagnosis and were further classified into two categories of inclusive and exclusive features. Inclusive features consist of 34 features such as symptoms (e.g. syncope, dyspnea, etc.), comorbidities (e.g. heart failure, etc.), and guideline-recommended therapies for the management of HCM patients (e.g. open-heart surgery for HCM or AICD implant). Exclusive features are 47 features such as the HCM mimics (e.g. hypertensive cardiomyopathy). These confirmatory features were used as features for model interpretability. Based on these features, billing codes were labeled as inclusive and exclusive.
Fig. 2.
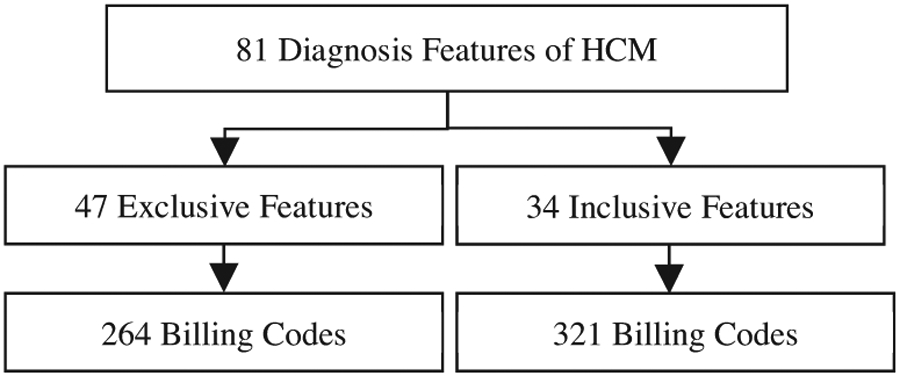
Selection of billing codes using HCM diagnosis features. HCM diagnosis factors were labeled as exclusive and inclusive features and 586 billing codes were chosen.
Based on the selected features, 586 billing codes that were in direct relationship with the detection of HCM classes of patients were selected. These billing codes were used as features to train the ML model. To find the importance of each billing code for HCM patients, the frequency of billing codes per patient was calculated. The count of encounters per billing codes was considered as the weight of each patient in input data.
B. Machine Learning (ML) Model
In the model selection step, literature shows the application of logistic regression and naive Bayes for the identification of HCM patients. Bhattacharya, et al. [11] mentioned HCM related datasets are highly imbalanced, and over or under-sampling strategies or both could address this issue effectively in their proposed model. In another study, Breiman [12] recommends random forest for handling high dimensional data. Each sub-tree receives a random subset of features (columns) and samples (rows). This structure also makes random forests effective in handling missing data as there was always a good chance that another tree was trained on the existing features. Therefore, a random forest was adopted to investigate the predictive performance of billing codes for the identification of HCM patients due to its practical application and expected accuracy in a wide range of use cases. The random ensemble of multiple decision trees with a voting aggregation mechanism produces the final classification prediction. In other words, this model aimed to reduce the complexity by a simple voting strategy while preventing the overfitting problem. We have limited the trees to have only two branches at each split, and the trees to the depth of ten. (Figure 3)
Fig. 3.

Random Forest model visualization. RF model’s input is patients’ numbers and their billing codes. The features of the model are the billing codes and the result is aggregated by voting to predict definite HCM, No or possible.
The frequency of each billing code over all different encounters of each patient was used as input for the model. The input data consisted of a matrix, where each row was related to one specific patient and each of the 580 columns was related to one billing code. Each cell in this matrix contained the total number of the appearance of each billing code for one specific patient. In our model, 500 trees were constructed after calibration and 24 features were used at each split (square root of 580 features).
To run the model, the data set was divided into training and test dataset. The training dataset was balanced using the oversampling method. Then the model was trained to predict a label for any new test sample using majority votes with 10-fold cross-validation. The outcomes for these models were HCM diagnosis labels (“yes,” “no”, “possible”). These labels were recognized previously by CMR, echo, or echo plus the manual review of medical records and used for the training of the model. To validate the results, a 10 time-random cross-validation was applied with 80% random selection for train and 20% for the test, at each round. This approach helps to avoid overfitting and could deal with a large number of features. The simplicity of the random forest made it very convenient in the application as it just needs three hyperparameters, namely the number of trees, the number of features sent to each tree, and the number of branches at each tree split.
RESULTS
Random forest classification was performed on 580 billing codes from 11000 HCM-related patients. Our model reached an accuracy of 70.51% (95% confidence interval from 68.6% to 72.4%). Kohn’s Kappa coefficient for the model falls in the range of 0.41– 0.60. The p-value was 2.2 × 10⁻¹⁶ and the model failed to classify 29.5% of patients. We showed the detailed information on this experiment after 10-fold cross-validation in Table 1.
TABLE I.
Summary of results.
| a) Sensitivity, specificity, and detection rate | |||
|---|---|---|---|
| Measurements╲Reference | HCM No | HCM Possible | HCM Yes |
| Sensitivity | 0.5 | 0.58 | 0.78 |
| Specificity | 0.9 | 0.83 | 0.77 |
| Detection Rate | 0.02 | 0.2 | 0.49 |
| b) Confusion matrix of the random forest model | |||
| Measurements╲Reference | HCM No | HCM Possible | HCM Yes |
| HCM No | 43 | 117 | 88 |
| HCM Possible | 31 | 456 | 221 |
| HCM Yes | 12 | 207 | 1117 |
| c) Recall, precision, F1 score of each class | |||
| Reference╲Measurements | Recall | Precision | F1 score |
| HCM No | 0.50 | 0.17 | 0.25 |
| HCM Possible | 0.58 | 0.64 | 0.61 |
| HCM Yes | 0.78 | 0.84 | 0.81 |
| Weighted average | 0.70 | 0.75 | 0.72 |
| Accuracy | 0.70 | ||
The underlying diagnoses of misclassified cases were mainly billing codes for hypertension (4%), atrial fibrillation (3%), dyslipidemia (2.5%), and any cardiomyopathy (2%). The median age of misclassified patients was 69 years and 45% of them were females. Overall, females were misclassified at older ages in comparison with males (76 years versus 65 years of age).
Discussion
How well EHR historical billing codes of patients can help in finding HCM Yes and No, is the research question that was not adequately addressed in the literature. This is despite the large number of patients that are at risk of having HCM and need to be identified for further investigation. These patients are considered as HCM possible patients and were not provided a definite image-based classification. A prior study (Magnusson, et al. [8]) on HCM related billing codes confirms one-third of HCM positive patients were misclassified by these codes (e.g. −I42.1 and I42.2, or 425.11 and 425.18). On the other hand, comorbidity and symptoms of many diseases can mimic HCM and this adds to the complexity of selecting related billing codes of the model. One approach is the classification of billing codes into inclusive and exclusive codes based on HCM related diagnoses by expert opinion.
Considering the high rate of misdiagnosis, using just a handful of billing codes for the identification of HCM patients seems not to be sufficient. Therefore, developing machine learning models that are using a larger set of historical billing codes for the identification of HCM patients can assist clinicians to avoid misdiagnose of these patients in the early steps of visits. We proposed in this paper a machine learning model that predicts HCM Yes and No plus Possible from the carefully selected list of possible relevant billing codes. One significance of our method in comparison with other works is the definition and extraction of 586 related billing codes (features) to be used in the machine learning model. This set of features contains both inclusive and exclusive billing codes that were proposed by clinicians. Moreover, addition of the “HCM Possible” class was another unique aspect of our study. Adding the category of possible to the traditional categories of Yes and No, helped to detect more patients. This is done using features that suggest the possibility of having HCM and may require further medical investigation.
Comparing with prior studies such as Magnusson, et al. [8], the misclassification of HCM Yes/No patients was 33%. To find a base to compare the performance of the proposed model, we can calculate the rate of misclassification of HCM Yes and No patients in our train data set. This rate is %8 for patients with yes and no label after exclusion of possible cases. In other words, the proposed model would recognize more patients with/without HCM by adding billing codes for symptoms, comorbidities, and treatment strategies that are utilized for the management of HCM patients. To compare the performance of the model for HCM possible, no prior model was previously published.
A. Visualization of the Results
Despite the inevitable value of ML techniques such as random forest, in healthcare, they are not intrinsically interpretable and have a significant drawback in terms of transparency of their behaviors that leaves users with little understanding. This becomes critically important not to use “black-box” models in cases such as clinical decision making where the model misclassification may cost in serious health consequences.[13] Working on the explanation and visualization of the ML model results can add to the transparency of the existing ML algorithms by providing the end-user reasoning on how the model came up with a prediction and help them evaluate the system’s recommendation. (Figure 4)
Fig. 4.

Result explanation of Random Forest model (inferred from Ribeiro, et al. [1]). RF model results can be explained using an explainer method to help physicians to trust the model results.
In the context of medical ML, better visualization of ML models can provide enough pieces of evidence for physicians in making the right decision. As illustrated in Figure 4 (inferred from Ribeiro, et al. [1]), a black-box ML model such as random forest predicted that the patient had HCM while the chosen method looked at the relevant symptoms in the patient history and highlighted for the physicians that certain billing codes together had the most contribution in the prediction of HCM positive and possible. It also shows that other billing codes such as I11.0 were negatively affecting the prediction. These explanations can help the physicians whether to trust the model’s prediction or not. Our chosen explaining approach for the proposed model was the principal component analysis (PCA) to determine the most differentiable features (Figure 5).
Fig. 5.
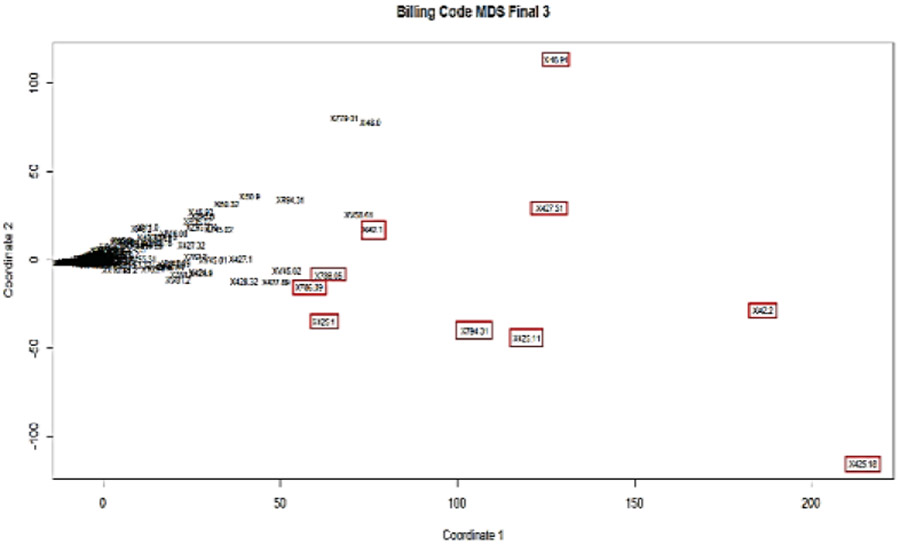
PCA representation of all billing codes (n=586) onto the top two principle components. The selected top ten billing codes are highlighted red boxes.
Transforming and plotting the space of the top two principal components allowed us to separate billing codes based on their importance for the final predicting model. Figure 5 shows the projection of all 580 billing codes onto the two principal components and ten ICD codes that were stand out. In Table 2 the billing codes, shown in red boxes in Figure 5 are summarized. These billing codes were the top ten in relevance with HCM diagnosis. All codes listed in Table 2 were inclusive billing codes for HCM.
TABLE II.
Top ten billing codes selected through PCA and their corresponding HCM relevance. Top ten billing codes selected by PCA method, are considered inclusive based of the diagnostic features of HCM defined by early stages of categorizing billing codes.
| # | Billing code |
Description | Inclusive/ Exclusive |
|---|---|---|---|
| 1 | 425.18 | Cardiomyopathy Hypertrophic | Inclusive |
| 2 | I42.2 | Cardiomyopathy Hypertrophic | Inclusive |
| 3 | 425.11 | Cardiomyopathy Hypertrophic | Inclusive |
| 4 | 427.31 | Atrial Fibrillation | Inclusive |
| 5 | 794.31 | Abnormal Electrocardiogram (ECG) NOS | Inclusive |
| 6 | I48.91 | Fibrillation Atrial (AF) NOS | Inclusive |
| 7 | I42.1 | Cardiomyopathy Obstructive | Inclusive |
| 8 | 425.1 | Cardiomyopathy Hypertrophic | Inclusive |
| 9 | 786.09 | Dyspnea | Inclusive |
| 10 | 786.05 | Dyspnea | Inclusive |
For further evaluations, and to show the strength of the model to differentiate between exclusive and inclusive billing codes in the identification of HCM patients, features interactions were plotted. Figure 6 plots show the probability of a prediction against two chosen features. The probability of HCM Yes against selected billing codes was visualized to observe the level of segregation. For example, plot (a) and (b) plots of Figure 6 show that the billing code of I11.0 (hypertensive heart disease with heart failure) which was an exclusive billing code was differentiated from I42.1 and I42.2 (inclusive billing codes for HCM) but this situation was not true for other exclusive billing codes such as I47.1, I50.9, I50.32, and I151.9 billing codes.
Fig. 6.

Interaction of billing codes in predicting the probability of HCM Yes. To evaluate the billing codes interactions, the probability of a prediction against inclusive and exclusive billing codes were plotted. The clear cuts in colors shows the level of segregation.
B. Limitations
All patients referred to the HCM clinic are diagnosed with some signs of heart disease. So the patient’s cohort is biased toward HCM yes and positive and the distribution of patients is not normal. Some of these patients might already have HCM related billing codes in their previous visit as there is a probability of misdiagnosing this disease with similar diseases such as Fabry disease, Athlete heart, aortic valve stenosis, hypertensive cardiomyopathy, left ventricular hypertrophy, and cardiac amyloidosis.
The proposed model could predict the class of HCM possible, HCM yes with superior performance compared to the class of HCM No. So the model power in the prediction of each class was not equal. Another limitation of this model was the issue of unbalanced data. Although our resampling technique helped in improving the model’s bias toward the larger class, it caused a little drop in the prediction accuracy. As suggested in the literature adding more real-world samples from the smaller class, or oversampling with additive noise while balancing the data may resolve this issue. Bakeman and Quera [14] mentioned some factors such as observer accuracy, number of records, observer bias, or observer independence might influence on Kappa value of developed models. Therefore, our model possibly could improve further by modifications of the above-mentioned factors in future studies.
Conclusions
In this paper, a novel billing code-based machine learning model, Random forest, for the identification of HCM patients from EHR data was developed. The model classified the patients into three classes of HCM Yes, No and Possible, unlike the previously reported two classes of Y/N. This may help clinicians to find more patients at risk of HCM rather than not recognizing them. Also, model features were not focusing only on the most common billing codes of HCM but included 586 inclusive and exclusive billing codes. These billing codes were selected based on 81 of the features in the diagnosis of HCM by clinicians. This approach of feature extraction could be generalized to other billing code models.
Another significance of this study was proposing methods for visualization of the result of the model from a clinical perspective. The principal component analysis was used to report the top ten billing codes. Also, the model was visualized using random forest explainers' techniques. Clinicians can use this model for faster retrieval of HCM cases from their EHR data for quality improvement initiatives, to generate input to clinical decision support systems, and for future EHR-based cohort studies in HCM.
Acknowledgment
The research reported in this publication was supported by the National Heart, Lung, and Blood Institute of National Institutes of Health (K01HL124045), and by the Mayo Clinic K2R. The content is solely the responsibility of the authors and does not necessarily represent the official views of the National Institutes of Health.
Contributor Information
Nasibeh Zanjirani Farahani, Department of Health Sciences Research, Mayo Clinic, Rochester, MN, USA.
Divaakar Siva Baala Sundaram, Biomedical Informatics & Comp. Biology, University of Minnesota, Rochester, MN, USA.
Moein Enayati, Department of Health Sciences Research, Mayo Clinic, Rochester, MN, USA.
Shivaram Poigai Arunachalam, Department of Medicine & Radiology, Mayo Clinic, Rochester, MN, USA.
Kalyan Pasupathy, Department of Health Sciences Research, Mayo Clinic, Rochester, MN, USA.
Adelaide M. Arruda-Olson, Department of Cardiovascular Medicine, Mayo Clinic, Rochester, MN, USA
References
- [1].Ribeiro MT, Singh S, and Guestrin C, " " Why should I trust you?" Explaining the predictions of any classifier," in Proceedings of the 22nd ACM SIGKDD international conference on knowledge discovery and data mining, 2016, pp. 1135–1144. [Google Scholar]
- [2].Kramer CM et al. , "Hypertrophic Cardiomyopathy Registry: The rationale and design of an international, observational study of hypertrophic cardiomyopathy," (in eng), American heart journal, vol. 170, no. 2, pp. 223–230, 2015, doi: 10.1016/j.ahj.2015.05.013. [DOI] [PMC free article] [PubMed] [Google Scholar]
- [3].Maron BJ, Rowin EJ, and Maron MS, "Paradigm of sudden death prevention in hypertrophic cardiomyopathy," Circulation research, vol. 125, no. 4, pp. 370–378, 2019. [DOI] [PubMed] [Google Scholar]
- [4].Elliott PM et al. , "2014 ESC Guidelines on diagnosis and management of hypertrophic cardiomyopathy: The Task Force for the Diagnosis and Management of Hypertrophic Cardiomyopathy of the European Society of Cardiology (ESC)," European Heart Journal, vol. 35, no. 39, pp. 2733–2779, 2014, doi: 10.1093/eurheartj/ehu284. [DOI] [PubMed] [Google Scholar]
- [5].Maron BJ, "Clinical course and management of hypertrophic cardiomyopathy," New England Journal of Medicine, vol. 379, no. 7, pp. 655–668, 2018. [DOI] [PubMed] [Google Scholar]
- [6].Gersh BJ et al. , "2011 ACCF/AHA Guideline for the Diagnosis and Treatment of Hypertrophic Cardiomyopathy: a report of the American College of Cardiology Foundation/American Heart Association Task Force on Practice Guidelines. Developed in collaboration with the American Association for Thoracic Surgery, American Society of Echocardiography, American Society of Nuclear Cardiology, Heart Failure Society of America, Heart Rhythm Society, Society for Cardiovascular Angiography and Interventions, and Society of Thoracic Surgeons," J Am Coll Cardiol, vol. 58, no. 25, pp. e212–60, Dec 13 2011, doi: 10.1016/j.jacc.2011.06.011. [DOI] [PubMed] [Google Scholar]
- [7].Pujades-Rodriguez M et al. , "Identifying unmet clinical need in hypertrophic cardiomyopathy using national electronic health records," PLoS One, vol. 13, no. 1, p. e0191214, 2018, doi: 10.1371/journal.pone.0191214. [DOI] [PMC free article] [PubMed] [Google Scholar]
- [8].Magnusson P, Palm A, Branden E, and Morner S, "Misclassification of hypertrophic cardiomyopathy: validation of diagnostic codes," Clin Epidemiol, vol. 9, pp. 403–410, 2017, doi: 10.2147/CLEP.S139300. [DOI] [PMC free article] [PubMed] [Google Scholar]
- [9].Fan J et al. , "Billing code algorithms to identify cases of peripheral artery disease from administrative data," Journal of the American Medical Informatics Association, vol. 20, no. e2, pp. e349–e354, 2013, doi: 10.1136/amiajnl-2013-001827. [DOI] [PMC free article] [PubMed] [Google Scholar]
- [10].Doshi-Velez F and Kim B, "Towards a rigorous science of interpretable machine learning," arXiv preprint arXiv:1702.08608, 2017. [Google Scholar]
- [11].Bhattacharya M et al. , "Identifying ventricular arrhythmias and their predictors by applying machine learning methods to electronic health records in patients with hypertrophic cardiomyopathy (HCM-VAr-risk model)," The American Journal of Cardiology, vol. 123, no. 10, pp. 1681–1689, 2019. [DOI] [PubMed] [Google Scholar]
- [12].Breiman L, "Random forests," Machine learning, vol. 45, no. 1, pp. 5–32, 2001. [Google Scholar]
- [13].Du M, Liu N, and Hu X, "Techniques for interpretable machine learning," Communications of the ACM, vol. 63, no. 1, pp. 68–77, 2019. [Google Scholar]
- [14].Bakeman R and Quera V, Sequential analysis and observational methods for the behavioral sciences. Cambridge University Press, 2011. [Google Scholar]