

Abstract
Mice have been increasingly used as preclinical model to elucidate mechanisms and test therapeutics for treating intervertebral disc degeneration (IDD). Several intervertebral disc (IVD) histological scoring systems have been proposed, but none exists that reliably quantitate mouse disc pathologies. Here, we report a new robust quantitative mouse IVD histopathological scoring system developed by building consensus from the spine community analyses of previous scoring systems and features noted on different mouse models of IDD. The new scoring system analyzes 14 key histopathological features from nucleus pulposus (NP), annulus fibrosus (AF), endplate (EP), and AF/NP/EP interface regions. Each feature is categorized and scored; hence, the weight for quantifying the disc histopathology is equally distributed and not driven by only a few features. We tested the new histopathological scoring criteria using images of lumbar and coccygeal discs from different IDD models of both sexes, including genetic, needle‐punctured, static compressive models, and natural aging mice spanning neonatal to old age stages. Moreover, disc sections from common histological preparation techniques and stains including H&E, SafraninO/Fast green, and FAST were analyzed to enable better cross‐study comparisons. Fleiss's multi‐rater agreement test shows significant agreement by both experienced and novice multiple raters for all 14 features on several mouse models and sections prepared using various histological techniques. The sensitivity and specificity of the new scoring system was validated using artificial intelligence and supervised and unsupervised machine learning algorithms, including artificial neural networks, k‐means clustering, and principal component analysis. Finally, we applied the new scoring system on established disc degeneration models and demonstrated high sensitivity and specificity of histopathological scoring changes. Overall, the new histopathological scoring system offers the ability to quantify histological changes in mouse models of disc degeneration and regeneration with high sensitivity and specificity.
Keywords: aging, degeneration, pre‐clinical models, structure‐function relationships
We have developed a new Mouse intErveRtebral disC histopathologY (MERCY) system using a step‐wise approach that included building consensus in the spine community, testing reliability using various mouse disc degeneration models for agreement by multiple raters, validating for high sensitivity and specificity using AI and machine learning algorithms, and applied on established models of murine disc degeneration. Hence, this new system can be broadly applied to quantify mouse IVD histopathology in disc degeneration and regeneration models.

1. INTRODUCTION
Histopathology evaluates cells, tissues, and organs at the microscopic level to better understand the medical condition's clinical diagnosis. Histopathological analysis is a crucial outcome measure for determining disease progression, the degenerative, or regenerative state of the tissues, such as in the intervertebral disc (IVD), both clinically and in preclinical research. The IVD is a heterogeneous tissue forming a joint between each vertebra in the spine. Each IVD has three components; a center core of nucleus pulposus (NP), surrounded by orthogonal concentric layers of annulus fibrosus (AF) and connected to adjacent vertebrae by endplates (EP). Pathological degeneration of the IVD is a significant cause of chronic neck and lower back pain, a substantial socioeconomic burden affecting the quality of life of millions of people globally, but with no effective disease‐modifying treatment. 1 , 2 , 3 , 4 Degeneration of the IVD is multi‐factorial, stemming from natural aging, injury, herniation, bulging, or fracture of lumbar vertebrae or facet joints, affecting its overall structure and function (reviewed in References 5, 6, 7). Histopathological evaluations are observational analyses that categorize samples based on features of cellular and structural changes. To quantify observational histopathological data, it is essential to:
establish a criterion for categorizing the features of healthy IVD and those observed with its progressive pathologies that are recognizable and quantifiable,
harmonize terminology,
determine the ease of understanding the scoring criteria statistically by testing the agreement of scores from several randomly chosen independent observers on given samples, and
statistically evaluate the sensitivity of included features for quantifying IVD pathologies.
Preclinical animal models are valuable tools to study human diseases and test therapeutic interventions. In musculoskeletal research, including IVD and spine, several small and large preclinical animal models are employed based on each model system's advantages and the scope of the study. Due to several similarities between the mouse model and humans, such as their high genetic similarity and notable anatomical and physiological similarities, mice have been widely used to study musculoskeletal disorders and other human diseases. The mouse model offers the advantage of precise and conditional genetic manipulation for mechanistic and functional studies to model IVD degeneration and back pain‐related conditions. Comparative studies have demonstrated that the mouse lumbar IVDs are geometrically least deviated from humans than other preclinical animal models used for IVD research. 8 Moreover, following geometric normalization, mouse IVDs were reported to be closer to humans with regards to torsion mechanics and collagen content. 9 Additionally, the vertebra of a few mouse strains including friend virus B (FVB) does not have a secondary center of ossification till skeletal maturity, 10 , 11 or even till about 2 years of age (References 12, 13, 14, 15 and Figure 2E) and the EP is connected to the vertebral growth plate (GP).
With the widespread use of mice as a preclinical animal model to understand IVD pathologies (reviewed in References 16 and 17), it is crucial to establish an effective histopathological scoring system that can capture the key known features of human IVD pathologies found in various mouse IVD degeneration models, enabling better cross‐study comparisons. This study aims to develop a comprehensive mouse IVD histopathological scoring system that evaluates histopathology in all regions of mouse IVDs with high sensitivity and specificity to allow cross‐comparison between different mouse models of IVD degeneration and regeneration. We considered the strengths and weaknesses of previously reported scoring systems, incorporated feedback from multiple spine research groups, and captured features of human IVD pathologies that are observed in mouse IVDs. Also, consideration was given to balance the simplicity of scoring features, specificity, sensitivity, ease of adaptability to various mouse models of IVD degeneration, and higher inter‐rater and intra‐rater agreement. This article describes the development of a new mouse IVD histopathological scoring system, where (a) we evaluate the IVD pathological features and develop new histopathological scoring criteria; (b) test the scoring criteria for agreement between raters; (c) validate the sensitivity and specificity of the scoring criteria using machine learning algorithms; and (d) apply the scoring criteria to various mouse models of IVD degeneration to analyze it's adaptability (Figure 1).
FIGURE 1.

Pipeline for development of the new mouse IVD histopathological scoring system. The workflow for development of “MERCY” (Mouse intErveRtebral disC histopathologY) included development of the new scoring system, testing reliability using multi‐raters, validation by applying AI and machine learning algorithms and application on established models of IVD degeneration for sensitivity and specificity
2. RESULTS
2.1. Development of a new mouse histopathological scoring system
To develop a new mouse IVD histopathological scoring criterion, we first evaluated the pathologies described in the literature and by gathering the best practices from the spine research community.
2.1.1. Evaluation of normal mouse IVD and naturally occurring pathologies
First, we evaluated the naturally occurring age‐related pathologies in mouse IVDs. The classifications of normal postnatal growth (less than 3 months, 3 M), maturation (3‐6 M), middle age (10‐14 M), old (18‐24 M), and very old (>24 M) age are based on guidance from Jackson Laboratories for mice. 18 Naturally occurring pathologies in mouse IVDs are observed only after 16 to 18 M of age, 13 and by about 24 M of age. 12 , 13 , 14 , 15 , 19 , 20 , 21 , 22 , 23 In summary, histology of a healthy IVD in neonatal and mature mice is characterized by evenly spread stellate or spindle‐shaped NP cells (Figure 2A,B). The AF lamella in neonatal mouse IVDs continue to develop (Figure 2A) but become organized into concentric layers by 1 month of age, and at this time, EP has defined layers (Figure 2B). IVDs of skeletally mature mice (~3 M old) maintain normal histological features (Figure 2C). In the lumbar IVDs of middle‐aged mice (~12 M), the NP cells cluster together and may not be spindle‐shaped, the AF becomes thin, and its lamellae separate or show clefts, while the EPs may not change much (Figure 2D). The lumbar IVDs of old or very old mice have fewer NP and AF cells isolated in lacunae, with one or more nuclei. The AF loses its defined lamellar structure, protrudes inwards towards the NP or outwards. The AF of aged IVDs may lose its integration into the EP. The EP of aged IVDs may lose cells or show cells that are isolated in lacunae; the EP may have features of micro‐fissures or tears/ fracture and fibrosis from the EP into the NP region. The boundaries between IVDs regions may be lost, with visually evident loss of all IVD cell types, or with few cells in lacunae in each region, the lamellar structure in AF may be unrecognizable, and the EP may have several clefts and fissures (Figure 2E).
FIGURE 2.
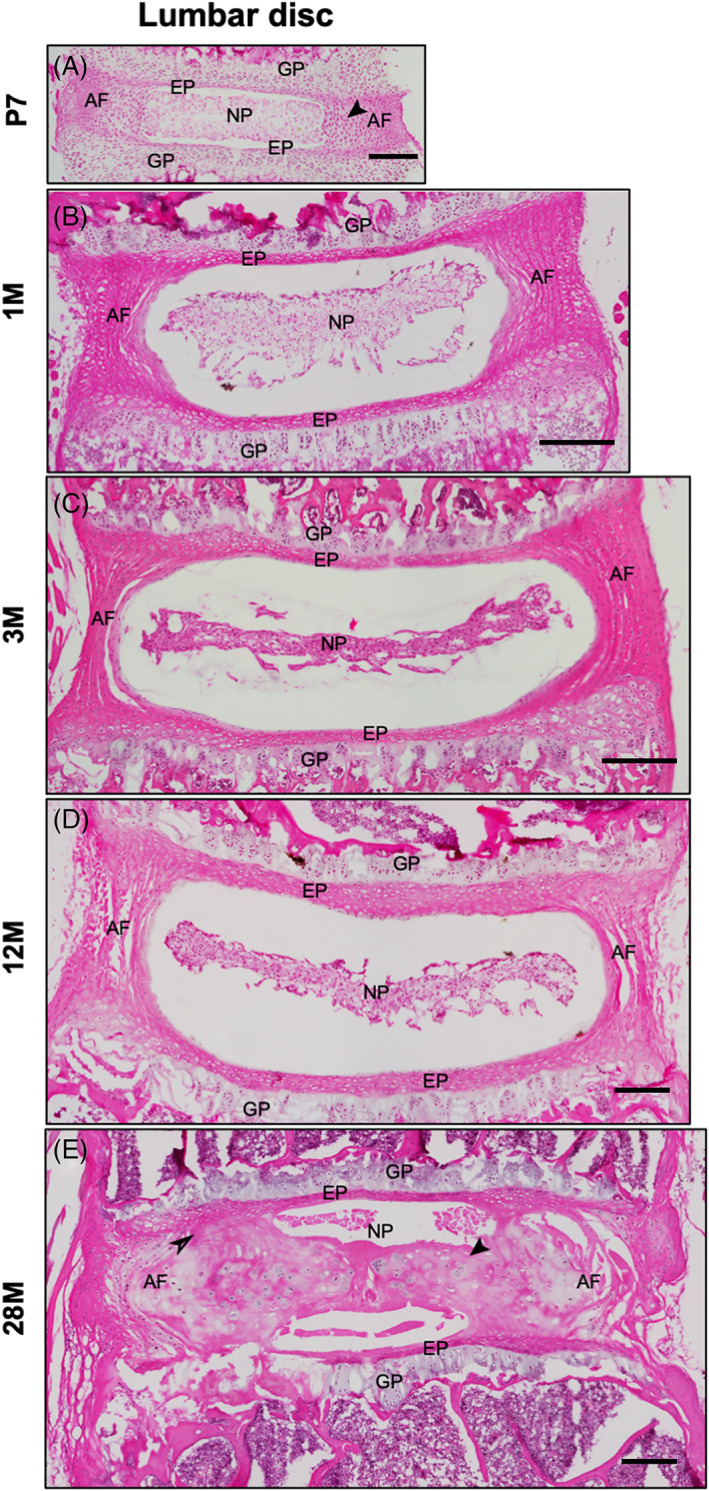
Natural growth and aging of mouse lumbar IVD. Representative H&E‐stained microscopic images of mouse lumbar IVDs at P7 (A), 1 M (B), 3 M (C), 12 M (D), and 28 M (E) of age prepared in the coronal plane. The black arrow in P7 IVD shows the immature cells in inner AF (A). The black arrow in 28 M IVD shows loss of demarcation between NP and AF and loss of AF integration into EP (E). AF, annulus fibrosus; EP, endplate; GP, growth plate; NP, nucleus pulposus. Scale bar = 200 μm
2.1.2. Review of the published mouse IVD histopathological scoring systems
Next, we reviewed the published IVD histopathological scoring systems, focusing on ones developed using rodent models or adopted to quantify pathologies in mouse IVDs. We short‐listed three IVD histopathological scoring systems developed using mouse models 24 , 25 , 26 and adapted by studies using mouse model, 13 , 20 , 22 , 27 , 28 , 29 , 30 , 31 and one developed in rat 32 and adopted for scoring mouse IVDs. 33 , 34 Two scoring systems were developed on human IVD samples 35 , 36 (Figure 3) but later adapted for scoring mouse IVDs based on histopathological and microscopic features (References 34, 37, 38, 39, 40, 41, 42 to name a few; Table 1). The original Thompson grading system evaluates structural changes in human IVD at the macroscopic level and is not suitable to quantify histological changes. Next, we compared these scoring systems for features analyzed, scoring range (Figure 3), experimental models, standard operating procedures (SOPs) for histological preparation of IVD samples, and statistical analysis for testing the reliability of the scoring system (Table 1). The needle‐puncture model was used for modeling IVD degeneration in all studies for developing mouse histopathological systems. 24 , 25 , 26 , 32 IVDs of static compression models and genetic mutants were assessed by one study 25 (Table 1). IVDs from aging rodents, both mice and rats, were not tested in the original studies, overlooking the naturally occurring pathologies. The Tam et al, study did analyze the IVDs from aged mice to develop the scoring criteria. While fibrosis in the NP region was considered by one rodent scoring system, 24 NP and AF cellularity and matrix features were considered by all (Figure 3). However, none of the previous rodent IVD histopathological scoring systems analyzed the presence of notable pathological features of degenerating human IVDs, including the presence of cells in lacuna, 43 protrusion of AF, vascularization of AF, 44 features also observed in IVDs of aging mice. 14 , 15 , 17 The EP was not included in any of the previous rodent IVD histopathological scoring systems (Table 2). EP grading schema was proposed in a recent study. 45 The NP‐AF boundary was considered for scoring the interface region by a few studies (Figure 3). All histopathological scoring systems categorized the pathological features on an ordinal scale of an equal interval (Figure 3). All scoring systems, except Thompson, assigned zero (0) to the healthy or non‐degenerate IVDs. The highest score given to the most severely degenerated IVDs varied between the studies, and so did the scoring range (Figure 3). The Tam et al study attributed the highest scores of “four” based on the presence of NP mineralization as observed in the sacral IVD, which physiologically mineralizes and fuses before skeletal maturity and is not a degenerative phenotype. 46 Hence, the severely degenerative phenotype in mouse IVDs cannot be scored accurately. All studies tested their scoring systems using blinded raters for inter‐rater reliability (Table 1). Reliability was tested by applying different algorithms including Fleiss's multi rater kappa (κ) for absolute agreement, 25 and weighted κ for testing the magnitude of agreement. Intra‐rater reliability was reported by only a few of the studies (Table 1).
FIGURE 3.

Summary of published histopathological scoring systems. The chart shows features analyzed and scoring range from the listed histopathological scoring systems
TABLE 1.
Summary of the previous IVD histopathological scoring systems utilized for grading mouse IVDs
| Ohnishi et al, 2016 | Tam et al, 2018 | Tian et al, 2018 | Han et al, 2008 | Thompson et al, 1990 | Boos et al, 2002 | ||
|---|---|---|---|---|---|---|---|
| Species | Mouse | Mouse | Mouse | Rat | Human (adopted in mouse) | Human (adopted in mouse) | |
| Sex | Male; Female | Male; Female | Female | Male | Male; Female | Not reported | |
| Strain | C57BL/6J | 129S9/SvEvH; C57BL/6J; ICR; F1 (C57BL/ 6 N CBA/Ca) | C57BL/6J | Sprague Dawley | N/A | N/A | |
| Age | 2.5 M‐5.25 M | 2.5 M ‐ 10 M | 2 M | 3 M | 16‐89 years | Fetal ‐ senile (88 years) | |
| Disc degeneration model | Needle‐puncture | Needle‐puncture, static compression, genetic mutants | Needle‐puncture | Needle‐puncture | Natural aging | Natural aging | |
| Spine region | Lumbar | Coccygeal, thoracic, lumbar, sacral | Coccygeal | Coccygeal | Lumbar | Lumbar | |
| SOP | Fixative | 10% buffered formalin | 4% buffered PFA | 4% PFA | 10% neutral buffered formalin | Washing and scrubbing of lateral cut surface | 4% buffered formaldehyde |
| Decalcification | 10% EDTA | 0.5 M EDTA | 10% citric acid, 22% formic acid | Rapid decalcifier solution | 0.1 mol/L EDTA | ||
| Embedding | Paraffin | Paraffin | Paraffin | Paraffin | Paraffin | ||
| Plane | Midsagittal | Sagittal/ coronal | Not reported | Midsagittal | Midsagittal | Midsagittal | |
| Thickness | Not reported | 6 μM | 5 μM | 6 μM | N/A | 2–4 μm | |
| Staining | Safranin O‐fast green | FAST | H&E, Alcian Blue with H&E counterstain | H&E, Saf‐O/ Fast green, H | N/A | H&E, Masson‐Goldner, Alcian blue‐PAS | |
| Reliability tests | Rater (n) | Two independent blinded graders | Two experienced, 13 new scorers | Three | Two independent blinded graders | Three independent blinded graders | Two pathologists |
| Images graded (n) | n = 122 (106 puncture, 16 sham) | n = 13 | n = 24 | n = 53 (graded two section/disc) | n = 136 (graded two section/disc) | n = 54 samples (graded 150 slices) | |
| Data processing | Quantitative data was presented as the means of three evaluations | Calculated average score of scorers | Calculated scores for NP and AF. Calculated average scores of 3 raters | Not reported | Grades of first replicate for each observer were averaged | Not reported | |
| Inter‐rater reliability test | Kappa (algorithm not reported) | Fleiss' multi‐rater kappa | Weighted kappa | Cohen's kappa | Cohen's kappa | Weighted kappa | |
| Results | κ =0.85‐1.0 | NP structure: κ = 0.562 | Kappa values not reported | Combined κ = 0.77 | Combined κ = 0.67‐0.94 | κ = 0.493‐0.977 | |
| Kappa for each feature not reported | Cleft/fissures in the NP: κ = 0.574 | Kappa for each feature not reported | Agreement between assigned and average grades: | Kappa for each feature not reported | |||
| Cleft/fissures in AF: κ = 0.423 | Grade 1: 85% | ||||||
| AF/NP boundary: κ = 0.203 | Grade 2: 92% | ||||||
| AF structure: κ = 0.131 | Grade 3: 68% | ||||||
| Grade 4: 90% | |||||||
| Grade 5: 76% | |||||||
| Intra‐rater reliability | Kappa | Not reported | Not reported | Cohen's kappa | Percent agreement: 85‐87% | Not reported | |
| κ = 0.85–1.0 | κ = 0.84 | Cohen's kappa. κ = 0.87‐0.91 | |||||
| Examples of application for scoring mouse IVDs (select references) | 27; 28; 29; 30 | 13; 20; 31 | 30; 34 | 33; 34 | 37; 38; 39; 40; 42 | 34; 41 | |
TABLE 2.
Fleiss's multi‐rater kappa (κ) to test inter‐rater reliability of trained and novice raters for the proposed 14 histopathological features
| Features | κ | 95% CI | κ | 95% CI | κ | 95% CI | κ | 95% CI | κ | 95% CI | ||||||||||
|---|---|---|---|---|---|---|---|---|---|---|---|---|---|---|---|---|---|---|---|---|
| Overall | LB | UB | P | Score‐0 | LB | UB | P | Score‐1 | LB | UB | P | Score‐2 | LB | UB | P | Score‐3 | LB | UB | P | |
| Experienced raters (208 IVDs, 2 raters)—Set 1 | ||||||||||||||||||||
| NP Cellularity | 0.74 | 0.65 | 0.82 | .00 | 0.73 | 0.59 | 0.87 | .00 | 0.64 | 0.51 | 0.78 | .00 | 0.54 | 0.41 | 0.68 | .00 | 0.90 | 0.76 | 1.04 | .00 |
| NP Fibrosis | 0.69 | 0.60 | 0.77 | .00 | 0.58 | 0.45 | 0.72 | .00 | 0.64 | 0.50 | 0.78 | .00 | 0.42 | 0.28 | 0.55 | .00 | 0.90 | 0.76 | 1.03 | .00 |
| NP ECM | 0.61 | 0.52 | 0.69 | .00 | 0.58 | 0.44 | 0.71 | .00 | 0.35 | 0.22 | 0.49 | .00 | 0.35 | 0.21 | 0.49 | .00 | 0.90 | 0.76 | 1.04 | .00 |
| AF Cellularity | 0.64 | 0.55 | 0.73 | .00 | 0.78 | 0.65 | 0.92 | .00 | 0.40 | 0.26 | 0.54 | .00 | 0.53 | 0.39 | 0.66 | .00 | 0.74 | 0.60 | 0.87 | .00 |
| AF Bulging | 0.69 | 0.60 | 0.78 | .00 | 0.88 | 0.75 | 1.02 | .00 | 0.41 | 0.28 | 0.55 | .00 | 0.53 | 0.40 | 0.67 | .00 | 0.77 | 0.64 | 0.91 | .00 |
| AF Lamellae | 0.68 | 0.60 | 0.76 | .00 | 0.90 | 0.77 | 1.04 | .00 | 0.63 | 0.50 | 0.77 | .00 | 0.50 | 0.36 | 0.63 | .00 | 0.53 | 0.39 | 0.67 | .00 |
| AF Clefts/ fissures | 0.73 | 0.65 | 0.82 | .00 | 0.85 | 0.71 | 0.98 | .00 | 0.61 | 0.47 | 0.74 | .00 | 0.49 | 0.35 | 0.62 | .00 | 0.89 | 0.76 | 1.03 | .00 |
| EP Cellularity | 0.81 | 0.69 | 0.93 | .00 | 0.91 | 0.78 | 1.05 | .00 | 0.09 | −0.05 | 0.23 | .19 | 0.83 | 0.70 | 0.97 | .00 | ||||
| EP Fissures | 0.67 | 0.57 | 0.77 | .00 | 0.82 | 0.68 | 0.96 | .00 | 0.45 | 0.32 | 0.59 | .00 | 0.67 | 0.53 | 0.81 | .00 | ||||
| Schmorl's node | 0.86 | 0.72 | 0.99 | .00 | 0.85 | 0.72 | 0.99 | .00 | 0.85 | 0.72 | 0.99 | .00 | ||||||||
| Interface Cellularity | 0.92 | 0.79 | 1.04 | .00 | 0.95 | 0.81 | 1.08 | .00 | 0.49 | 0.35 | 0.62 | .00 | 0.94 | 0.81 | 1.08 | .00 | ||||
| NP‐AF boundary | 0.90 | 0.79 | 1.01 | .00 | 0.95 | 0.82 | 1.09 | .00 | 0.70 | 0.57 | 0.84 | .00 | 0.91 | 0.78 | 1.05 | .00 | ||||
| NP‐EP boundary | 0.79 | 0.68 | 0.90 | .00 | 0.83 | 0.69 | 0.96 | .00 | 0.46 | 0.33 | 0.60 | .00 | 0.85 | 0.72 | 0.99 | .00 | ||||
| AF to EP disruption | 0.76 | 0.66 | 0.87 | .00 | 0.93 | 0.79 | 1.06 | .00 | 0.65 | 0.51 | 0.78 | .00 | 0.62 | 0.49 | 0.76 | .00 | ||||
| Novice raters (208 IVDs, 2 raters)—Set 1 | ||||||||||||||||||||
| NP Cellularity | 0.63 | 0.54 | 0.72 | .00 | 0.68 | 0.54 | 0.81 | .00 | 0.09 | −0.04 | 0.23 | .18 | 0.45 | 0.31 | 0.58 | .00 | 0.88 | 0.74 | 1.02 | .00 |
| NP Fibrosis | 0.56 | 0.47 | 0.65 | .00 | 0.77 | 0.64 | 0.91 | .00 | 0.24 | 0.10 | 0.37 | .00 | 0.05 | −0.09 | 0.18 | .50 | 0.65 | 0.52 | 0.79 | .00 |
| NP ECM | 0.51 | 0.42 | 0.60 | .00 | 0.72 | 0.59 | 0.86 | .00 | 0.16 | 0.03 | 0.30 | .02 | 0.01 | −0.13 | 0.15 | .89 | 0.61 | 0.48 | 0.75 | .00 |
| AF Cellularity | 0.43 | 0.34 | 0.52 | .00 | 0.62 | 0.49 | 0.76 | .00 | 0.00 | −0.14 | 0.14 | .99 | −0.01 | −0.14 | 0.13 | .93 | 0.55 | 0.42 | 0.69 | .00 |
| AF Bulging | 0.46 | 0.37 | 0.55 | .00 | 0.60 | 0.47 | 0.74 | .00 | 0.02 | −0.12 | 0.16 | .76 | −0.01 | −0.14 | 0.13 | .94 | 0.68 | 0.55 | 0.82 | .00 |
| AF Lamellae | 0.36 | 0.28 | 0.44 | .00 | 0.63 | 0.49 | 0.77 | .00 | 0.06 | −0.07 | 0.20 | .35 | 0.03 | −0.11 | 0.16 | .69 | 0.42 | 0.29 | 0.56 | .00 |
| AF Clefts/ fissures | 0.38 | 0.29 | 0.46 | .00 | 0.63 | 0.50 | 0.77 | .00 | 0.02 | −0.12 | 0.16 | .76 | 0.21 | 0.08 | 0.35 | .00 | 0.41 | 0.28 | 0.55 | .00 |
| EP Cellularity | 0.53 | 0.42 | 0.63 | .00 | 0.64 | 0.51 | 0.78 | .00 | 0.30 | 0.16 | 0.43 | .00 | 0.53 | 0.40 | 0.67 | .00 | ||||
| EP Fissures | 0.39 | 0.29 | 0.49 | .00 | 0.56 | 0.42 | 0.69 | .00 | 0.08 | −0.06 | 0.21 | .26 | 0.41 | 0.28 | 0.55 | .00 | ||||
| Schmorl's node | 0.50 | 0.36 | 0.63 | .00 | 0.50 | 0.36 | 0.63 | .00 | 0.50 | 0.36 | 0.63 | .00 | ||||||||
| Interface cellularity | 0.65 | 0.55 | 0.75 | .00 | 0.77 | 0.63 | 0.90 | .00 | 0.27 | 0.13 | 0.41 | .00 | 0.75 | 0.61 | 0.88 | .00 | ||||
| NP‐AF boundary | 0.76 | 0.66 | 0.86 | .00 | 0.85 | 0.72 | 0.99 | .00 | 0.47 | 0.34 | 0.61 | .00 | 0.84 | 0.70 | 0.97 | .00 | ||||
| NP‐EP boundary | 0.57 | 0.47 | 0.68 | .00 | 0.73 | 0.60 | 0.87 | .00 | 0.09 | −0.05 | 0.23 | .19 | 0.67 | 0.53 | 0.80 | .00 | ||||
| AF to EP disruption | 0.42 | 0.32 | 0.52 | .00 | 0.59 | 0.45 | 0.72 | .00 | 0.01 | −0.13 | 0.15 | .89 | 0.53 | 0.40 | 0.67 | .00 | ||||
| Novice raters (75 IVDs, 2 rater)—Set 4 | ||||||||||||||||||||
| NP Cellularity | 0.74 | 0.59 | 0.89 | .00 | 0.84 | 0.61 | 1.06 | .00 | 0.37 | 0.14 | 0.60 | .00 | 0.53 | 0.30 | 0.75 | .00 | 0.92 | 0.70 | 1.15 | .00 |
| NP Fibrosis | 0.70 | 0.55 | 0.86 | .00 | 0.78 | 0.55 | 1.01 | .00 | 0.37 | 0.14 | 0.60 | .00 | 0.36 | 0.13 | 0.58 | .00 | 0.92 | 0.70 | 1.15 | .00 |
| NP ECM | 0.79 | 0.64 | 0.95 | .00 | 0.86 | 0.64 | 1.09 | .00 | 0.58 | 0.35 | 0.81 | .00 | 0.63 | 0.40 | 0.86 | .00 | 0.88 | 0.66 | 1.11 | .00 |
| AF Cellularity | 0.75 | 0.60 | 0.90 | .00 | 0.92 | 0.69 | 1.14 | .00 | 0.33 | 0.11 | 0.56 | .00 | 0.37 | 0.14 | 0.60 | .00 | 0.92 | 0.69 | 1.15 | .00 |
| AF Bulging | 0.72 | 0.57 | 0.88 | .00 | 0.75 | 0.53 | 0.98 | .00 | 0.54 | 0.31 | 0.76 | .00 | 0.38 | 0.15 | 0.61 | .00 | 0.92 | 0.69 | 1.14 | .00 |
| AF Lamellae | 0.68 | 0.52 | 0.83 | .00 | 0.85 | 0.63 | 1.08 | .00 | 0.37 | 0.14 | 0.60 | .00 | 0.12 | −0.11 | 0.34 | .31 | 0.82 | 0.60 | 1.05 | .00 |
| AF Clefts/ fissures | 0.67 | 0.52 | 0.81 | .00 | 0.86 | 0.64 | 1.09 | .00 | 0.46 | 0.23 | 0.68 | .00 | 0.21 | −0.01 | 0.44 | .07 | 0.75 | 0.52 | 0.98 | .00 |
| EP Cellularity | 0.85 | 0.68 | 1.02 | .00 | 0.94 | 0.72 | 1.17 | .00 | 0.74 | 0.51 | 0.96 | .00 | 0.82 | 0.60 | 1.05 | .00 | ||||
| EP Fissures | 0.74 | 0.57 | 0.91 | .00 | 0.88 | 0.66 | 1.11 | .00 | 0.62 | 0.39 | 0.84 | .00 | 0.64 | 0.41 | 0.87 | .00 | ||||
| Schmorl's node | 1.00 | 0.77 | 1.23 | .00 | 1.00 | 0.77 | 1.23 | .00 | 1.00 | 0.77 | 1.23 | .00 | ||||||||
| Interface Cellularity | 0.77 | 0.60 | 0.94 | .00 | 0.89 | 0.67 | 1.12 | .00 | 0.56 | 0.34 | 0.79 | .00 | 0.78 | 0.55 | 1.01 | .00 | ||||
| NP‐AF boundary | 0.78 | 0.61 | 0.95 | .00 | 0.89 | 0.66 | 1.11 | .00 | 0.59 | 0.37 | 0.82 | .00 | 0.80 | 0.57 | 1.02 | .00 | ||||
| NP‐EP boundary | 0.68 | 0.50 | 0.86 | .00 | 0.78 | 0.55 | 1.00 | .00 | 0.24 | 0.02 | 0.47 | .04 | 0.76 | 0.54 | 0.99 | .00 | ||||
| AF to EP disruption | 0.77 | 0.60 | 0.95 | .00 | 0.88 | 0.65 | 1.10 | .00 | 0.58 | 0.35 | 0.80 | .00 | 0.77 | 0.55 | 1.00 | .00 | ||||
Note: P value of less than .0001 is indicated as .00.
2.1.3. Survey to capture feedback of spine community
Next, to capture the opinion of the spine community regarding histopathological features and scoring criteria for the mouse IVD, a detailed survey was designed. The survey was sent out through ORS Spine Section to ~260 spine researchers and an additional ~10 other spine researchers. Forty‐two respondents representing 29 laboratories from around the world (Figure S1A) participated in the survey. However, the survey had over‐representation by one lab (Figure S1A).
A multiple‐choice questionnaire captured the commonly used SOPs for histopathological preparation of mouse IVD samples. Results show that the lumbar (37.04%) and caudal (32.51%) IVDs are the commonly studied spine regions (Figure 4A), processed either by paraffin embedding (49.09%) or for cryosectioning (36.36%) (Figure 4B), sectioned at 5 to 20 μm thickness and mostly in sagittal (45.59%) or coronal (38.24%) plane (Figure 4C). One of the respondents mentioned the use of custom 3‐D histology. Safranin‐O, Fast Green & hematoxylin (SafO/Fast green/H) (32.31%), and hematoxylin and eosin (H&E, 31%) were the commonly used histochemical stains (Figure 4D).
FIGURE 4.

Survey results. Pie charts show percentage response to each category of multiple‐choice questionnaire related to the region of the spine (A), histological preparation (B), the plane of section (C), and histochemical stain (D) commonly used for mouse IVD research. Component band chart show percentage of response to each category on a six‐point Likert scale to questions related to the importance of histological features for pathological grading of specific IVD region (E). Histograms show percentage responses to multiple‐choice questions regarding specific features for scoring NP (f and g) and AF (H). Component band chart show percentage response to close‐ended questions regarding various criteria (I) and scoring range (J) for development of the new scoring system. Histograms show percentage response to multiple‐choice questions regarding future consensus study regarding methods for mouse IVDs (K). NR, not responded (E)
Based on the previous scoring systems for rodent and human IVDs (Figure 3), and pathologies reported in mouse IVDs, 12 , 13 , 14 , 15 , 19 , 20 , 21 , 22 , 47 , 48 a list of scorable histopathological features were included in the survey. The percentage response on a six‐point Likert scale (0, least important and 5, most important) shows that features of NP morphology, cellularity, and fibrosis were considered important (Figure 4E). Moreover, clusters of NP cells (93%), absence/loss of NP cells (83%), number of NP cells (69%), and evenly spread NP cells (67%) were noted as critical features of NP morphology and cellularity (Figure 4F). Matrix disorganization (74%), scar formation and tissue granulation (60%) were noted as key features of NP fibrosis (Figure 4G). Important scorable features of the AF included clefts/fissures, lamellar organization, as well as outward and inward bulging of the AF (Figure 4E). Inclusion of neovascularization of the AF in histopathological scoring was debated, as routine histopathological methods may be insufficient to visualize neovascularization, requiring instead specific staining and methodologies. Enthusiasm to score inner and out AF separately was noted (~60%, Figure 4H). The key features to consider for scoring the EP region included calcification, cartilage disorganization, fibrocartilage, Schmorl's nodes, microfractures/fissure, height/thickness, and the number of EP cells (Figure 4E). Regarding interface features, loss of demarcation between NP and AF, followed by disruption of AF lamellae into the EP and loss of NP and EP boundary were considered important (Figure 4E).
Close‐ended questions regarding scoring criteria showed that most respondents preferred a separate score for each disc region (83%), to generate a cumulative score (71%), and to compare specific levels of the IVD in the spine (76%) (Figure 4I). Inclusion of staining intensity towards the histopathological score and scoring each EP region was not preferred (Figure 4I). The scoring range for each IVD region received mixed responses for 0 to 5 (33.3%), 0 to 3 (31%), and 0 to 4 (23.8%) (Figure 4J).
Regarding opinions for additional outcome measures for future consensus methods for assessment of mouse IVDs, showed highest enthusiasm was reported for assays for ECM content (64.3%), gene expression analysis (61.9%), and disc‐height index (52.4%) (Figure 4K).
2.1.4. List of histological features and scoring categories to quantify mouse IVD pathologies
A new mouse IVD histopathological scoring criterion was developed taking into consideration the naturally occurring mouse IVD pathologies, the previous scoring systems and feedback received from the spine community. Histopathological features for scoring mouse IVDs were classified using a point‐based ordinal scale of equal intervals (0, 1, 2, and 3) to separately grade NP, AF, EP, and the interphase regions (Figures 5, 6, 7, 8). The categories are linearly ordered with a score of 0 representing a normal structure, an increase in number scores increased histopathology, with the highest score indicating severe degeneration. Following discussions on the list of identifiable features, the organization of features for each category, that together inform the linear order of degenerative changes, and after initial test‐run (Data S1), it was decided that NP and AF could be categorized on a 4‐point scale (0‐3); however, EP and interphase could be categorized on a 3‐point scale (0‐2).
Nucleus pulposus: Three critical features considered for scoring NP region include cellularity and morphology, fibrosis, and matrix organization (Figure 5). Cellularity and morphology are scored on the shape, presence of lacunae, and relative quantity of the NP cells. The presence of fibrous lamella between cells and in NP space is used to score fibrosis. Matrix organization is scored considering consolidation into clumps and disorganization. NP tissue with features such as cell loss, fibrous lamella, and matrix disorganization is considered severely degenerated.
Annulus fibrosus: Four crucial features considered for scoring AF included cellularity, bulging, lamellar organization, and clefts/fissures (Figure 6). Histopathological scoring of AF includes a change in cell shape progressing from inner to outer AF, protrusion or bugling of AF both inwards and outwards, disorganization or loss of AF lamella and structure, and presence of clefts and fissures between AF lamellae. A higher score for each feature indicates progression towards degeneration. AF cells can be distinguished from NP at the boundary by their presence in lamellae, which are absent for NP cells.
Endplate: Three features for scoring the EP region included cellularity, fissures/ microfractures, and the presence of Schmorl's nodes (Figure 7). Cellularity was scored based on EP cells in defined layers and not in lacunae. The EPs that showing increased cellular disorganization, with fissures and microfractures and Schmorl's nodes, would receive higher scores. Schmorl's nodes are scored as either absent (0) or present (2).
Interface: Features scored at the interface included cellularity, NP‐AF boundary, NP‐EP boundary, and the AF lamella disruption into the EP (Figure 8). The presence of cells in their respective compartments or at the border and in lacunae scored the cellularity at the interface. IVDs that show undefined boundaries between each compartment would receive higher scores.
FIGURE 5.
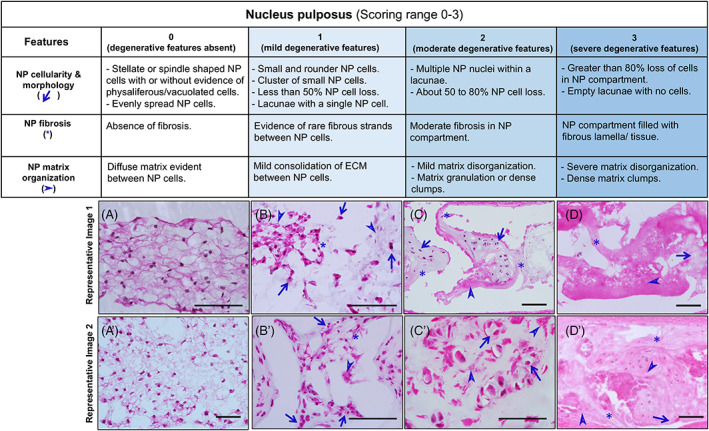
Histopathological scoring of mouse NP region. List of features, detailed criteria specific to each scoring category (0, 1, 2, and 3), and two representative images specific for each category (A‐D′) for histopathological scoring of NP region of the mouse IVD. H&E‐stained images in the coronal plane. Scale bar = 100 μm
FIGURE 6.

Histopathological scoring of mouse AF region. List of features, detailed criteria specific to each scoring category (0, 1, 2, and 3), and two representative images specific for each category (A‐D′) for histopathological scoring of AF region of the mouse IVD. H&E‐stained images in the coronal plane. Scale bar = 100 μm
FIGURE 7.

Histopathological scoring of mouse EP region. List of features, detailed criteria specific to each scoring category (0, 1, and 2), and two representative images specific for each category (A‐C) for histopathological scoring of EP region of mouse IVD. H&E‐stained images in the coronal plane. Scale bar = 100 μm
FIGURE 8.

Histopathological scoring of mouse IVD interface region. List of features, detailed criteria specific to each scoring category (0, 1, and 2), and two representative images specific for each category (A‐C′) for histopathological scoring of the interface region between each compartment of mouse IVD. H&E‐stained images in the coronal plane. Scale bar = 100 μm
2.1.5. Guidance on scoring range and adaptation
Overall, 14 features were listed for histopathological scoring of the mouse IVDs. Based on discussions during the development of the new scoring criteria, and feedback received from the survey participants, it was agreed that there are some basic SOPs and controls that should be considered during experimental design for histopathological analysis.
All features within each IVD region being analyzed should be scored.
Adding the scores for features within a specific IVD region will inform about the pathology of that region where highest score will be 9 for NP, 12 for AF, 6 for EP, and 8 for the interface (Figure 9A).
Total scores from each region can be combined to generate a cumulative score for the entire IVD where the maximum total score of a severely degenerated IVD will be 35 (Figure 9B). By adding scores from each IVD region and considering a range (mean score ± 30%), we propose scoring range to classify normal (0‐6), mild (7–13), moderate (14–25), and severe IVD degeneration (26–35) (Figure 9B).
IVDs between cohorts should be analyzed from the same spine level, and sections should be prepared using the same SOP (fixation, serial sections, plane, and thickness of section).
Sections only from the mid‐plane region should be analyzed for histopathological grading.
Slides from all biological replicates from each cohort should be stained at the same time.
Comparisons should be done using age‐matched littermate controls for genetic studies and surgical models.
A significantly higher histopathological score of IVDs belonging to the experimental cohort compared to littermate controls, or to a younger mouse IVD for studies of natural aging, should be used to quantify the degree of degeneration.
A significantly lower histopathology score for the IVDs belonging to the regenerative cohort compared to age‐matched littermate controls may inform on the extent of prevention of degeneration or regeneration.
All raters should be trained on the new scoring criteria and have to substantial or almost perfect agreement (Fleiss's κ greater than 0.61) before proceeding to scoring of experimental samples.
Atleast two raters, who are blinded to the experimental conditions should independently score each image. Average of the two raters should be used for further analysis.
FIGURE 9.

Scoring range and interpretation. Stacked histogram for the 14 features shows the scoring range and interpretation of the scoring category (normal, mild, moderate, and severe) for each IVD region (A) or the entire disc (B)
2.1.6. Structure features and preparation artifacts not to be interpreted as IVD pathologies
When scoring mouse IVD histopathology, the following normal structures and artifacts due to histological preparation and staining processes listed below should not be scored.
The AF layers continue to align and organize collagenous lamellae during early postnatal development, and cells appear rounder evident in IVD tissues from mice at P7 (Figure 10A), ~1 M (Figure 10C), and ~2 M (Figure 10D). These normal structures should not be misinterpreted as loss of organization of AF lamellae or loss of cellularity with round cells observed during pathology, when AF cells no longer align in layers and may reside in lacunae.
During early neonatal development, as the AF lamella organize, they continue to integrate into the EP as evident in IVD tissues from mice at P7 (Figure 10A) ~1 M (Figure 10C), and ~2 M (Figure 10D), and this process continues until skeletal maturity. Hence, the lack of distinction between AF and EP in developing IVDs should not be mistaken as loss of demarcation/ boundary due to IVD pathology.
The separation of the entire AF lamellae (Figure 10C,D) parallel to the adjacent lamella, which is otherwise cellular, could be due to technical artifacts and should not be scored as clefts and fissures.
The midline in the disc formed at the site where the left and right sclerotome merged during the development and formation of the axial skeleton and continues to be visible as a notch shown in the EP, as evident in IVD from mice at P7 (Figure 10A) and 24 M (Figure 10B) old mouse lumbar IVDs. This notch‐like feature evident in the mid‐coronal sections is a normal feature and should not be considered as Schmorl's node, fissure, or micro‐fracture in the EP.
Large cracks or tears in the EP may occur due to histological artifacts, which will be large and empty, and should not be scored as micro‐fractures or fissures (Figure 10E). Schmorl's node shows fibrous matrix infiltration from NP region into the EP and extends to the vertebra GP.
When scoring IVD pathologies, raters should distinguish the sacral IVD from the other regions of the spine. Mineralization of the sacral IVD during adolescence (~1 M of age in mice 46 ) is a normal part of spine development (Figure 10F, ~2 M old). Such mineralization features and vascular invasion are not observed even until ~30 M of age in the IVDs from the other spine regions. Hence, sacral IVDs should not be included in comparisons while grading IVDs from the cervical, thoracic, lumbar, and coccygeal spine.
Clumping of NP cells into a central mass can occur due to improper fixation and embedding (Figure 10G) and should be carefully evaluated.
IVDs of same spinal level within the same spine region should be compared in histological analysis.
FIGURE 10.

Normal features and technical artifacts for consideration. H&E stained images of mouse IVDs sectioned in coronal plane. The midline in the IVD formed during embryonic development and formation of axial skeleton is visible as a notch in the center of EP ( ) in P7 (A) and 24 M (B) old mouse lumbar discs, which is a normal feature. The immature AF in neonatal mouse IVDs do not have fully organized layers (
 ) and cells appear rounder as shown in P7 (A), ∼1 M (C), and ∼2 M (D) old mouse lumbar discs, which is a normal feature. During neonatal development, the AF lamella continues to integrate into the EP as shown by
  in P7 (A) ∼1 M (C), and ∼2 M (D) old mouse lumbar discs. The separation of entire AF lamellae (↓, C and D) parallel to the adjacent lamella which is otherwise cellular could be due to technical artifacts and are not features of clefts and fissures. Cracks or tears in the EP (
 ) may occur due to technical artifacts and are not features of micro‐fracture or fissures (E). Mineralization of sacral disc during adolescence (∼1 M of age in mice) is normal part of spine development (F, ∼2 M old). Clumping of NP cells into central mass can occur due to improper fixation and embedding (G), and is not a feature of NP pathology. Scale bar = 100 μm
2.2. Test‐run to check the reliability of scoring criteria for mouse IVD pathologies
2.2.1. Description of models utilized and raters
The 14 histopathological features and scoring criteria for quantitative evaluation of mouse IVD histopathology were tested using images of 214 individual mouse IVDs collected from seven different laboratories. Scoring was carried out using digital images and not on actual histological slides. The images represented various histological methods, mouse strains, ages, and IVD degeneration models (Figure 11). Moreover, the IVD images were captured at various magnifications, which also tested whether the sections needed to be analyzed under a microscope to observe the features described in the scoring method.
FIGURE 11.

Samples employed for testing the scoring criteria. Cross‐tabulation results plotted as multi‐layered donut where each of the nine layers shows the frequency distribution of samples in each factor (or variable) used to test the new Mouse intErveRtebral disC histopathologY scoring criteria
2.2.2. Testing inter‐rater agreement for the histopathological scoring features
The 14 features were scored on 214 de‐identified IVD images by 12 blinded and independent raters with varying academic background and experience evaluating mouse IVD pathologies, representing seven different labs (Figure 12A). Six images reported to have poor resolution were removed, and agreement results are based on scores of 208 de‐identified IVD images only. The histopathological scores were analyzed for agreement using Fleiss' multi‐rater kappa (κ) test for reliability. As most labs may use only two raters for histopathological scoring studies, first, we tested the inter‐rater agreement between a set of two blinded independent raters who scored the same images. Scoring results from two experienced (or trained) raters from Lab‐A, and two novice raters from Lab‐B were analyzed for agreement (Figure 12B, and Table 2). Results show substantial to almost perfect overall agreement (κ) by experienced raters (criteria per Reference 49). The novice raters had fair, moderate and substantial overall κ between different categories. Detailed analysis of each scoring category (0‐2/3) showed substantial to almost perfect κ values for normal structure (category 0), and the most degenerative category (three for NP and AF, and two for EP and interface) irrespective of training for all 14 features. Fair to a moderate κ values were observed for the middle categories of mild to moderate (one and two for NP and AF, and one for EP and interface) IVD degeneration (Figure 12B, and Table 2). Next, the novice raters were trained by the faculty member by reviewing each of the 14 features for all scoring grades and how to distinguish them using random images of mouse IVDs from normal and degeneration models. Then we tested whether training could improve inter‐rater agreement of novice raters to substantial or almost perfect agreement; and, if so, how many rounds of training were required. Novice raters were trained on 75 de‐identified images. At the fourth round of scoring the Fleiss's κ test showed a dramatic improvement, with substantial to almost perfect overall κ for all features between the raters, and for most features in individual scoring category (Figure 12B, and Table 2). A few features for scoring category of 1 and 2 continued to have only fair agreement, which might have improved further with training.
FIGURE 12.

Reliability test of the new Mouse intErveRtebral disC histopathologY scoring system. Cross‐tabulation results plotted as multi‐layered donut showing the frequency distribution of raters that tested the scoring criteria (A). The heat map shows the results of Fleiss's kappa (κ) test for inter‐rater (B and C) and intra‐rater (E) reliability. A stacked bar chart shows the relative percentage of higher κ scores for histopathological features between each set of comparison including H&E, SafraninO/Fast green and hematoxylin (SafO), and FAST stained IVDs images (D)
2.2.3. Effect of histochemical stains on inter‐rater agreement
As the survey showed mixed responses for choice of histochemical staining, next we compared the reliability of the 14 features using mouse IVD images prepared using three different histological staining techniques. The inter‐rater agreement was calculated using Fleiss's κ and overall agreement was analyzed (Figure 12C, and Table 3). First, the κ was calculated between all raters, experienced raters, and novice raters who scored the same 208 images of mouse IVDs. One experienced rater did not score six images due to conflict; hence, the number of images was reduced from 208 to 202 for analysis in the all‐raters and experienced rater categories. Next, we tested reliability for features based on histochemical stain and compared data from images of mouse IVDs sections stained with H&E (41 images), SafO/Fast green/H, (44 images), and FAST (36 images) (Figure 12C, and Table 3). Relative comparison of higher multi‐rater κ values for the 14 histopathological features between the three histochemical stains shows highest relative agreement for H&E‐stained images for 12 out of 14 features (85.7%) by all raters, 9 out of 14 features (64.3%) by experienced raters, and 11 out of 14 features (78.6%) by novice raters compared to SafO/Fast green/H‐stained images scored by the same raters (Figure 12D, Table 3). Agreement for IVD images stained with SafO/Fast green/H was higher for 10 out of 14 features (71.4%) by all raters, 10 out of 14 features (71.4%) by experienced rater, and 8 out of 14 features (57.1%) for novice raters compared to sections stained with FAST scored by the same raters (Figure 12D, Table 3). Agreement with FAST‐stained images was higher than H&E for only one out of 14 features (7.14%) in the experienced rater's category only.
TABLE 3.
Fleiss's multi‐rater kappa (κ) to test the effect of histochemical staining on reliability of the proposed 14 histopathological features
| All raters | ||||||||||||||||
|---|---|---|---|---|---|---|---|---|---|---|---|---|---|---|---|---|
| Features | All stains (208 IVDs, 10 raters) | H&E (41 IVDs, 12 raters) | SafO/FG/H (44 IVDs, 11 raters) | FAST (36 IVDs, 12 raters) | ||||||||||||
| κ | 95% CI | κ | 95% CI | κ | 95% CI | κ | 95% CI | |||||||||
| Overall | LB | UB | P | Overall | LB | UB | P | Overall | LB | UB | P | Overall | LB | UB | P | |
| NP Cellularity | 0.54 | 0.53 | 0.56 | .00 | 0.53 | 0.51 | 0.56 | .00 | 0.46 | 0.44 | 0.49 | .00 | 0.40 | 0.37 | 0.42 | .00 |
| NP Fibrosis | 0.49 | 0.48 | 0.50 | .00 | 0.45 | 0.42 | 0.47 | .00 | 0.44 | 0.41 | 0.47 | .00 | 0.35 | 0.33 | 0.37 | .00 |
| NP ECM | 0.51 | 0.49 | 0.52 | .00 | 0.50 | 0.48 | 0.52 | .00 | 0.43 | 0.40 | 0.46 | .00 | 0.37 | 0.34 | 0.39 | .00 |
| AF Cellularity | 0.36 | 0.35 | 0.38 | .00 | 0.45 | 0.43 | 0.48 | .00 | 0.35 | 0.32 | 0.37 | .00 | 0.32 | 0.29 | 0.34 | .00 |
| AF Bulging | 0.28 | 0.27 | 0.30 | .00 | 0.44 | 0.41 | 0.46 | .00 | 0.22 | 0.20 | 0.25 | .00 | 0.29 | 0.27 | 0.31 | .00 |
| AF Lamellae | 0.31 | 0.30 | 0.32 | .00 | 0.40 | 0.37 | 0.42 | .00 | 0.24 | 0.21 | 0.26 | .00 | 0.30 | 0.28 | 0.32 | .00 |
| AF Clefts/ fissures | 0.24 | 0.22 | 0.25 | .00 | 0.28 | 0.26 | 0.30 | .00 | 0.21 | 0.18 | 0.23 | .00 | 0.29 | 0.27 | 0.32 | .00 |
| EP Cellularity | 0.32 | 0.31 | 0.34 | .00 | 0.37 | 0.35 | 0.40 | .00 | 0.33 | 0.30 | 0.36 | .00 | 0.23 | 0.20 | 0.25 | .00 |
| EP Fissures | 0.18 | 0.17 | 0.20 | .00 | 0.30 | 0.28 | 0.33 | .00 | 0.11 | 0.08 | 0.14 | .00 | 0.16 | 0.13 | 0.19 | .00 |
| Schmorl's node | 0.18 | 0.16 | 0.20 | .00 | 0.61 | 0.57 | 0.65 | .00 | 0.14 | 0.09 | 0.18 | .00 | 0.00 | −0.05 | 0.04 | .93 |
| Interface Cellularity | 0.46 | 0.44 | 0.47 | .00 | 0.39 | 0.36 | 0.41 | .00 | 0.40 | 0.37 | 0.43 | .00 | 0.29 | 0.26 | 0.32 | .00 |
| NP‐AF boundary | 0.61 | 0.59 | 0.62 | .00 | 0.58 | 0.55 | 0.61 | .00 | 0.54 | 0.51 | 0.56 | .00 | 0.42 | 0.39 | 0.44 | .00 |
| NP‐EP boundary | 0.50 | 0.48 | 0.51 | .00 | 0.35 | 0.32 | 0.38 | .00 | 0.56 | 0.53 | 0.59 | .00 | 0.34 | 0.31 | 0.37 | .00 |
| AF to EP disruption | 0.31 | 0.30 | 0.33 | .00 | 0.37 | 0.34 | 0.39 | .00 | 0.30 | 0.27 | 0.33 | .00 | 0.28 | 0.25 | 0.31 | .00 |
| Experienced raters | ||||||||||||||||
|---|---|---|---|---|---|---|---|---|---|---|---|---|---|---|---|---|
| Features | All stains (208 IVDs, 6 raters) | H&E (41 IVDs, 8 raters) | SafO/FG/H (44 IVDs, 7 raters) | FAST (36 IVDs, 8 raters) | ||||||||||||
| κ | 95% CI | κ | 95% CI | κ | 95% CI | κ | 95% CI | |||||||||
| Overall | LB | UB | P | Overall | LB | UB | P | Overall | LB | UB | P | Overall | LB | UB | P | |
| NP Cellularity | 0.55 | 0.52 | 0.57 | .00 | 0.52 | 0.48 | 0.56 | .00 | 0.40 | 0.36 | 0.45 | .00 | 0.40 | 0.37 | 0.44 | .00 |
| NP Fibrosis | 0.50 | 0.48 | 0.52 | .00 | 0.42 | 0.38 | 0.45 | .00 | 0.38 | 0.33 | 0.42 | .00 | 0.40 | 0.36 | 0.43 | .00 |
| NP ECM | 0.53 | 0.51 | 0.55 | .00 | 0.46 | 0.43 | 0.50 | .00 | 0.40 | 0.36 | 0.45 | .00 | 0.40 | 0.36 | 0.43 | .00 |
| AF Cellularity | 0.40 | 0.38 | 0.42 | .00 | 0.47 | 0.43 | 0.50 | .00 | 0.34 | 0.30 | 0.38 | .00 | 0.37 | 0.34 | 0.41 | .00 |
| AF Bulging | 0.26 | 0.24 | 0.28 | .00 | 0.41 | 0.37 | 0.45 | .00 | 0.17 | 0.13 | 0.21 | .00 | 0.29 | 0.25 | 0.32 | .00 |
| AF Lamellae | 0.31 | 0.29 | 0.33 | .00 | 0.35 | 0.31 | 0.38 | .00 | 0.23 | 0.19 | 0.27 | .00 | 0.35 | 0.31 | 0.38 | .00 |
| AF Clefts/fissures | 0.24 | 0.22 | 0.26 | .00 | 0.28 | 0.24 | 0.31 | .00 | 0.17 | 0.12 | 0.21 | .00 | 0.34 | 0.31 | 0.38 | .00 |
| EP Cellularity | 0.33 | 0.31 | 0.36 | .00 | 0.34 | 0.29 | 0.38 | .00 | 0.36 | 0.31 | 0.41 | .00 | 0.17 | 0.13 | 0.22 | .00 |
| EP Fissures | 0.22 | 0.19 | 0.25 | .00 | 0.28 | 0.24 | 0.32 | .00 | 0.11 | 0.06 | 0.16 | .00 | 0.17 | 0.12 | 0.21 | .00 |
| Schmorl's node | 0.28 | 0.25 | 0.32 | .00 | 0.70 | 0.63 | 0.77 | .00 | 0.12 | 0.05 | 0.20 | .00 | −0.01 | −0.08 | 0.06 | .74 |
| Interface Cellularity | 0.53 | 0.50 | 0.55 | .00 | 0.39 | 0.35 | 0.43 | .00 | 0.49 | 0.44 | 0.54 | .00 | 0.29 | 0.24 | 0.33 | .00 |
| NP‐AF boundary | 0.69 | 0.67 | 0.72 | .00 | 0.53 | 0.49 | 0.58 | .00 | 0.62 | 0.57 | 0.67 | .00 | 0.41 | 0.37 | 0.46 | .00 |
| NP‐EP boundary | 0.62 | 0.59 | 0.65 | .00 | 0.30 | 0.25 | 0.34 | .00 | 0.74 | 0.68 | 0.79 | .00 | 0.34 | 0.30 | 0.39 | .00 |
| AF to EP disruption | 0.38 | 0.35 | 0.40 | .00 | 0.33 | 0.29 | 0.37 | .00 | 0.40 | 0.35 | 0.45 | .00 | 0.30 | 0.26 | 0.35 | .00 |
| Novice raters | ||||||||||||||||
|---|---|---|---|---|---|---|---|---|---|---|---|---|---|---|---|---|
| Features | All stains (208 IVDs, 4 raters) | H&E (41 IVDs, 4 raters) | SafO/FG/H (44 IVDs, 4 raters) | FAST (36 IVDs, 4 raters) | ||||||||||||
| κ | 95% CI | κ | 95% CI | κ | 95% CI | κ | 95% CI | |||||||||
| Overall | LB | UB | P | Overall | LB | UB | P | Overall | LB | UB | P | Overall | LB | UB | P | |
| NP Cellularity | 0.56 | 0.53 | 0.60 | .00 | 0.55 | 0.47 | 0.63 | .00 | 0.58 | 0.49 | 0.67 | .00 | 0.39 | 0.31 | 0.47 | .00 |
| NP Fibrosis | 0.52 | 0.48 | 0.55 | .00 | 0.56 | 0.48 | 0.64 | .00 | 0.58 | 0.50 | 0.67 | .00 | 0.34 | 0.26 | 0.42 | .00 |
| NP ECM | 0.49 | 0.46 | 0.53 | .00 | 0.58 | 0.50 | 0.66 | .00 | 0.47 | 0.39 | 0.56 | .00 | 0.33 | 0.25 | 0.41 | .00 |
| AF Cellularity | 0.33 | 0.30 | 0.36 | .00 | 0.39 | 0.32 | 0.47 | .00 | 0.40 | 0.33 | 0.48 | .00 | 0.18 | 0.10 | 0.26 | .00 |
| AF Bulging | 0.31 | 0.28 | 0.35 | .00 | 0.50 | 0.41 | 0.59 | .00 | 0.27 | 0.19 | 0.35 | .00 | 0.30 | 0.21 | 0.39 | .00 |
| AF Lamellae | 0.37 | 0.34 | 0.40 | .00 | 0.49 | 0.41 | 0.58 | .00 | 0.37 | 0.29 | 0.44 | .00 | 0.23 | 0.15 | 0.31 | .00 |
| AF Clefts/ fissures | 0.28 | 0.25 | 0.32 | .00 | 0.27 | 0.19 | 0.34 | .00 | 0.34 | 0.27 | 0.41 | .00 | 0.25 | 0.17 | 0.33 | .00 |
| EP Cellularity | 0.30 | 0.26 | 0.34 | .00 | 0.46 | 0.37 | 0.56 | .00 | 0.17 | 0.07 | 0.27 | .00 | 0.32 | 0.23 | 0.42 | .00 |
| EP Fissures | 0.19 | 0.15 | 0.24 | .00 | 0.37 | 0.27 | 0.46 | .00 | 0.03 | −0.07 | 0.13 | .57 | 0.20 | 0.10 | 0.29 | .00 |
| Schmorl's node | 0.04 | −0.02 | 0.10 | .16 | 0.52 | 0.40 | 0.65 | .00 | 0.06 | −0.06 | 0.18 | .35 | −0.08 | −0.21 | 0.06 | .27 |
| Interface Cellularity | 0.40 | 0.36 | 0.44 | .00 | 0.48 | 0.39 | 0.57 | .00 | 0.20 | 0.11 | 0.28 | .00 | 0.29 | 0.20 | 0.39 | .00 |
| NP‐AF boundary | 0.53 | 0.49 | 0.57 | .00 | 0.74 | 0.64 | 0.84 | .00 | 0.36 | 0.27 | 0.45 | .00 | 0.35 | 0.25 | 0.44 | .00 |
| NP‐EP boundary | 0.44 | 0.40 | 0.48 | .00 | 0.58 | 0.49 | 0.68 | .00 | 0.30 | 0.21 | 0.39 | .00 | 0.32 | 0.22 | 0.41 | .00 |
| AF to EP disruption | 0.28 | 0.24 | 0.32 | .00 | 0.51 | 0.42 | 0.60 | .00 | 0.18 | 0.09 | 0.27 | .00 | 0.29 | 0.19 | 0.38 | .00 |
Note: P value of less than .0001 is indicated as .00.
Abbreviation: SafO/FG/H, Safranin‐O/ Fast green and hematoxylin.
2.2.4. Magnitude of agreement between raters for the histopathological features
Additional algorithms were used to determine the magnitude of agreement between raters for observational data including Cohen's weighted kappa (κw) and the intra‐class correlation coefficient (ICC). These algorithms were employed in previous IVD histopathological reliability studies (Table 1). We compared the reliability of the 14 features listed in this study using Cohen's κw and ICC, allowing comparison of our scoring criteria with previous scoring methods (Table 1). The ICC results show excellent agreement for EP fractures and Schmorl's node and almost perfect agreement for all other 12 features (Table 4). The results of the Cohen's κw indicate excellent and substantial agreement for all 14 features (Table 4). Comparison of the results of the three reliability tests indicates that fair to moderate strength of agreement by Fleiss's κ is similar to excellent strength of agreement by ICC and Cohen's κw tests due to the difference in algorithms employed by each of these tests (Table 4).
TABLE 4.
Testing the inter‐rater reliability of the proposed 14 histopathological features by intraclass correlation coefficient (ICC) and Cohen's weighted (κw)
| Features | ICC coefficient (202 IVDs, 11 raters) | Cohen's weighted κw (208 IVDs, 2 experienced raters) | ||||||
|---|---|---|---|---|---|---|---|---|
| 95% CI | Weighted | 95% CI | ||||||
| ICC | LB | UB | P | κw | LB | UB | P | |
| NP Cellularity | .99c | 0.98 | 0.99 | .00 | 0.86 | 0.82 | 0.90 | .00 |
| NP Fibrosis | .98c | 0.98 | 0.98 | .00 | 0.81 | 0.76 | 0.86 | .00 |
| NP ECM | .98c | 0.98 | 0.99 | .00 | 0.77 | 0.72 | 0.83 | .00 |
| AF Cellularity | .96c | 0.95 | 0.97 | .00 | 0.76 | 0.70 | 0.83 | .00 |
| AF Bulging | .93c | 0.90 | 0.95 | .00 | 0.81 | 0.75 | 0.87 | .00 |
| AF Lamellae | .95c | 0.94 | 0.96 | .00 | 0.78 | 0.72 | 0.84 | .00 |
| AF Clefts/ fissures | .92c | 0.90 | 0.94 | .00 | 0.83 | 0.77 | 0.88 | .00 |
| EP cellularity | .91c | 0.88 | 0.93 | .00 | 0.88 | 0.82 | 0.93 | .00 |
| EP fractures | .79c | 0.73 | 0.85 | .00 | 0.77 | 0.70 | 0.84 | .00 |
| Schmorl's node | .70c | 0.63 | 0.76 | .00 | 0.86 | 0.57 | 1.14 | .00 |
| Interface Cellularity | .96c | 0.94 | 0.97 | .00 | 0.95 | 0.91 | 0.99 | .00 |
| NP‐AF boundary | .97c | 0.97 | 0.98 | .00 | 0.93 | 0.90 | 0.97 | .00 |
| NP‐EP boundary | .96c | 0.95 | 0.97 | .00 | 0.84 | 0.77 | 0.91 | .00 |
| AF to EP disruption | .93c | 0.91 | 0.94 | .00 | 0.82 | 0.76 | 0.88 | .00 |
2.2.5. Intra‐rater agreement test for reproducibility
Next, to determine the consistency in observations using the scoring criteria, intra‐rater reliability was tested for two blinded raters who scored the 14 features for the same 75 de‐identified IVD images. The strength of agreement was tested using Fleiss's κ, which shows substantial to almost perfect agreement for overall κ for the 14 features by each rater (Figure 12E, and Table 5), indicating that scoring using the new histopathological method is reproducible. Moreover, substantial to almost perfect agreement was observed for κ of each scoring category by both raters (Table 5).
TABLE 5.
Fleiss's kappa (κ) test of agreement for intra‐ rater reliability for the 14 histopathological features
| Features | κ | 95% CI | κ | 95% CI | κ | 95% CI | κ | 95% CI | κ | 95% CI | ||||||||||
|---|---|---|---|---|---|---|---|---|---|---|---|---|---|---|---|---|---|---|---|---|
| Overall | LB | UB | P | Score‐0 | LB | UB | P | Score‐1 | LB | UB | P | Score‐2 | LB | UB | P | Score‐3 | LB | UB | P | |
| Rater 1 | ||||||||||||||||||||
| NP Cellularity | 0.94 | 0.79 | 1.08 | .00 | 0.97 | 0.75 | 1.20 | .00 | 0.91 | 0.68 | 1.13 | .00 | 0.84 | 0.62 | 1.07 | .00 | 0.96 | 0.73 | 1.19 | .00 |
| NP Fibrosis | 0.87 | 0.72 | 1.02 | .00 | 0.89 | 0.67 | 1.12 | .00 | 0.75 | 0.52 | 0.97 | .00 | 0.84 | 0.62 | 1.07 | .00 | 0.92 | 0.69 | 1.15 | .00 |
| NP ECM | 0.91 | 0.76 | 1.06 | .00 | 0.95 | 0.72 | 1.17 | .00 | 0.84 | 0.62 | 1.07 | .00 | 0.86 | 0.63 | 1.09 | .00 | 0.92 | 0.69 | 1.15 | .00 |
| AF Cellularity | 0.79 | 0.64 | 0.94 | .00 | 0.94 | 0.72 | 1.17 | .00 | 0.46 | 0.23 | 0.68 | .00 | 0.41 | 0.18 | 0.64 | .00 | 0.89 | 0.66 | 1.12 | .00 |
| AF Bulging | 0.85 | 0.69 | 1.00 | .00 | 0.92 | 0.69 | 1.15 | .00 | 0.75 | 0.52 | 0.98 | .00 | 0.31 | 0.08 | 0.53 | .00 | 0.96 | 0.73 | 1.19 | .00 |
| AF Lamellae | 0.86 | 0.71 | 1.01 | .00 | 0.89 | 0.65 | 1.11 | .00 | 0.69 | 0.46 | 0.91 | .00 | 0.84 | 0.62 | 1.07 | .00 | 0.91 | 0.69 | 1.14 | .00 |
| AF Clefts/ fissures | 0.91 | 0.77 | 1.06 | .00 | 0.92 | 0.69 | 1.15 | .00 | 0.80 | 0.58 | 1.03 | .00 | 1.00 | 0.77 | 1.23 | .00 | 0.96 | 0.73 | 1.18 | .00 |
| EP Cellularity | 0.88 | 0.71 | 1.04 | .00 | 0.97 | 0.75 | 1.20 | .00 | 0.77 | 0.55 | 1.00 | .00 | 0.82 | 0.60 | 1.05 | .00 | ||||
| EP Fissures | 0.85 | 0.68 | 1.01 | .00 | 0.91 | 0.69 | 1.14 | .00 | 0.74 | 0.51 | 0.96 | .00 | 0.86 | 0.63 | 1.08 | .00 | ||||
| Schmorl's node | 1.00 | 0.77 | 1.23 | .00 | 1.00 | 0.77 | 1.23 | .00 | 1.00 | 0.77 | 1.23 | .00 | ||||||||
| Interface Cellularity | 0.86 | 0.70 | 1.03 | .00 | 0.95 | 0.72 | 1.17 | .00 | 0.72 | 0.50 | 0.95 | .00 | 0.86 | 0.64 | 1.09 | .00 | ||||
| NP‐AF boundary | 0.84 | 0.67 | 1.01 | .00 | 0.85 | 0.63 | 1.08 | .00 | 0.62 | 0.40 | 0.85 | .00 | 0.96 | 0.74 | 1.19 | .00 | ||||
| NP‐EP boundary | 0.90 | 0.71 | 1.10 | .00 | 0.93 | 0.71 | 1.16 | .00 | 0.55 | 0.32 | 0.78 | .00 | 0.96 | 0.74 | 1.19 | .00 | ||||
| AF to EP disruption | 0.85 | 0.68 | 1.03 | .00 | 0.90 | 0.68 | 1.13 | .00 | 0.63 | 0.40 | 0.86 | .00 | 0.91 | 0.69 | 1.14 | .00 | ||||
| Rater 2 | ||||||||||||||||||||
| NP Cellularity | 0.91 | 0.75 | 1.06 | .00 | 0.94 | 0.72 | 1.17 | .00 | 0.65 | 0.42 | 0.87 | .00 | 0.86 | 0.63 | 1.09 | .00 | 0.96 | 0.74 | 1.19 | .00 |
| NP Fibrosis | 0.88 | 0.72 | 1.03 | .00 | 0.94 | 0.72 | 1.17 | .00 | 0.75 | 0.52 | 0.97 | .00 | 0.57 | 0.35 | 0.80 | .00 | 0.96 | 0.73 | 1.19 | .00 |
| NP ECM | 0.93 | 0.78 | 1.08 | .00 | 0.97 | 0.75 | 1.20 | .00 | 0.82 | 0.59 | 1.05 | .00 | 0.86 | 0.63 | 1.09 | .00 | 0.96 | 0.73 | 1.19 | .00 |
| AF Cellularity | 0.91 | 0.76 | 1.06 | .00 | 1.00 | 0.77 | 1.23 | .00 | 0.94 | 0.71 | 1.17 | .00 | 0.64 | 0.41 | 0.86 | .00 | 0.87 | 0.65 | 1.10 | .00 |
| AF Bulging | 0.79 | 0.64 | 0.94 | .00 | 0.80 | 0.58 | 1.03 | .00 | 0.77 | 0.54 | 1.00 | .00 | 0.57 | 0.35 | 0.80 | .00 | 0.86 | 0.64 | 1.09 | .00 |
| AF Lamellae | 0.83 | 0.68 | 0.98 | .00 | 0.89 | 0.66 | 1.11 | .00 | 0.77 | 0.54 | 1.00 | .00 | 0.47 | 0.25 | 0.70 | .00 | 0.91 | 0.69 | 1.14 | .00 |
| AF Clefts/fissures | 0.93 | 0.78 | 1.08 | .00 | 0.97 | 0.75 | 1.20 | .00 | 0.92 | 0.69 | 1.14 | .00 | 0.80 | 0.57 | 1.03 | .00 | 0.96 | 0.73 | 1.19 | .00 |
| EP Cellularity | 0.93 | 0.76 | 1.09 | .00 | 1.00 | 0.77 | 1.23 | .00 | 0.86 | 0.64 | 1.09 | .00 | 0.87 | 0.65 | 1.10 | .00 | ||||
| EP Fissures | 0.76 | 0.59 | 0.94 | .00 | 0.82 | 0.60 | 1.05 | .00 | 0.68 | 0.46 | 0.91 | .00 | 0.77 | 0.54 | 1.00 | .00 | ||||
| Schmorl's node | 1.00 | 0.77 | 1.23 | .00 | 1.00 | 0.77 | 1.23 | .00 | .00 | 1.00 | 0.77 | 1.23 | .00 | |||||||
| Interface Cellularity | 0.98 | 0.81 | 1.14 | .00 | 1.00 | 0.77 | 1.23 | .00 | 0.96 | 0.73 | 1.19 | .00 | 0.96 | 0.73 | 1.18 | .00 | ||||
| NP‐AF boundary | 0.83 | 0.67 | 1.00 | .00 | 0.94 | 0.72 | 1.17 | .00 | 0.77 | 0.55 | 1.00 | .00 | 0.72 | 0.49 | 0.95 | .00 | ||||
| NP‐EP boundary | 0.84 | 0.67 | 1.00 | .00 | 0.94 | 0.71 | 1.17 | .00 | 0.68 | 0.45 | 0.91 | .00 | 0.81 | 0.59 | 1.04 | .00 | ||||
| AF to EP disruption | 0.92 | 0.75 | 1.09 | .00 | 0.94 | 0.71 | 1.17 | .00 | 0.85 | 0.62 | 1.07 | .00 | 0.95 | 0.73 | 1.18 | .00 | ||||
Note: P value of less than .0001 is indicated as .00.
These analyses establish substantial agreement and reliability of the scoring criteria by trained and novice raters using several mouse models representing healthy and degenerated IVDs and from P7 to 28 M of age, while controlling for various factors including sex, age, mouse strain, and SOPs for histological preparation.
2.3. Validation of the sensitivity and specificity of the new IVD scoring system by applying machine learning approaches
Next, we validated the sensitivity and specificity of the new mouse IVD histopathological scoring system for predictive modeling using both unsupervised and supervised machine learning algorithms. To do so, scores for 14 features generated by 12 blinded raters for 214 IVD images were used.
2.3.1. Correlation of severity of histopathology based on scoring criteria
Heatmap shows the mean score by 12 raters for the 214 IVDs arranged in columns and in the same order for all 14 histopathological features stacked in rows. A visual correlation between scores of each feature in a given IVD is observed (Figure 13A,B). Schmorl's nodes were identified only in a few IVDs (Figure 13B). Pearson product moment correlation (r) analysis for the relationship between the 14 histopathological features shows positive and statistically significant Pearson's coefficient between all the features of NP, AF, and the interface region (r > .83, P < .000001 for all, Figure 13C, Table S1). While Pearson's coefficient between cellularity and clefts/ fissures in EP was high (r > .7, P < .000001), the strength of correlation of the 13 histopathological features with that for Schmorl's node was relatively lower (r ~.36 to .5), but positive, and significant (P < .000001). The lower r between the 13 histopathological features and EP Schmorl's node may be due to the rare occurrence of Schmorl's nodes in the mouse IVDs from both lumbar and coccygeal region relative to the other features of IVD pathologies. Overall, the Pearson's coefficient r shows a strong and linear relationship between the 14 histopathological features, and as expected, similar to that observed by ICC (Table 4).
FIGURE 13.
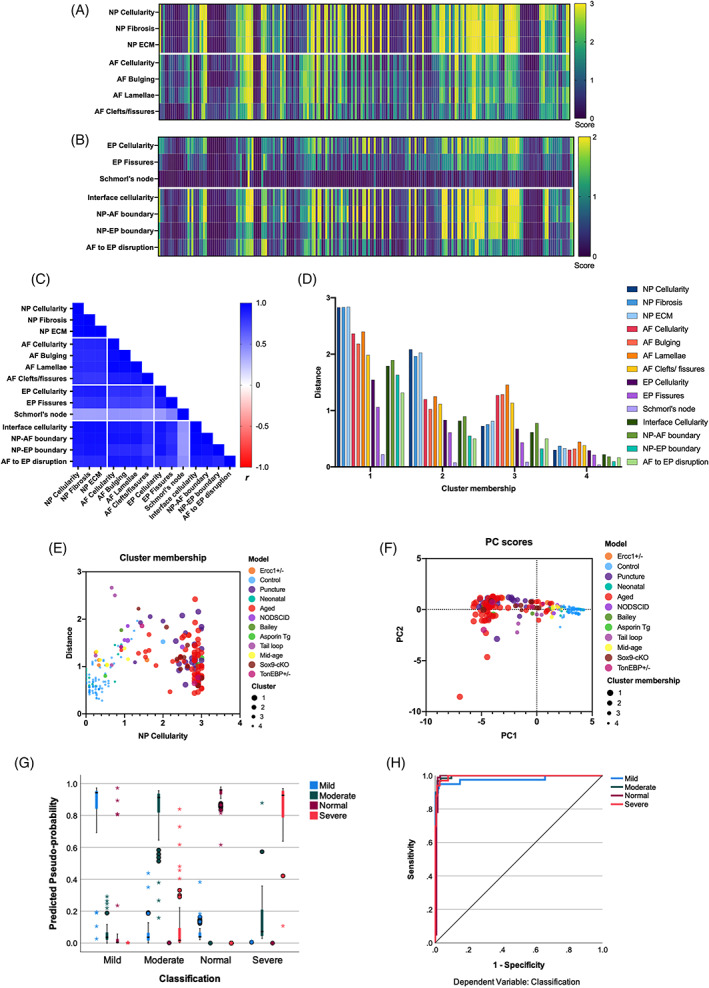
Predictive modeling and validation of the new mouse disc histopathological scoring. All charts presented in the sub‐figures are based on all graders' mean scores (n = 12) for all 14 features in 214 mouse IVD images. Each column in A and B represents individual IVD with the heat map for the mean score by all raters (n = 12) for the listed 14 features (in rows) for all samples (214). Data in A and B are organized in the same order, so the mean score for each feature in a given IVD can be visually compared down the column. The data presented in A and B was used for analysis in all sub‐figures. C, Pearson correlation matrix for listed histopathological scoring features (P < .001 for all). Unsupervised machine learning algorithm using k‐means clustering (D and E) and dispersion of samples based on the 14 histopathological features into PCs represented by PC scores determined by principal component analysis (PCA, F), and cross‐validation to class labels (models) and cluster‐membership. A supervised machine‐learning algorithm using artificial neural network (ANN) and multilayer perceptron (MLP) was applied to train 70% data set and test on 30% data set. Predicted probability (G) and area under the ROC curve (H) for the ANN MPL test
2.3.2. Validation of scoring criteria using unsupervised machine learning algorithms
We applied unsupervised machine learning using the k‐means clustering algorithm to test whether the 14 histopathological features (independent variables, mean score of ~12 raters) can partition the 214 IVDs into a “k” number of clusters based on their similarities. Four “k” clusters were determined using TwoStep clustering, and the distance from cluster center was measured using Euclidean distance. Next, using k of four, k‐means clustering determined the final cluster membership between the 214 IVDs and distance of each feature from the cluster center (Figure 13D, Table S2). The number of clusters and their membership were validated using supervised evaluation by analyzing the NP cellularity of these clusters and comparing the results to the class labels (degeneration model to which the IVDs belonged). The four clusters segregated by the score of NP cellularity and matched their respective model are shown in Figure 13E. Controls and neonatal IVDs with normal histopathological features grouped in cluster 4. Aged and needle‐puncture IVDs were grouped in cluster 1. IVDs from models of milder and moderate degeneration including from middle‐age mice were grouped in cluster 3 and 2.
Next, using dimension reduction approach like principal component analysis (PCA), we validated the 14 histopathological features for predicting IVD pathologies for the 214 IVD images. PCA was run and two principal components (PCs), PC1 (11.64 eigenvalue, 83.17% variance), and PC2 (0.84 eigenvalue, 6.04% variance), were extracted. PCs were validated using class labels (models) and cluster membership which show that the IVDs from the aged and needle‐puncture models from cluster 1 were closer, but furthest away from cluster 4 members formed by the neonatal and control IVDs (Figure 13F).
2.3.3. Validation of scoring criteria using supervised machine learning algorithms
Supervised deep learning using artificial neural networks (ANN) and multilayer perceptron (MLP) algorithm was applied to test whether grading of IVD based on the 14 listed histopathological features the machine can be trained to correctly predict the health and degeneration of the mouse IVD developed in Figure 9B. The predicted pseudo‐probability chart shows that if the machine is trained using the scores of the 14 features to classify the IVDs into normal, mild, moderate, and severe degeneration, it can predict the classification (health and degeneration) of the IVDs from testing dataset with high accuracy (Figure 13G, Table S3). The receiver operating characteristic (ROC) curve and area under the ROC curve was >0.99 for categories, demonstrating a prediction of the IVD model with high sensitivity and specificity based on the histopathological features developed in the study (Figure 13H, Table S3). Cross validation using Spearman's rho (ρ 0.97, 95% CI 0.96 to 0.98, P < .00001) shows almost perfect correlation between the predicted to actual IVD health and degeneration classification based on the histopathological criteria. Apart from the validation, the ANN results using this limited dataset showed that a machine learning model can be developed using scores provided by human observers on the 14 features to predict the health and degeneration of the mouse IVD paving a way to develop a more robust model, in future, using a large dataset of scores or directly on images.
Using unsupervised and supervised machine learning algorithms, we show that the 14 histopathological features and scoring criteria developed in the study can predict the health and degeneration status of the mouse IVDs with high sensitivity and specificity.
2.4. Testing the applicability of the new scoring system using models of mouse IVD degeneration
Finally, we analyzed the applicability of the new mouse IVD histopathological scoring system using the images for three different mouse models of IVD degeneration that were part of the 214 IVD images used for testing (Figure 12) and validation (Figure 13).
2.4.1. Application to the tail needle‐puncture model using H&E‐stained images
Coccygeal IVDs of 3 M old male control, one‐day and four‐week post‐needle puncture were sectioned in the sagittal plane and stained with H&E (Figure 14A‐C′). 26 Two individual IVDs were scored per cohort (11‐12 raters) for the 14 histopathological features listed in the new scoring system. Mean scores plotted in the heat map show a progressive increase in histopathological scores with time following needle‐puncture (Figure 14D) where more dramatic changes were observed in the NP and AF regions.
FIGURE 14.

Validation using H&E stained needle‐puncture model. The new histopathological scoring system and listed features were applied to quantify histopathological changes in H&E‐stained sagittal sections of coccygeal IVDs from the needle‐puncture model of ∼3 M old male mice (A‐C′). Scale bar = 200 μm. D, the heat map shows the mean score by 12 raters for the 14 histopathological features on six individual IVDs from the three cohorts. This data was used for analysis in sub‐figures E‐I. E, PC scores for 14 features based on the model determined by PCA analysis. F, k‐mean cluster membership and Euclidean distance from cluster center of the six IVD samples. G, ROC curve and area under the ROC (AUROC) curve with time following needle‐puncture compared to control cohort. Histogram for mixed‐model ANOVA and Tukey's multiple comparison test analyzing individual IVD region per cohort (H), and cumulative score for the entire IVD per cohort (I). Error bar in H and I shows mean ± SD. ns, not significant, * P < .05, ** P < .01, *** P < .001, and **** P < .0001
PCA was run and two components, PC1 (4.25 eigenvalue, 70.75% variance), PC2 (1.04 eigenvalue, 17.37% variance) were extracted. PCA analysis shows that based on the scores for six samples, features for specific IVD region cluster together (Figure 14E). Analysis of the k‐means cluster membership and Euclidean distance data (from Figure 13D,E) for these six images shows that intact samples are a member of cluster 4, which was formed by the neonates and controls, one‐week post‐injury were split in clusters 3 and 4 but was furthest away from the cluster center for cluster 4 (Figure 14F). The 4‐week post‐injury samples were a member of cluster 1, formed by aged and other needle‐puncture models (Figure 14F). Next, the sensitivity and specificity of the 14 features in quantifying histopathological changes was tested by analyzing the area under the ROC curve (AUROC). AUROC was high for both comparisons; for intact compared to 4‐week post‐injury it was 0.92 (0.8‐1 95% CI, P = .0002), and for intact compared to one‐day post‐injury it was 0.82 (0.65‐0.9 95% CI; P = .0038) (Figure 14G).
Next, we tested whether the new histopathological scoring system could quantify histological changes between the three cohorts using a mixed model ANOVA with Tukey's multiple comparisons test (Figure 14H). Data were analyzed in two ways: (a) using sum score for specific IVD region (NP, AF, EP, and interface) and comparing IVD regions between cohorts (Figure 14H); and (b) adding the sum scores for IVD regions (same as all 14 features) to generate a cumulative score for the entire IVD and comparing results between cohorts (Figure 14I). Significant differences were detected between each IVD region of all cohorts by both the methods. The EP was least affected by needle‐puncture and showed changes after 4 weeks only.
2.4.2. Application to the static tail compression model using FAST stained IVD images
Coccygeal IVDs of 3‐5 M old male and female mice representing control, and from within the loop 50 were sectioned in the sagittal plane and stained with FAST (Figure 15A‐C′). Two IVDs per cohort were scored (11‐12 raters) for the 14 histopathological features. Heat map shows the mean histopathological score of each feature for all six IVDs from the three cohorts (Figure 15D). Changes were observed in AF and minor changes in the interface region. PCA analysis shows the dispersion of 14 features in PC1 (3.92 eigenvalue, 65.39% variance), and PC2 (1.61 eigenvalue, 26.9% variance) based on the scores for the six samples (Figure 15E). The k‐means cluster membership and Euclidean distance of these images show that control samples belong to cluster 4, formed by the neonates and controls. The IVDs that underwent static compression in the tail‐loop were members of cluster 3 formed by group with mild degenerative changes, although the two cohorts were separated from the cluster center (Figure 15F). AUROC for the control compared to early‐degeneration cohort was 0.86 (0.7‐1 95% CI; P = .001) and for control compared to late‐degeneration cohort was 0.93 (0.84‐0.1 95% CI; P = .0001) (Figure 15G), both showing high sensitivity and specificity. Next, using a mixed model ANOVA and Tukey's multiple comparisons test we quantified the changes in each region of the IVD between cohorts, and the overall changes in the IVDs of the three cohorts using the new histopathological scoring (Figure 15H). Similar to the pattern observed in the heat map, significant differences were observed in the AF and interface region when analyzed individually (Figure 15H). Analysis of the cumulative score for the entire IVD for each sample shows significant differences between cohorts (Figure 15I).
FIGURE 15.

Validation using FAST stained tail loop model. Testing and validation of the new histopathological scoring system and listed features using FAST stained sagittal sections of coccygeal discs from the tail‐loop model of ∼3 to 5 M old male and female mice (A‐C′). Scale bar = 200 μm. D, the heat map shows the mean score by 12 raters for the 14 histopathological features on six individual IVDs from the three cohorts. This data was used for analysis in sub‐figures E‐I. E, PC scores for 14 features based on the model determined by PCA analysis. F, k‐mean cluster membership and Euclidean distance from cluster center of the six IVD samples. G, ROC curve and area under the ROC (AUROC) curve with time following tail loop compared to control cohort. Histogram for mixed‐model ANOVA and Tukey's multiple comparison test analyzing individual IVD region per cohort (H), and cumulative score for the entire IVD per cohort (I). Error bar in H and I shows mean ± SD. ns, not significant, * P < .05, ** P < .01, and **** P < .0001
2.4.3. Application to lumbar IVDs of a genetic model using SafO/Fast green stained images
Lumbar IVDs (L4‐L6) of 12 M old male and female mice from wild‐type control, and TonEBP heterozygotes (TonEBP/+) were sectioned in the coronal plane and stained with SafO/Fast green/H (Figure 16A‐C′). The IVDs of TonEBP/+ mice demonstrated varied pathological phenotypes and were grouped as TonEBP/+_1 and TonEBP/+_2. 45 Images of two IVDs per cohort were scored (11‐12 raters) for the 14 histopathological features listed in the new scoring system. The mean score of all raters for each feature is shown in the heat map comparing the three cohorts (Figure 16D). PCA analysis shows the dispersion of 14 features in PC1 (4.71 eigenvalue, 78.6% variance), and PC2 (0.96 eigenvalue, 15.95% variance) based on the scores for the six samples (Figure 16E). The k‐means cluster membership and Euclidean distance show that the two replicates from control correctly clustered together in cluster 4. One of the TonEBP/+_1 replication was in cluster 3 of mild, and other in cluster 2 of moderate IVD degeneration groups. Both replicates of the TonEBP/+_2 cohort were together in cluster 1, formed by severely degenerated IVDs (Figure 16F). AUROC for the control compared to TonEBP/+_1 was 0.83 (0.68 to 0.99 95% CI; P = 0.0026), and for control compared to TonEBP/+_2 was 0.93 (0.86 to 0.1 95% CI; P = .0001; Figure 16G) indicating high sensitivity and specificity. Next, using mixed model ANOVA and Tukey's multiple comparisons test we quantified the changes in each region of the IVD between cohorts, and the overall changes in the IVDs of the three cohorts using the new histopathological scoring (Figure 16H). Significant differences were observed between the cohorts in each IVD region and when grouped together to generate a cumulative score.
FIGURE 16.
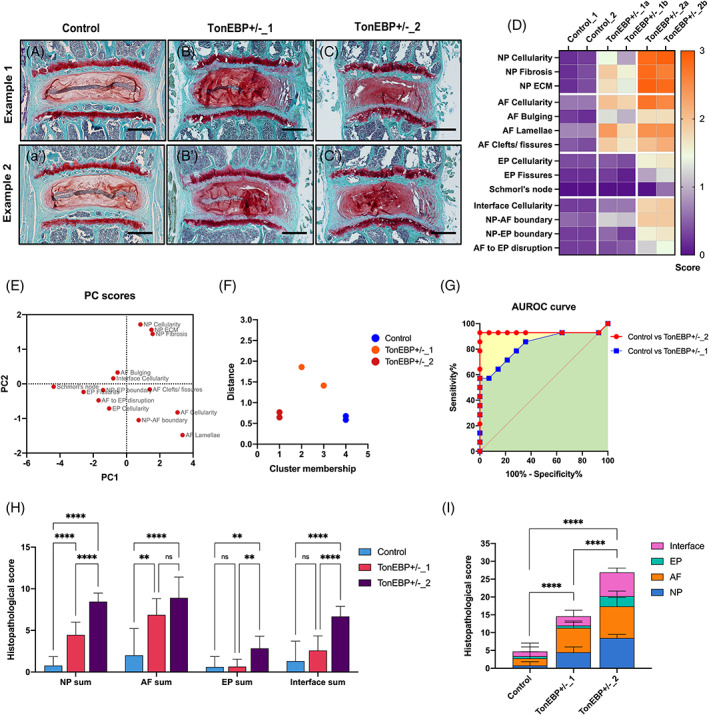
Validation using SafO/Fast green stained genetic mouse model. Testing and validation of the new histopathological scoring system and listed features using SafraninO/Fast green and hematoxylin‐stained coronal sections of lumbar discs from the ∼12 M old TonEBP+/− and wild‐type control male and female mice (A‐C′). Scale bar = 200 μm. D, the heat map shows the mean score by 12 raters for the 14 histopathological features on six individual IVDs from the three cohorts. This data was used for analysis in sub‐figures E‐I. E, PC scores for 14 features based on the model determined by PCA analysis. F, k‐mean cluster membership and Euclidean distance from cluster center of the six IVD samples. G, ROC curve and area under the ROC (AUROC) curve for the two grades of degeneration compared to control cohort. Histogram for mixed‐model ANOVA and Tukey's multiple comparison test analyzing individual IVD region per cohort (H), and cumulative score for the entire IVD per cohort (I). Error bar in H and I shows mean ± SD. ns, not significant, ** P < .01, and **** P < .0001
Overall, application of the new histopathological scoring system to three different mouse models of IVD degeneration for which histological samples were prepared using varied SOPs showed that the features described in the new histopathological scoring system can distinguish significant differences between even minor histopathological changes with high sensitivity and specificity.
3. DISCUSSION
Histopathological and structural changes in the IVD are crucial outcome measures due to their effect on IVD function. The mouse as a preclinical model to understand the structure‐function relationship of the IVD has gained importance primarily due to the relevant genetic and behavioral approaches for elucidating the mechanisms of IVD pathologies. 16 , 17 This study aimed to develop a comprehensive but easy to adapt mouse IVD histopathological scoring criterion, which captures the degenerated features noted in pathological human IVD tissues. This system enables better cross‐study comparison of mouse models, and is sensitive to quantify histopathology in mouse models of IVD degeneration and regeneration. We developed a list of 14 histopathological scoring features based on a literature review, previous IVD scoring systems, and a survey of the spine community and tested them using several mouse models of IVD degeneration. Each scoring feature was categorized using a point‐based linear order of equal interval, enabling the analysis of specific features as the IVD progresses from normal to severe degeneration. This is one of the strengths of the new scoring criteria, as it enables equal distribution of weights across features for determining pathology of each IVD region; and the final score is not influenced by a few features listed only in the highest‐scoring category. Moreover, the new histopathological scoring criteria can quantify each region of the IVD separately and these scores can be summed to generate a cumulative score to determine overall histopathological and structural changes in the IVD. As indicated by the survey respondents, we recommend comparisons between IVDs of the same level of the IVD and from the same region of the spine between cohorts.
One goal in developing a new IVD histopathological scoring system was its utilization for cross‐study comparisons of mouse IVD degeneration and regeneration models. Hence, we analyzed and captured phenotypic changes in multiple models representing mice from postnatal day seven (P7) to over two years of age, both sexes, commonly used genetic strains, and several different SOPs utilized for histological preparation (Figure 11). We also used IVD images from these models to test the new histopathological scoring criteria using both trained and novice raters from various labs (Figure 12A). Using the large image set, the reliability of the 14 histopathological features was tested for overall agreement and agreement for each scoring category (Figure 12B,C, Tables 2, 3, 4, 5). Experienced raters demonstrated substantial to an almost perfect overall agreement by Fleiss's multi‐rater κ, similar to results following four rounds of training by novice raters. Hence, we recommend that all raters, independent of previous experience, should undergo training to become familiar with the scoring features before applying it for their experiments. Fair to moderate agreement was observed by both cohorts of raters for the middle‐categories, indicating that the observers have difficulty distinguishing subtle progressive histopathological changes. Although the survey results showed inclination for a 0 to 5 scoring range (Figure 4J), our reliability analysis results showed that several categories should not be used for quantifying observational data. Analysis of ICC's magnitude of agreement and Cohen's κw tests showed excellent and almost perfect agreement. Intra‐rater reliability tested by Fleiss's κ showed substantial to an almost perfect agreement for overall and each scoring category (Tables 2, 3, 4, 5), indicating the reproducibility of histopathological observations based on the listed features.
The survey results (Figure 4D) and discussions within the group highlighted that various histochemical stain are routinely applied in mouse IVD histology. Hence, the impact of histochemical staining on the visualization of histological features in the new scoring system was tested. Relative comparisons of histopathological features by Fleiss's multi‐rater κ showed that IVD images stained with H&E had a higher agreement by raters independent of their training for most features compared to Safranin‐O/Fast green and FAST stained IVD images. FAST stained images had only slight to a fair agreement which was lower than both H&E and Safranin‐O/Fast green stained images by all raters independent of their training. A caveat of this analysis was that the comparisons were not made on serial sections from the same samples, and will require further investigation. The model system and SOPs applied for preparation of FAST and Safranin‐O/Fast green were similar, as were those for the majority of H&E‐stained sections (Figure 12D), and hence are unlikely to affect the reliability tests. Moreover, the pathologist on this study commented that pathological examinations are routinely carried out on H&E‐stained sections.
The rigor of the new histopathological scoring system was verified by machine learning based statistical methods, which confirmed the 14 histopathological features' sensitivity and specificity for accurate prediction of mouse IVD degeneration. Moreover, the new scoring system's application on the established model of mouse IVD degeneration showed that the features could quantify the histopathological changes with high sensitivity compared to controls.
During the initial round of testing of the scoring system, we used a single total scoring method for each disc region, which resulted in fair reliability. Moreover, when we tested the new histopathological features by giving a single total score for each disc region and not for each feature within the region, it showed substantial agreement. However, it failed to predict the degeneration model (Figure S2) accurately. We therefore discourage users from using a total scoring method and instead recommend scoring each of the 14 features separately. Moreover, cross validation by applying unsupervised machine learning algorithms to observational data with higher inter‐rater agreement (Figure S2), indicates the importance of rigorous statistical analysis for building scoring criteria.
Neovascularization of the AF was initially considered but based on the response received from the survey (Figure 4E) and following discussion, there was a consensus that vascularization would be more viable. Additional and specific staining methods are required for visualization of vascularization. Following feedback from the pathologist on the test images, features related to vascularization of AF was excluded from the scoring criteria.
While the survey respondents positively regarded disc aspect ratio analysis (Figure 4I), since this morphometric change requires quantification measurements and cannot be relied on observation, it was excluded from the features of the histopathological scoring. Disc aspect ratio, 48 and other morphometric parameters used to quantify structural changes in IVD 14 , 46 , 51 are nevertheless essential and may be analyzed as an additional outcome measures as the study warrants.
There are a few limitations to the current study. While several histopathological features for scoring EP were discussed, due to strain‐related differences in the EP, only the features uniformly observed between various mouse strains were included for histopathological scoring. As Schmorl's nodes are not often observed in mouse IVDs, their absence (normal, 0) and presence (severe, 2) were scored on a binary scale consistent with the EP category's scoring range. The score for Schmorl's node should be carefully recorded. Further studies are required to test the new histopathological system on mouse models of either prevention of IVD degeneration or it's regeneration. Based on the histological changes observed in one such study of IVD reactivation using the sacral disc as a model, 46 we suggest the new histopathological scoring system can be adapted for quantifying histopathological changes associated with regeneration. Lastly, while the NP and AF were scored on a four‐point scale with the highest score of 3; EP and Interface were scored on three‐point scale with the highest score being 2. During the initial test run, the consensus was that NP and AF are most affected by degeneration, and the features can be distinguished when detailed into four categories. However, it was not possible to do the same for the EP or interface. As discussed above, a more comprehensive scoring range results in inconsistent scores, affecting further analysis and reproducibility.
The limited data set in the study used for validation by machine learning algorithms supports the potential of the 14 histopathological features for building predictive models. However, for robust machine learning approaches for modeling will require validation on a larger data set. Considering the sensitivity and specificity of the current scoring criteria by human raters in the current study, it may be feasible to test them directly on images in future studies. Importantly, with the advancement of new technologies, models and our knowledge regarding IVD pathologies, it will be crucial to revise and update this scoring system.
Overall, using several mouse models of IVD degeneration from both sexes and all ages and controlling for the variability in the SOPs, we rigorously tested the reliability of all features and each scoring category using a large group of raters. Moreover, we tested the new histopathological scoring system for quantitative analysis using unsupervised and supervised machine learning algorithms and validated that the 14 histopathological features accurately predicted IVD degeneration with high sensitivity and specificity. As the new histopathological scoring system captures several human IVD pathologies, it will help quantification of preclinical mouse models will inform for degenerative and regenerative approaches for translation research.
4. METHODOLOGY AND STATISTICAL ANALYSIS
4.1. Survey design and analysis
A detailed survey was designed specifically for IVDs of mouse model. The survey was deemed as exempt research by the Corporal Michael J. Crescenz Veterans Affairs (VA) Medical Center Institutional Review Board (Protocol #01862). Multiple‐choice questions captured the commonly used SOPs for histopathological preparation and percent response to each category is presented as pie charts. A six‐point Likert scale from least important (scale 0) to most important (scale 5) captured response regarding the importance of scoring features. The percent response for each point was plotted on a component band chart. Further consensus on parameters to consider while developing the new mouse IVD histopathological scoring system was gathered using closed‐ended questions and percent response to each category is plotted on a component band chart. Frequencies for response to each category were computed using SPSS 27 and data were as plotted using GraphPad Prism 9.
4.2. Description of models utilized for testing the new scoring system
The frequency distribution of multiple variables for the 214‐individual images of mouse IVD used in the study was determined using cross‐tabulation in SPSS 27 (Table S1). In summary, lumbar (29.9%) and coccygeal (70.1%) discs from female (9.8%), male (15%), or mice of both sexes (75.2%) that belonged to C57BL/6J (49.5%), SM/J (21.5%), FVB (14.5%), B6 and DBA (4.7%) backgrounds were analyzed. The genetic background of 9.8% of mice was not reported (NR, Figure 11). The spines were processed either using 4% PFA and EDTA (93%) or Decalcifier I solution (7%) and embedded in paraffin and sectioned (85.5%) or cryosectioned (14.5%). The molarity of EDTA varied between labs that shared the images. Sections were prepared either in the coronal (75.7%) or sagittal (24.3%) plane. The age spanned from early postnatal (P7) to aged (24 M) and both male and female mice were analyzed. The neonatal (7.5%), 51 natural aging (42.7%), 12 , 13 , 14 , 23 needle‐puncture and matched controls (16.4%), 26 tail‐loop and matched control (2.8%), 50 and various genetic mutants including Sox9‐cKO and matched controls (9.3%), 52 TonEBP+/− and matched controls (2.8%), 45 Ercc1+/− and matched controls (7%), 23 NODSCID and matched controls (3.3%), 53 Asporin Tg and matched controls (2.8%), and Bailey and matched controls (0.9%) were analyzed. The sections were stained with FAST (16.8%), H&E (26.2%), Safranin‐O/Fast green, and hematoxylin (57%) (Figure 11). Using images of IVD from multiple biological variables and prepared using various SOPs helps in rigorous testing of the new histopathological scoring system, and its successful application to studies using mouse as a preclinical model system for IVD research.
4.3. Fleiss's multi‐rater kappa test for agreement
The histopathological scores for all 14 features were processed to analyze the reliability of the scoring features and criteria by determining the strength of agreement between raters using SPSS 27 and Fleiss' multi‐rater kappa (κ) reliability test. Fleiss's multi‐rater κ recommended for testing the agreement between more than two raters for nominal, ordinal, and continuous data, tests κ for overall agreement, and agreement for each category of the observational data. Hence, Fleiss's κ also analyzes agreement between the raters for the middle categories of observational data. A κ of 0 indicates no agreement, and a κ of 1 indicates absolute agreement. Similar to other scale tests, there is no rule of thumb to categorize κ value and interpret its magnitude or strength, as agreement for observational data may vary with the kind of study. Fleiss suggested guidance to carefully consider interpreting the strength of agreement for weighted κ (κw) and unweighted κ, where κ > 0.75 or so may indicate excellent overall agreement; and κ of less than 0.4 or so may indicate poor agreement. 54 Another guide used to interpret the magnitude of the agreement for observational data is that used by Landis and Koch in a study on the diagnosis of neurological conditions where they divided the κ into small categories. 49 Based on these categories κ < 0.2 may indicate slight, κ of 0.21 to 0.04 may indicate fair, κ of 0.41 to 0.6 may indicate moderate, κ of 0.61 to 0.8 may indicate substantial, and κ > 0.81 may indicate almost perfect agreement. A few raters indicated that the clarity of six images was low; hence, the reliability tests are based on 208 de‐identified images. Intra‐rater reliability was tested for two raters who scored 75 images for the 14 histopathological features. The tests were run to determine overall κ, κ for each scoring category, statistical significance, and 95% confidence interval (Tables 2, 3, and 5 and Table S5). In this study, we are following Landis and Koch's criteria to interpret the results.
4.4. ICC and Cohen's kappa test for reliability
The scores were processed as mentioned above. Cohen's unweighted kappa (κ) is recommended for testing inter‐rater reliability for nominal data. While Cohen's κw may be used for ordinal data, it assesses reliability by assigning weights to the degree of disagreement between two raters. ICC measures the degree of correlation between measurements made by different raters that may be used to interpret the reliability. The scores for the same 202 de‐identified images were analyzed by ICC for multi‐rater reliability using data for all raters for all stains for the Fleiss's multi‐rater κ (Table 3 and Figure 12C all raters). Inter‐rater reliability for two raters tested Cohen's κw used the same data from two experienced raters from Lab‐A (Table 2 and Figure 12B). SPSS 27 was used to determine the ICC coefficient and κw, statistical significance and 95% confidence interval (Table 4). When calculating the ICC, the valid subjects (images) were reduced from 208 to 202 as one rater did not score six images due to conflict. Interpretation of κw and ICC is based on the Landis and Koch criteria described above.
4.5. Pearson product moment correlation coefficient
Pearson product moment correlation, also known as Pearson's correlation or r was run on GraphPad Prism 9 to determine the relationship between the 14 histopathological features (variables) using a mean score from 12 blinded independent raters for 214‐IVD images. Pearson's r was computed for every pair of data sets. Significance was determined using a Two‐tailed test of significance and 95% confidence interval (Table S2). Pearson's r can range from +1 (strongest positive association) to −1 (negative association). And an r = indicates that there is no association. For interpreting the positive correlation, similar to all scale values, correlation coefficients are thought to be difficult to categorize. In this study, we have adapted the systems where r is categorized; r ≤ .35 or so signifies a low or weak correlation, .36 to .67 or so signifies modest or moderate correlation, .68 to 1 signifies strong or high correlation, and r ≥ .9 very high correlation. The value of P was <.000001 for all comparisons and considered highly significant.
4.6. K‐means clustering
Unsupervised machine learning using k‐means clustering algorithm was run on SPSS 27. As the scoring data is on the same scale and at an equal interval, it meets the assumptions of running k‐means clustering. Histopathological scores for 14 features from 12 blinded raters for 214 IVD images were processed. First, using TwoStep clustering, which generates a pre‐cluster of data into an automatically selected number of clusters, four clusters (k = 4) of fair quality were created. Euclidean distance calculated the distance from the cluster center. The final cluster center each of the 14 features, distance between final clusters and number of cases in each cluster were analyzed (Table S3).
4.7. Principal component analysis
Unsupervised machine learning using PCA algorithm was run for dimension reduction and predictive modeling of the histopathological changes in mouse IVDs. Before running PCA, we tested whether our data passes at least four assumptions required to run PCA, which includes that the data (a) multiple variables (n = 14 features) measured at the equal interval (0, 1, 2, and 3); (b) have a linear relationship (Figure 13C); (c) a large data set (n = 214), and (d) do not include significant outliers. As the data met all four assumptions, PCA was run using GraphPad Prism 9 and data for 14 variables (features) for 214 mouse IVDs from 12 blinded raters. Two principal components (PCs), PC1 and PC2, were selected based on the largest eigenvalue of 11.64 and 0.84. The percent variance of PC1 and PC2 was 83.17% and 6.04%, respectively. P < .05 was considered significant.
Unsupervised validation of the 14 features in three different models of mouse IVD degeneration was performed by PCA (Figures 14C, 15C, and 16C).
4.8. Artificial neural networks and multilayer perceptron
Supervised deep learning was applied for predictive modeling of mouse IVD histopathology using ANN and MLP algorithm and run using SPSS 27. The mean of total histopathological score by 12 raters was used to interpret the IVD health and degeneration based on the criteria proposed in Figure 9B and used as the dependent variable for classification (normal, mild, moderate, and severe IVD degeneration). Histopathological scores for the 14 features from 12 blinded raters for 214 IVD images were used as covariates to determine their application for training the machine to correctly predict the IVD health and degeneration. Age, model of IVD degeneration, sex, mouse strain, plane of section, region of spine and histochemical stain were used as factors. Partition dataset was generated by randomly assigning cases (models and their associates factors and covariates) based on the relative number of cases into 70% training dataset and 30% testing dataset. ROC was based on the pseudo‐probability. Details on network performance are provided in Table S4. To cross validate the ANN MLP predictions, first the classification (normal, mild, moderate and severe IVD degeneration) of the 214 images were number ordered. Next, Spearman's rank order correlation was run using SPSS to test the strength and magnitude of correlation between the actual classifications compared to the predicted classification of the entire data set. The Spearman's rho, statistical significance and 95% confidence interval were determined.
4.9. ROC curve
ROC curve was applied to evaluate the performance of the new mouse IVD histopathological scoring system. ROC tests the sensitivity and specificity of the classification or scoring system. ROC curve for the application testing dataset presented in Figures 14G, 15G, and 16G was run using GraphPad prism 9 to test the performance of the 14 IVD histopathology‐scoring features. The sensitivity and specificity of the 14 features were tested by ROC curve using Wilson and Brown method for computing 95% confidence interval.
4.10. Mixed model ANOVA
The quantification of histological changes using the new mouse IVD histopathological scoring criteria for 14 features were analyzed using mixed model ANOVA on GraphPad prism 9 to compare difference between the three experimental cohorts, and within‐group factors including the four IVD regions (NP, AF, EP, and interface). A main effect was determined by Tukey's multiple comparisons test. P < .05 was considered significant.
AUTHOR CONTRIBUTION
Chitra L. Dahia, Makarand V. Risbud, Danny Chan, Cheryle A. Séguin, and Nam Vo conceptualized and designed the study. Literature review and comparisons of prior scoring systems was conducted by Itzel Paola Melgoza, Srish S. Chenna, and Chitra L. Dahia. Chitra L. Dahia designed the survey, and analyzed the data. Chitra L. Dahia, Makarand V. Risbud, Danny Chan, Cheryle A. Séguin, Nam Vo, Simon Y. Tang, Yejia Zhang, Victor Y. Leung, Angela K. Brice, Itzel Paola Melgoza, Srish S. Chenna, OT, and Simon Y. Tang contributed to development of scoring criteria and list of histopathological features. Angela K. Brice, the pathologist on the study, reviewed the histopathological scoring criteria, and language for pathological evaluation. Images for testing were contributed from the labs of Makarand V. Risbud, Chitra L. Dahia, Danny Chan, Nam Vo, Yejia Zhang, Simon Y. Tang, and Victor Y. Leung. Raters for testing the scoring criteria included Itzel Paola Melgoza, Srish S. Chenna, Steven Tessier, Yejia Zhang, Simon Y. Tang, Takashi Ohnishi, Geoffrey J. Kerr, Emanuel José Novais, Sarthak Mohanty, Vivian Tam, Wilson C. W. Chan, Chao‐Ming Zhou, Ying Zhang, and Chitra L. Dahia. Data processing, statistical analysis and predictive modeling, and figure preparation was done by Chitra L. Dahia. Inter‐rater and intra‐rater reliability analysis was conducted by Itzel Paola Melgoza, Srish S. Chenna and Chitra L. Dahia. Article was drafted by Chitra L. Dahia, Itzel Paola Melgoza, Srish S. Chenna, and Sarthak Mohanty, and all authors read, edited and approved of the final article for submission.
CONFLICT OF INTEREST
The authors have no relevant conflict of interest to disclose in relation to this study.
Supporting information
Appendix S1: Supporting Information
ACKNOWLEDGMENTS
We would like to thank the survey respondents for their feedback and input which helped develop the new scoring system. We thank the members of the Makarand V. Risbud, Chitra L. Dahia, Danny Chan, Nam Vo, Yejia Zhang, Simon Y. Tang, and Victor Y. Leung labs for providing the IVD images for testing the scoring system.
Support to Chitra L. Dahia for this work was provided by the Starr Foundation, S & L Marx Foundation, National Institute of Arthritis and Musculoskeletal and Skin Diseases (NIAMS) of the National Institutes of Health (NIH) Grant Number R01 AR065530, R01 AR077145 and NIH grant number S10 OD026763. Makarand V. Risbud is supported by NIAMS grants R01 AR064733, R01 AR055655, R01 AR074813. Contents of this publication are solely the responsibility of the authors and do not necessarily represent the official views of NIAMS or NIH. Part of this work was supported by the Research Grants Council (RGC) of Hong Kong; GRF17126319 and E‐HKU703/18 provided to Danny Chan, and GRF17126518 to Victor Y. Leung.
Melgoza, I. P. , Chenna, S. S. , Tessier, S. , Zhang, Y. , Tang, S. Y. , Ohnishi, T. , Novais, E. J. , Kerr, G. J. , Mohanty, S. , Tam, V. , Chan, W. C. W. , Zhou, C.‐M. , Zhang, Y. , Leung, V. Y. , Brice, A. K. , Séguin, C. A. , Chan, D. , Vo, N. , Risbud, M. V. , & Dahia, C. L. (2021). Development of a standardized histopathology scoring system using machine learning algorithms for intervertebral disc degeneration in the mouse model—An ORS spine section initiative. JOR Spine, 4(2), e1164. 10.1002/jsp2.1164
Itzel Paola Melgoza and Srish S. Chenna contributed equally to this work
Funding information National Institute of Arthritis and Musculoskeletal and Skin Diseases, Grant/Award Numbers: R01 AR055655, R01 AR064733, R01 AR074813, R01AR065530, R01AR077145; NIH Office of the Director, Grant/Award Number: S10OD026763; Research Grant Council of Hong Kong, Grant/Award Numbers: GRF17126518, GRF17126319; RGC European Union—Hong Kong Research and Innovation Cooperation Co‐funding Mechanism, Grant/Award Number: E‐HKU703/18; Hong Kong Research Grants Council, Grant/Award Number: T12‐708/12N; S & L Marx Foundation; Starr Foundation
REFERENCES
- 1. HALE Collaborators GBDD . Global, regional, and national disability‐adjusted life years (DALYs) for 306 diseases and injuries and healthy life expectancy (HALE) for 188 countries, 1990–2013: quantifying the epidemiological transition. Lancet. 2015;386(10009):2145‐2191. 10.1016/S0140-6736(15)61340-X. [DOI] [PMC free article] [PubMed] [Google Scholar]
- 2. Hartvigsen J, Hancock MJ, Kongsted A, et al. Lancet low back pain series working G. what low back pain is and why we need to pay attention. Lancet. 2018;391(10137):2356‐2367. 10.1016/S0140-6736(18)30480-X. [DOI] [PubMed] [Google Scholar]
- 3. Hoy D, Bain C, Williams G, et al. A systematic review of the global prevalence of low back pain. Arthritis Rheum. 2012;64(6):2028‐2037. 10.1002/art.34347. [DOI] [PubMed] [Google Scholar]
- 4. Samartzis D, Karppinen J, Mok F, Fong DY, Luk KD, Cheung KM. A population‐based study of juvenile disc degeneration and its association with overweight and obesity, low back pain, and diminished functional status. J Bone Joint Surg Am. 2011;93(7):662‐670. 10.2106/JBJS.I.01568. [DOI] [PubMed] [Google Scholar]
- 5. Vo NV, Hartman RA, Patil PR, et al. Molecular mechanisms of biological aging in intervertebral discs. J Orthop Res. 2016;34(8):1289‐1306. 10.1002/jor.23195. [DOI] [PMC free article] [PubMed] [Google Scholar]
- 6. Freemont AJ. The cellular pathobiology of the degenerate intervertebral disc and discogenic back pain. Rheumatology. 2009;48(1):5‐10. 10.1093/rheumatology/ken396. [DOI] [PubMed] [Google Scholar]
- 7. Urban JP, Roberts S. Degeneration of the intervertebral disc. Arthritis Res Ther. 2003;5(3):120‐130. [DOI] [PMC free article] [PubMed] [Google Scholar]
- 8. O'Connell GD, Vresilovic EJ, Elliott DM. Comparison of animals used in disc research to human lumbar disc geometry. Spine (Phila Pa 1976). 2007;32(3):328‐333. 10.1097/01.brs.0000253961.40910.c1. [DOI] [PubMed] [Google Scholar]
- 9. Showalter BL, Beckstein JC, Martin JT, et al. Comparison of animal discs used in disc research to human lumbar disc: torsion mechanics and collagen content. Spine (Phila Pa 1976). 2012;37(15):E900‐E907. 10.1097/BRS.0b013e31824d911c. [DOI] [PMC free article] [PubMed] [Google Scholar]
- 10. Dahia CL, Mahoney EJ, Durrani AA, Wylie C. Intercellular signaling pathways active during and after growth and differentiation of the lumbar vertebral growth plate. Spine (Phila Pa 1976). 2011;36(14):1071‐1080. 10.1097/BRS.0b013e3181f7a3ca. [DOI] [PubMed] [Google Scholar]
- 11. Zhang Y, Lenart BA, Lee JK, et al. Histological features of endplates of the mammalian spine: from mice to men. Spine (Phila Pa 1976). 2014;39(5):E312‐E317. 10.1097/BRS.0000000000000174. [DOI] [PMC free article] [PubMed] [Google Scholar]
- 12. Mohanty S, Pinelli R, Dahia CL. Characterization of Krt19 (CreERT) allele for targeting the nucleus pulposus cells in the postnatal mouse intervertebral disc. J Cell Physiol. 2020;235(1):128‐140. 10.1002/jcp.28952. [DOI] [PMC free article] [PubMed] [Google Scholar]
- 13. Mohanty S, Pinelli R, Pricop P, Albert TJ, Dahia CL. Chondrocyte‐like nested cells in the aged intervertebral disc are late‐stage nucleus pulposus cells. Aging Cell. 2019;18(5):e13006. 10.1111/acel.13006. [DOI] [PMC free article] [PubMed] [Google Scholar]
- 14. Vincent K, Mohanty S, Pinelli R, et al. Aging of mouse intervertebral disc and association with back pain. Bone. 2019;123:246‐259. 10.1016/j.bone.2019.03.037. [DOI] [PMC free article] [PubMed] [Google Scholar]
- 15. Winkler T, Mahoney EJ, Sinner D, Wylie CC, Dahia CL. Wnt signaling activates Shh signaling in early postnatal intervertebral discs, and re‐activates Shh signaling in old discs in the mouse. PLoS One. 2014;9(6):e98444. 10.1371/journal.pone.0098444. [DOI] [PMC free article] [PubMed] [Google Scholar]
- 16. Melrose J, Tessier S, Risbud MV. Genetic murine models of spinal development and degeneration provide valuable insights into intervertebral disc pathobiology. Eur Cell Mater. 2021;41:52‐72. 10.22203/eCM.v041a05. [DOI] [PubMed] [Google Scholar]
- 17. Mohanty S, Dahia CL. Defects in intervertebral disc and spine during development, degeneration, and pain: new research directions for disc regeneration and therapy. Wiley Interdiscip Rev Dev Biol. 2019;8(4):e343. 10.1002/wdev.343. [DOI] [PMC free article] [PubMed] [Google Scholar]
- 18. Hagan C. When are mice considered old? jax.org: JAX Blog; 2017 [November 6, 2017].
- 19. Alvarez‐Garcia O, Matsuzaki T, Olmer M, Masuda K, Lotz MK. Age‐related reduction in the expression of FOXO transcription factors and correlations with intervertebral disc degeneration. J Orthop Res. 2017;35(12):2682‐2691. 10.1002/jor.23583. [DOI] [PMC free article] [PubMed] [Google Scholar]
- 20. Alvarez‐Garcia O, Matsuzaki T, Olmer M, et al. FOXO are required for intervertebral disk homeostasis during aging and their deficiency promotes disk degeneration. Aging Cell. 2018;17(5):e12800. 10.1111/acel.12800. [DOI] [PMC free article] [PubMed] [Google Scholar]
- 21. Novais EJ, Tran VA, Miao J, et al. Comparison of inbred mouse strains shows diverse phenotypic outcomes of intervertebral disc aging. Aging Cell. 2020;19(5):e13148. 10.1111/acel.13148. [DOI] [PMC free article] [PubMed] [Google Scholar]
- 22. Ohnishi T, Sudo H, Tsujimoto T, Iwasaki N. Age‐related spontaneous lumbar intervertebral disc degeneration in a mouse model. J Orthop Res. 2018;36(1):224‐232. 10.1002/jor.23634. [DOI] [PubMed] [Google Scholar]
- 23. Vo N, Seo HY, Robinson A, et al. Accelerated aging of intervertebral discs in a mouse model of progeria. J Orthop Res. 2010;28(12):1600‐1607. 10.1002/jor.21153. [DOI] [PMC free article] [PubMed] [Google Scholar]
- 24. Ohnishi T, Sudo H, Iwasaki K, Tsujimoto T, Ito YM, Iwasaki N. In vivo mouse intervertebral disc degeneration model based on a new histological classification. PLoS One. 2016;11(8):e0160486. 10.1371/journal.pone.0160486. [DOI] [PMC free article] [PubMed] [Google Scholar]
- 25. Tam V, Chan WCW, Leung VYL, et al. Histological and reference system for the analysis of mouse intervertebral disc. J Orthop Res. 2018;36(1):233‐243. 10.1002/jor.23637. [DOI] [PubMed] [Google Scholar]
- 26. Tian Z, Ma X, Yasen M, et al. Intervertebral disc degeneration in a percutaneous mouse tail injury model. Am J Phys Med Rehabil. 2018;97(3):170‐177. 10.1097/PHM.0000000000000818. [DOI] [PMC free article] [PubMed] [Google Scholar]
- 27. Chen C, Zhou T, Sun X, et al. Autologous fibroblasts induce fibrosis of the nucleus pulposus to maintain the stability of degenerative intervertebral discs. Bone Res. 2020;8(7):1‐13. 10.1038/s41413-019-0082-7. [DOI] [PMC free article] [PubMed] [Google Scholar]
- 28. Kushioka J, Kaito T, Chijimatsu R, et al. The small compound, TD‐198946, protects against intervertebral degeneration by enhancing glycosaminoglycan synthesis in nucleus pulposus cells. Sci Rep. 2020;10(1):14190. 10.1038/s41598-020-71193-6. [DOI] [PMC free article] [PubMed] [Google Scholar]
- 29. Liu JW, Piersma S, Tang SY. The age‐dependent effect of high‐dose X‐ray radiation on NF kappaB signaling, structure, and mechanical behavior of the intervertebral disc. Connect Tissue Res. 2020;61(3–4):399‐408. 10.1080/03008207.2019.1703963. [DOI] [PMC free article] [PubMed] [Google Scholar]
- 30. Piazza M, Peck SH, Gullbrand SE, et al. Quantitative MRI correlates with histological grade in a percutaneous needle injury mouse model of disc degeneration. J Orthop Res. 2018;36(10):2771‐2779. 10.1002/jor.24028. [DOI] [PMC free article] [PubMed] [Google Scholar]
- 31. Serjeant M, Moon PM, Quinonez D, Penuela S, Beier F, Seguin CA. The role of Panx3 in age‐associated and injury‐induced intervertebral disc degeneration. Int J Mol Sci. 2021;22(3):1‐15. 10.3390/ijms22031080. [DOI] [PMC free article] [PubMed] [Google Scholar]
- 32. Han B, Zhu K, Li FC, et al. A simple disc degeneration model induced by percutaneous needle puncture in the rat tail. Spine (Phila Pa 1976). 2008;33(18):1925‐1934. 10.1097/BRS.0b013e31817c64a9. [DOI] [PubMed] [Google Scholar]
- 33. Ji ML, Jiang H, Zhang XJ, et al. Preclinical development of a microRNA‐based therapy for intervertebral disc degeneration. Nat Commun. 2018;9(1):5051. 10.1038/s41467-018-07360-1. [DOI] [PMC free article] [PubMed] [Google Scholar]
- 34. Ohta R, Tanaka N, Nakanishi K, et al. Heme oxygenase‐1 modulates degeneration of the intervertebral disc after puncture in Bach 1 deficient mice. Eur Spine J. 2012;21(9):1748‐1757. 10.1007/s00586-012-2442-5. [DOI] [PMC free article] [PubMed] [Google Scholar]
- 35. Boos N, Weissbach S, Rohrbach H, Weiler C, Spratt KF, Nerlich AG. Classification of age‐related changes in lumbar intervertebral discs: 2002 Volvo award in basic science. Spine (Phila Pa 1976). 2002;27(23):2631‐2644. 10.1097/00007632-200212010-00002. [DOI] [PubMed] [Google Scholar]
- 36. Thompson JP, Pearce RH, Schechter MT, Adams ME, Tsang IK, Bishop PB. Preliminary evaluation of a scheme for grading the gross morphology of the human intervertebral disc. Spine (Phila Pa 1976). 1990;15(5):411‐415. 10.1097/00007632-199005000-00012. [DOI] [PubMed] [Google Scholar]
- 37. Choi H, Tessier S, Silagi ES, et al. A novel mouse model of intervertebral disc degeneration shows altered cell fate and matrix homeostasis. Matrix Biol. 2018;70:102‐122. 10.1016/j.matbio.2018.03.019. [DOI] [PMC free article] [PubMed] [Google Scholar]
- 38. Kerr GJ, McCann MR, Branch JK, et al. C57BL/6 mice are resistant to joint degeneration induced by whole‐body vibration. Osteoarthr Cartil. 2017;25(3):421‐425. 10.1016/j.joca.2016.09.020. [DOI] [PubMed] [Google Scholar]
- 39. McCann MR, Patel P, Pest MA, et al. Repeated exposure to high‐frequency low‐amplitude vibration induces degeneration of murine intervertebral discs and knee joints. Arthritis Rheumatol. 2015;67(8):2164‐2175. 10.1002/art.39154. [DOI] [PubMed] [Google Scholar]
- 40. McCann MR, Veras MA, Yeung C, et al. Whole‐body vibration of mice induces progressive degeneration of intervertebral discs associated with increased expression of Il‐1beta and multiple matrix degrading enzymes. Osteoarthr Cartil. 2017;25(5):779‐789. 10.1016/j.joca.2017.01.004. [DOI] [PubMed] [Google Scholar]
- 41. Rowas SA, Haddad R, Gawri R, et al. Effect of in utero exposure to diethylstilbestrol on lumbar and femoral bone, articular cartilage, and the intervertebral disc in male and female adult mice progeny with and without swimming exercise. Arthritis Res Ther. 2012;14(1):R17. 10.1186/ar3696. [DOI] [PMC free article] [PubMed] [Google Scholar]
- 42. Bedore J, Sha W, McCann MR, Liu S, Leask A, Seguin CA. Impaired intervertebral disc development and premature disc degeneration in mice with notochord‐specific deletion of CCN2. Arthritis Rheum. 2013;65(10):2634‐2644. 10.1002/art.38075. [DOI] [PubMed] [Google Scholar]
- 43. Trout JJ, Buckwalter JA, Moore KC. Ultrastructure of the human intervertebral disc: II. Cells of the nucleus pulposus. Anat Rec. 1982;204(4):307‐314. 10.1002/ar.1092040403. [DOI] [PubMed] [Google Scholar]
- 44. Kauppila LI. Ingrowth of blood vessels in disc degeneration. Angiographic and histological studies of cadaveric spines. J Bone Joint Surg Am. 1995;77(1):26‐31. 10.2106/00004623-199501000-00004. [DOI] [PubMed] [Google Scholar]
- 45. Tessier S, Tran VA, Ottone OK, et al. TonEBP‐deficiency accelerates intervertebral disc degeneration underscored by matrix remodeling, cytoskeletal rearrangements, and changes in proinflammatory gene expression. Matrix Biol. 2020;87:94‐111. 10.1016/j.matbio.2019.10.007. [DOI] [PMC free article] [PubMed] [Google Scholar]
- 46. Bonavita R, Vincent K, Pinelli R, Dahia CL. Formation of the sacrum requires down‐regulation of sonic hedgehog signaling in the sacral intervertebral discs. Biol Open. 2018;7(7):1‐8. 10.1242/bio.035592. [DOI] [PMC free article] [PubMed] [Google Scholar]
- 47. Tessier S, Doolittle AC, Sao K, et al. Arp2/3 inactivation causes intervertebral disc and cartilage degeneration with dysregulated TonEBP‐mediated osmoadaptation. JCI Insight. 2020;5(4):1‐19. 10.1172/jci.insight.131382. [DOI] [PMC free article] [PubMed] [Google Scholar]
- 48. Silagi ES, Novais EJ, Bisetto S, et al. Lactate efflux from intervertebral disc cells is required for maintenance of spine health. J Bone Miner Res. 2020;35(3):550‐570. 10.1002/jbmr.3908. [DOI] [PMC free article] [PubMed] [Google Scholar]
- 49. Landis JR, Koch GG. The measurement of observer agreement for categorical data. Biometrics. 1977;33(1):159‐174. [PubMed] [Google Scholar]
- 50. Sakai D, Nishimura K, Tanaka M, et al. Migration of bone marrow‐derived cells for endogenous repair in a new tail‐looping disc degeneration model in the mouse: a pilot study. Spine J. 2015;15(6):1356‐1365. 10.1016/j.spinee.2013.07.491. [DOI] [PubMed] [Google Scholar]
- 51. Dahia CL, Mahoney EJ, Durrani AA, Wylie C. Postnatal growth, differentiation, and aging of the mouse intervertebral disc. Spine (Phila Pa 1976). 2009;34(5):447‐455. 10.1097/BRS.0b013e3181990c64. [DOI] [PubMed] [Google Scholar]
- 52. Tsingas M, Ottone OK, Haseeb A, et al. Sox9 deletion causes severe intervertebral disc degeneration characterized by apoptosis, matrix remodeling, and compartment‐specific transcriptomic changes. Matrix Biol. 2020;94:110‐133. 10.1016/j.matbio.2020.09.003. [DOI] [PMC free article] [PubMed] [Google Scholar]
- 53. Tam V, Rogers I, Chan D, Leung VY, Cheung KM. A comparison of intravenous and intradiscal delivery of multipotential stem cells on the healing of injured intervertebral disk. J Orthop Res. 2014;32(6):819‐825. 10.1002/jor.22605. [DOI] [PubMed] [Google Scholar]
- 54. Fleiss JL. The measurement of interrater agreement. In: Fleiss JL, Levin B, CP M, eds. Statistical Methods for Rates and Proportions. 3rd ed. Hoboken, NJ: John Wiley & Sons, Inc; 2003:598‐626. [Google Scholar]
Associated Data
This section collects any data citations, data availability statements, or supplementary materials included in this article.
Supplementary Materials
Appendix S1: Supporting Information