Abstract
Objective
Despite reports on the effects of ankle-brachial index (ABI) improvement following endovascular therapy (EVT) on the limb prognosis, studies evaluating cardiovascular events are limited. We investigated whether or not ABI improvement 1 year following EVT was associated with cardiovascular events.
Methods
The I-PAD NAGANO registry is an observational multicenter cohort study that enrolled 337 patients with peripheral artery disease (PAD) who underwent EVT between August 2015 and July 2016. From this cohort, we identified 232 patients whose ABI data 1 year following EVT were available, after excluding patients with critical limb ischemia. We divided the patients into two groups according to the degree of ABI improvement 1 year following EVT (ΔABI) - the ΔABI <0.15 group and the ΔABI ≥0.15 group - and compared the outcomes. The primary endpoint was major adverse cardiovascular events (MACEs), including all - cause death, myocardial infarction (MI), and stroke. The secondary endpoints were major adverse limb events (MALEs), defined as a composite of target lesion revascularization and major amputation, all - cause death, MI, and stroke. The median follow-up period was 3.3 years.
Results
The incidence of MACEs was significantly higher in the ΔABI <0.15 group than in the ΔABI ≥0.15 group (ΔABI <0.15 vs. ΔABI ≥0.15, 25.8% vs. 11.9%, log-rank p=0.036), as was the incidence of stroke (14.1% vs. 2.2%, log-rank p=0.016). A Cox regression analysis revealed that ΔABI ≥0.15 was significantly associated with fewer MACEs (hazard ratio 0.38, 95% confidence interval 0.17-0.83, p=0.016).
Conclusion
An increase in ABI ≥0.15 at 1 year following EVT was a predictor of reduced MACEs.
Keywords: peripheral artery disease, endovascular therapy, ankle-brachial index, major adverse cardiovascular events
Introduction
The prevalence of peripheral artery disease (PAD) has been increasing (1). Furthermore, approximately half of patients with PAD are reported to have comorbid coronary artery disease (2-4), thus indicating the need for comprehensive medical treatment for polyvascular disease. Studies have reported that the incidence of major adverse cardiovascular events (MACEs) in patients with PAD who underwent endovascular therapy (EVT) is approximately 10-20% over a 3-year period (5-7). Although some studies have predicted the occurrence of MACEs using preoperative clinical data, only a few are based on the therapeutic effects of EVT.
As the ankle-brachial index (ABI) is a simple and noninvasive test, it can be repeated; furthermore, it is useful for not only screening but also evaluating therapeutic effects. It has been reported that ABI improvement following EVT predicts the limb prognosis (8); however, the ABI prediction ability of MACEs remains unknown.
Therefore, the present study evaluated whether or not ABI improvement following EVT is associated with the suppression of MACE occurrence.
Materials and Methods
Study population
This study consisted of a subanalysis of the I-PAD NAGANO registry (Improving prognosis of PAD patients undergoing endovascular treatment around NAGANO). The I-PAD NAGANO registry was a prospective, multicenter, observational registry in which 337 consecutive patients undergoing EVTs for any PAD of the lower extremities between August 2015 and July 2016 from 10 institutions were enrolled. This registry had no exclusion criteria and was an all-comer registry. The patients provided their informed consent. The present study was approved by each hospital's ethics committee and was conducted in accordance with the Declaration of Helsinki. The I-PAD NAGANO registry was registered with the University Hospital Medical Information Network Clinical Trials Registry, as accepted by the International Committee of Medical Journal Editors (UMIN-ID; 000018297).
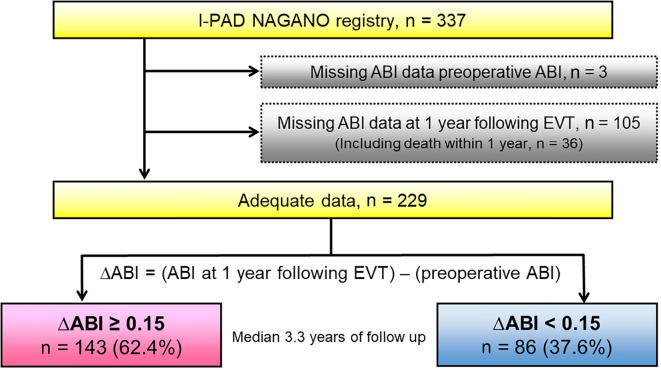
From this cohort of 337 patients, we identified 229 patients, after excluding 108 patients due to missing preoperative ABI data (n=3) or ABI data at 1 year following EVT (n=105), which included death within 1 year (n=36). We then divided the patients into two groups stratified by the cut-off ΔABI value, where the ΔABI means the ABI at 1 year following EVT minus the preoperative ABI. The median follow-up period was 3.3 years (Fig. 1).
Figure 1.
Study flow diagram illustrating the inclusion process and exclusion criteria.
Endpoints
The primary endpoint was MACEs, consisting of all-cause death, myocardial infarction (MI), and stroke. The secondary endpoints were major adverse limb events (MALEs), which were a composite of target lesion revascularization and major amputation from 1 year following EVT, all-cause death, cardiovascular death, nonfatal MI, and stroke.
Definitions
The ABI was calculated as the systolic blood pressure in the lower extremity divided by the maximum bilateral systolic blood pressure values in the upper extremities. The ABI after 1 year was measured at 365±30 days following EVT. MI was defined as a ≥2-fold increase in creatine kinase activity, troponin-T levels ≥0.1 ng/mL, or new Q waves in ≥2 contiguous electrocardiogram leads. Stroke was defined as brain ischemia due to thrombosis, embolism, or systemic hypoperfusion and brain hemorrhaging due to intracerebral or subarachnoid hemorrhaging, as recommended by the American Heart Association/American Stroke Association. Hypertension was defined as a systolic blood pressure ≥140 mmHg and/or a diastolic blood pressure ≥90 mmHg or the current use of antihypertensive agents. Based on the criteria of the Japan Atherosclerosis Society, dyslipidemia was defined as a total cholesterol level ≥220 mg/dL or a low-density lipoprotein cholesterol level ≥140 mg/dL, high-density lipoprotein cholesterol level ≤40 mg/dL, triglyceride level ≥150 mg/dL, or use of cholesterol-lowering agents. Diabetes mellitus was defined based on fasting blood glucose levels ≥126 mg/dL and/or a random plasma glucose level ≥200 mg/dL, a hemoglobin A1c (HbA1c) level ≥6.5%, or the use of insulin or hypoglycemic agents. The estimated glomerular filtration rate (eGFR) was calculated using the Japanese equation to estimate kidney function as follows: eGFR (mL/min/1.73 m2) =194× serum creatinine -1.094× age -0.287 for men and 194× serum creatinine -1.094× age -0.287×0.739 for women. The body mass index was calculated as the weight (kg) divided by height squared (m2). The left ventricular ejection fraction was measured via ultrasound echocardiography. The Clinical Frailty Scale was a frailty measurement that originated from Dalhousie University in Canada and scored on a scale from 1 (very fit) to 9 (terminally ill) based on clinical judgment (9). The severity of the arterial lesions was evaluated using the Trans-Atlantic Inter-Society Consensus (TASC) II classification for the aortoiliac and femoropopliteal segments (10).
Statistical analyses
As the Shapiro-Wilk test revealed that none of the continuous variables were normally distributed, continuous variables are expressed as median values with interquartile ranges (25-75th percentile). Conversely, categorical variables are expressed as numbers and percentages. Group differences in patient characteristics were evaluated using the χ2 test for categorical variables and the Mann-Whitney U test for continuous variables. Cumulative incidence was evaluated using the Kaplan-Meier method, and group differences were estimated using the log-rank test. A multivariate Cox regression analysis was conducted to determine whether or not the ΔABI was an independent predictor of MACEs. The receiver-operating characteristic (ROC) curve cut-off ΔABI value for the prediction of MACEs was selected as the value maximizing sensitivity and specificity. The predictive ability was determined using c-statistics. A p value <0.05 was considered to be statistically significant. Statistical analyses were conducted using the SPSS software version 26 (IBM, Armonk, USA).
Results
Baseline patient and lesion characteristics
The median age of the patients was 73.0 years old. Table 1 shows the baseline patient and lesion characteristics. The ΔABI <0.15 group tended to have more comorbidities than the ΔABI ≥0.15 group, but not significantly so. There was no marked difference in the prevalence of atrial fibrillation or in the B-type natriuretic peptide level between the two groups. The ΔABI <0.15 group had a significantly higher HbA1c level than the ΔABI ≥0.15 group. No marked difference was observed in the oral administration of medications, including anticoagulants and antiplatelets, between the groups. There were more patients treated for below-the-knee lesions in the ΔABI <0.15 group than the ΔABI ≥0.15 group, but the difference was not significant. In addition, there was no significant difference in the TASC classification between the two groups.
Table 1.
Patient and Lesion Characteristics.
| Variables | ∆ABI ≥ 0.15 (n=143) | ∆ABI < 0.15 (n=86) | p | |||
|---|---|---|---|---|---|---|
| Age | 72.3±8.0 | 73.7±9.4 | 0.239 | |||
| Male | 115 (80.4%) | 67 (77.9%) | 0.648 | |||
| Hypertension | 115 (80.4%) | 77 (89.5%) | 0.070 | |||
| Dyslipidemia | 90 (62.9%) | 60 (69.8%) | 0.292 | |||
| Diabetes | 67 (46.9%) | 47 (54.7%) | 0.253 | |||
| Hemodialysis | 26 (18.2%) | 16 (18.6%) | 0.936 | |||
| Current smoker | 20 (14.0%) | 15 (17.4%) | 0.521 | |||
| Previous smoker | 105 (73.4%) | 61 (70.9%) | 0.702 | |||
| Old myocardial infarction | 16 (11.2%) | 17 (19.8%) | 0.073 | |||
| Cerebrovascular disease | 26 (18.2%) | 21 (24.4%) | 0.258 | |||
| Atrial fibrillation | 26 (18.2%) | 12 (14.0%) | 0.405 | |||
| Body mass index (kg/m2) | 22.9±3.5 | 22.9±3.3 | 0.985 | |||
| LVEF (%) | 68.9 [60.0–73.0] | 66.1 [60.0–74.0] | 0.246 | |||
| Clinical frailty scale | 3.0 [2.0–3.0] | 3.0 [2.3–3.8] | 0.456 | |||
| Albumin (g/dL) | 4.1 [3.8–4.3] | 4.0 [3.7–4.2] | 0.086 | |||
| Hemoglobin (g/dL) | 13.9 [11.9–14.9] | 13.6 [11.8–14.4] | 0.671 | |||
| eGFR (mL/min/1.73m2) | 58.0 [34.8–69.2] | 50.0 [28.6–61.6] | 0.447 | |||
| Hemoglobin A1c (%) | 6.1 [5.6–6.8] | 6.5 [5.7–7.4] | 0.017 | |||
| LDL cholesterol (mg/dL) | 96.0 [78.0–116.3] | 94.0 [79.3–115.8] | 0.965 | |||
| HDL cholesterol (mg/dL) | 49.0 [41.0–60.3] | 48.0 [40.5–60.0] | 0.146 | |||
| BNP (pg/mL) | 69.1 [26.7–150.3] | 100.6 [46.3–150.4] | 0.145 | |||
| Medication | ||||||
| Aspirin | 123 (86.0%) | 68 (79.1%) | 0.171 | |||
| Thienopyridine | 105 (73.4%) | 67 (77.9%) | 0.448 | |||
| Cilostazol | 40 (28.0%) | 20 (23.3%) | 0.432 | |||
| Statin | 85 (59.4%) | 52 (60.5%) | 0.878 | |||
| ACE inhibitor | 12 (8.4%) | 12 (14.0%) | 0.183 | |||
| ARB | 64 (44.8%) | 46 (53.5%) | 0.200 | |||
| β-blocker | 44 (30.8%) | 19 (22.1%) | 0.155 | |||
| Anticoagulant | 27 (18.9%) | 14 (16.3%) | 0.619 | |||
| Warfarin | 13 (9.1%) | 6 (7.0%) | 0.574 | |||
| DOAC | 14 (9.8%) | 8 (9.3%) | 0.903 | |||
| Antithrombotic at 1 year following EVT | ||||||
| Single antiplatelet therapy | 60 (42.0%) | 37 (43.0%) | 0.982 | |||
| Aspirin alone | 24 (16.8%) | 18 (20.9%) | 0.725 | |||
| Thienopyridine alone | 32 (22.4%) | 16 (18.6%) | 0.794 | |||
| Cilostazol alone | 5 (3.5%) | 4 (4.7%) | 0.906 | |||
| Dual antiplatelet therapy | 71 (49.7%) | 41 (47.7%) | 0.959 | |||
| Aspirin and thienopyridine | 37 (25.9%) | 23 (26.7%) | 0.985 | |||
| Aspirin and cilostazol | 27 (18.9%) | 11 (12.8%) | 0.486 | |||
| Thienopyridine and cilostazol | 7 (4.9%) | 7 (8.1%) | 0.606 | |||
| Aspirin, thienopyridine, and cilostazol | 1 (0.7%) | 3 (3.5%) | 0.294 | |||
| Preoperative ABI | 0.63 [0.57–0.72] | 0.74 [0.61–0.94] | <0.001 | |||
| ABI 1 year following EVT | 0.97 [0.88–1.07] | 0.70 [0.60–0.88] | <0.001 | |||
| Rutherford class | ||||||
| ≤ 3 | 114 (79.7%) | 64 (74.4%) | 0.350 | |||
| 4 | 14 (9.8%) | 12 (14.0%) | 0.336 | |||
| ≤ 5 | 15 (10.5%) | 10 (11.6%) | 0.789 | |||
| Lesion site | 0.056 | |||||
| Aortoiliac only | 56 (39.2%) | 29 (33.7%) | ||||
| Femoropopliteal included | 85 (59.4%) | 51 (59.3%) | ||||
| Below the knee only | 2 (1.4%) | 6 (7.0%) | ||||
| CTO | 60 (42.0%) | 28 (32.6%) | 0.133 | |||
| TASC classification | 0.145 | |||||
| A | 42 (29.4%) | 27 (31.4%) | ||||
| B | 42 (29.4%) | 21 (24.4%) | ||||
| C | 17 (11.9%) | 13 (15.1%) | ||||
| D | 40 (28.0%) | 18 (20.9%) |
ABI: ankle-brachial index, ACE: angiotensin-converting enzyme, ARB: angiotensin II receptor blocker, BNP: B-type natriuretic peptide, CTO: chronic total occlusion, DOAC: direct oral anticoagulant, eGFR: estimated glomerular filtration rate, EVT: endovascular therapy, HDL: high-density lipoprotein, LDL: low-density lipoprotein, LVEF: left ventricular ejection fraction, TASC: Trans-Atlantic Inter-Society Consensus Document
Data are expressed as mean±SD, median [interquartile range], or n (%). The χ2 test was used for normal variables, and the Mann-Whitney U test was used for continuous variables.
The correlation between the degree of ABI improvement at six months and one year
In cases in which the ABI data 6 months following EVT were available, there was a correlation between the degree of ABI improvement at 6 months and 1 year (Pearson's correlation coefficient of 0.861) (Fig. 2).
Figure 2.
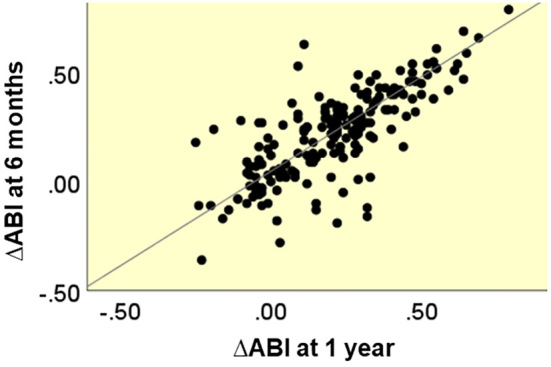
Distribution plots for the ∆ABI at 6 months and 1 year.
Clinical outcomes
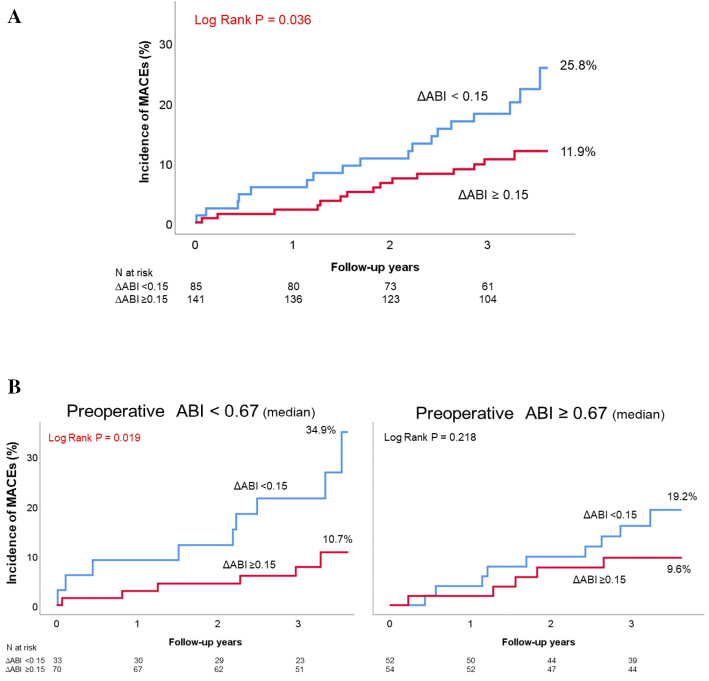
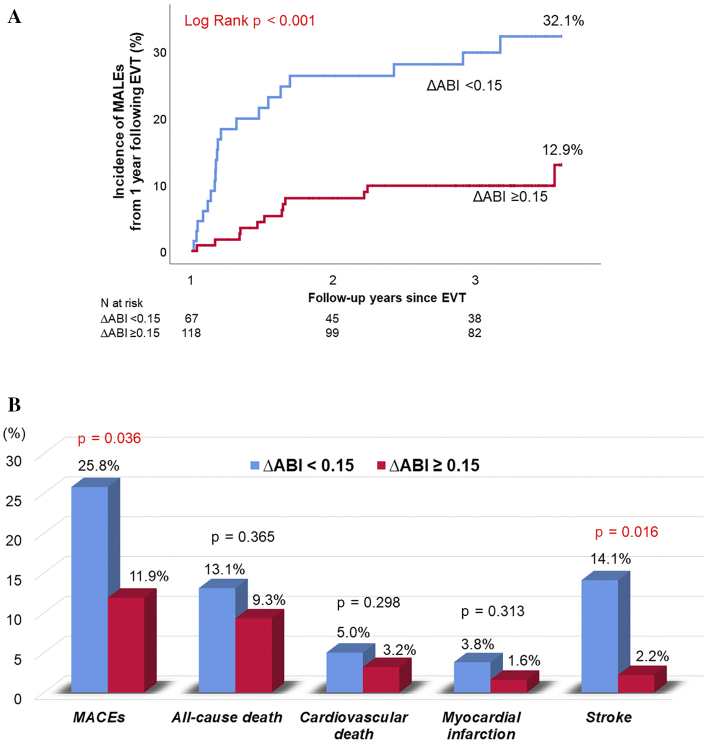
During the follow-up period (median, 3.3 years), a total of 33 MACEs (17.3%) occurred. In the Kaplan-Meier analysis, the incidence of MACEs was found to be significantly higher in the ΔABI <0.15 group than in the ΔABI ≥0.15 group (25.8% vs. 11.9%, log-rank p=0.036; Fig. 3A). When the patients were divided into groups with an ABI value higher and lower than the median preoperative value of 0.67 and then analyzed, there was a higher incidence of MACEs in the ΔABI <0.15 group, although the difference was not significant (Fig. 3B). The cumulative incidence of MALEs from 1 year following EVT was significantly higher in the ΔABI <0.15 group than in the ΔABI ≥0.15 group (32.1% vs. 12.9%, log-rank p<0.001; Fig. 4A). With respect to the secondary endpoints, the cumulative incidences of all-cause death, cardiovascular death, and MI were also not significantly different between the two groups. However, the incidence of stroke was significantly higher in the ΔABI <0.15 group than in the ΔABI ≥0.15 group (14.1% vs. 2.2%, log-rank p=0.016; Fig. 4B).
Figure 3.
(A) A Kaplan–Meier analysis for the incidence of MACEs. (B) Classification by the median preoperative ABI and a reanalysis.
Figure 4.
(A) A Kaplan–Meier analysis for the incidence of MALEs from 1 year following EVT. (B) Clinical outcomes. Event rates indicated the cumulative incidence estimated using the Kaplan-Meier method.
Prognostic impact of ΔABI on MACEs
In the multivariate Cox regression analysis, ΔABI ≥0.15 was found to be a favorable predictor of a MACE-free outcome after adjusting for the age, gender, and preoperative ABI (hazard ratio 0.38, 95% confidence interval 0.17-0.83, p=0.016; Table 2). In the ΔABI ROC analysis, the cut-off ΔABI for predicting MACEs obtained from the area under the curve was 0.15, which was similar to the value obtained in previous studies (Fig. 5).
Table 2.
Results of a Cox Regression Analysis for MACEs.
| Variables | Unadjusted HR (95% CI) | p | Adjusted HR (95% CI) | p | ||||
|---|---|---|---|---|---|---|---|---|
| Age | 1.05 (1.01-1.09) | 0.028 | 1.04 (1.00-1.09) | 0.072 | ||||
| Male | 0.96 (0.42-2.20) | 0.918 | 1.36 (0.52-3.53) | 0.536 | ||||
| Preoperative ABI | 0.80 (0.10-6.52) | 0.838 | 0.38 (0.05-3.12) | 0.369 | ||||
| ΔABI ≥0.15 | 0.49 (0.25-0.97) | 0.040 | 0.38 (0.17-0.83) | 0.016 |
ABI: ankle-brachial index, MACEs: major adverse cardiovascular events
Multivariate models were adjusted for age, male gender, and preoperative ABI.
Figure 5.
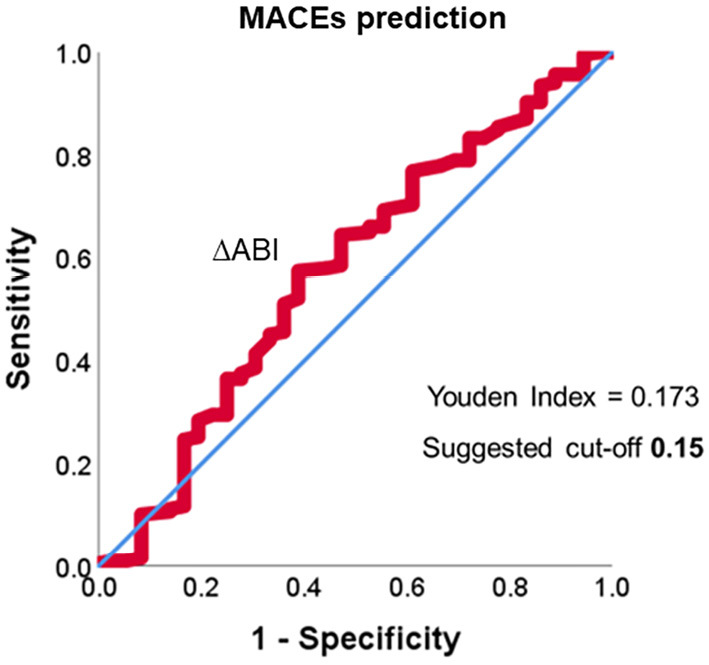
Receiver-operating characteristic curve for predicting MACEs.
The comparison to the ABI value one year following EVT
The ABI value 1 year following EVT was also a useful prognostic indicator; however, the c-statistic for the ABI at 1 year following EVT for predicting MACEs was 0.580, which was slightly less than the ΔABI of 0.586. The cut-off ABI value at 1 year following EVT for predicting MACEs was 0.58.
Discussion
The major findings of our study are as follows: 1) an increase in ABI ≥0.15 at 1 year following EVT was associated with fewer MACEs, and 2) there was a reduction in the incidence of stroke in particular. During a median follow-up of 3.3 years, the incidence of MACEs in the present study was 17.3%, which was consistent with the findings in previous studies.
In patients with PAD in whom the ABI value improved by ≥0.15 after receiving EVT, the 6-min walking test reportedly yielded better results (11), the symptoms of claudication were more improved (12), and the MALE rate was lower (8) than in patients with a ΔABI <0.15; furthermore, the rate of MACEs was also lower in these patients. A previous study reported that patients with a preoperative ABI value <0.66 had a higher mortality following EVT than those with a preoperative ABI value ≥0.66 (7). However, in our study, we found that even with a low preoperative ABI value, a better prognosis could be expected when a ΔABI of ≥0.15 was achieved. Although it was suspected that a higher ABI value at 1 year following EVT suggested that more stringent medical systemic management had been performed, no marked differences in the comorbidities or oral medication administration were observed. The ΔABI <0.15 group also had a significantly higher incidence of MALEs thereafter than the ΔABI ≥0.15 group. Since the ΔABI <0.15 group continued to suffer from more severe PAD than the ΔABI ≥0.15 group, the incidence of MALEs was considered to be high. An improvement in the ABI also improves the exercise capacity as a result of a decreased rate of MALEs. Since exercise capacity has been reported to be associated with a reduced mortality risk (13), the rate of MACEs might consequently be reduced. Furthermore, the improvement in the ABI following EVT reportedly correlated with the reduction in levels of reactive oxygen metabolites, which are markers of oxidative stress (14). Therefore, ABI improvement might have reduced the occurrence of cardiovascular events and atherosclerosis progression, thereby resulting in an improved prognostic effect.
As a secondary endpoint, the incidence of stroke differed markedly between the two groups. It has been reported that 2.4% of patients with PAD had ischemic stroke over a period of 30 months (15). Furthermore, when the baseline ABI value was <0.60, the hazard ratio was 1.309. As the incidence of ischemic stroke in the Japanese population has been reported to be 0.32% over 3 years (16), PAD was considered a substantial risk factor for stroke. It has been observed that the more time spent walking, the more ischemic strokes were prevented (17). Therefore, an increase in the ABI following EVT might reduce the incidence of strokes, which may also help to improve the walking function by avoiding motor paralysis. Walking time has been found to be associated with a reduced risk of mortality from stroke but not from coronary artery disease (17). Insulin resistance has been suggested as the reason for this finding. Indeed, studies have reported that insulin resistance is associated with a higher risk of ischemic stroke than of coronary artery disease (18,19). Moderate-intensity exercise, such as walking, has a greater effect on insulin resistance than high-intensity exercise. In addition, it may reduce the risk of stroke. Therefore, the ability to walk is important for preventing stroke. In the present study, the ΔABI ≥0.15 group had a significantly lower HbA1c level than the ΔABI <0.15 group, which may be a potential point of association.
In this study, the ABI value one year following EVT was also a useful prognostic indicator; however, the cut-off value for predicting MACEs was 0.58, which proved to be an extremely natural occurrence in daily clinical practice. Even in cases with a low preoperative ABI, an increase in the ABI by performing EVT can be expected to improve the prognosis, and we hope that the ΔABI value discussed in the present study can be useful in clinical practice.
Several limitations associated with the present study warrant mention. First, the symptoms (especially of claudication) and general clinical data were not evaluated following EVT. We discussed our results based on the assumption that the greater the increase in ABI value, the greater the improvement in claudication symptoms. Although previous reports have shown that ABI improvement was correlated with an improvement in claudication symptoms, such a result was not confirmed in our study. However, ABI measurement is considered to be a useful noninvasive modality and a repeatable evaluation tool because it can be performed easily. Therefore, it may be useful as an alternative to functional assessments, such as the 6-min walk test. Second, when assessing the treatment effects of EVT, the ABI immediately after EVT should be considered, but unfortunately, these data were not available. Some patients had undergone several sessions, so the timing of the evaluation was set at 1 year, which could be considered the steady state stage. Since the degrees of ABI improvement at 6 months and 1 year were correlated, the ABI immediately after EVT might also be correlated; however, evidence was insufficient to prove this point. Third, we analyzed a low number of cases. Fourth, the treatment strategy was decided by the attending physician. Finally, the lack of statistically significant findings might have been due to the effects of baseline characteristics that could not be excluded.
In conclusion, an increase in the ABI of ≥0.15 at 1 year following EVT was a predictor of reduced occurrence of MACEs. Therefore, it is important to not only perform EVT, leading to a much better ABI, but also perform close follow-up in order to maintain the improved ABI.
The authors state that they have no Conflict of Interest (COI).
References
- 1. Fowkes FG, Rudan D, Rudan I, et al. Comparison of global estimates of prevalence and risk factors for peripheral artery disease in 2000 and 2010: a systematic review and analysis. Lancet 382: 1329-1340, 2013. [DOI] [PubMed] [Google Scholar]
- 2. Ohman EM, Bhatt DL, Steg PG, et al. The REduction of Atherothrombosis for Continued Health (REACH) Registry: an international, prospective, observational investigation in subjects at risk for atherothrombotic events-study design. Am Heart J 151: 786.e781-710, 2006. [DOI] [PubMed] [Google Scholar]
- 3. Hur DJ, Kizilgul M, Aung WW, Roussillon KC, Keeley EC. Frequency of coronary artery disease in patients undergoing peripheral artery disease surgery. Am J Cardiol 110: 736-740, 2012. [DOI] [PMC free article] [PubMed] [Google Scholar]
- 4. Miura T, Minamisawa M, Ueki Y, et al. Impressive predictive value of ankle-brachial index for very long-term outcomes in patients with cardiovascular disease: IMPACT-ABI study. PloS One 12: e0177609, 2017. [DOI] [PMC free article] [PubMed] [Google Scholar]
- 5. Higashitani M, Uemura Y, Mizuno A, et al. Cardiovascular outcome and mortality in patients undergoing endovascular treatment for symptomatic peripheral artery disease―short-term results of the toma-code registry. Circ J 82: 1917-1925, 2018. [DOI] [PubMed] [Google Scholar]
- 6. Miura T, Soga Y, Miyashita Y, et al. Five-year prognosis after endovascular therapy in claudicant patients with iliofemoral artery disease. J Endovasc Ther 21: 381-388, 2014. [DOI] [PubMed] [Google Scholar]
- 7. Soga Y, Yokoi H, Urakawa T, Tosaka A, Iwabuchi M, Nobuyoshi M. Long-term clinical outcome after endovascular treatment in patients with intermittent claudication due to iliofemoral artery disease. Circ J 74: 1689-1695, 2010. [DOI] [PubMed] [Google Scholar]
- 8. Katsuki T, Yamaji K, Tomoi Y, Hiramori S, Soga Y, Ando K. Clinical impact of improvement in the ankle-brachial index after endovascular therapy for peripheral arterial disease. Heart Vessels 35: 177-186, 2020. [DOI] [PubMed] [Google Scholar]
- 9. Rockwood K, Song X, MacKnight C, et al. A global clinical measure of fitness and frailty in elderly people. Cmaj 173: 489-495, 2005. [DOI] [PMC free article] [PubMed] [Google Scholar]
- 10. Norgren L, Hiatt WR, Dormandy JA, et al. Inter-society consensus for the management of peripheral arterial disease (TASC II). Eur J Vasc Endovasc Surg 33 (Suppl): S1-S75, 2007. [DOI] [PubMed] [Google Scholar]
- 11. McDermott MM, Kibbe M, Guralnik JM, et al. Comparative effectiveness study of self-directed walking exercise, lower extremity revascularization, and functional decline in peripheral artery disease. J Vasc Surg 57: 990-996, 2013. [DOI] [PMC free article] [PubMed] [Google Scholar]
- 12. Je HG, Kim BH, Cho KI, Jang JS, Park YH, Spertus J. Correlation between patient-reported symptoms and ankle-brachial index after revascularization for peripheral arterial disease. Int J Mol Sci 16: 11355-11368, 2015. [DOI] [PMC free article] [PubMed] [Google Scholar]
- 13. Kokkinos P, Faselis C, Myers J, Sui X, Zhang J, Blair SN. Age-specific exercise capacity threshold for mortality risk assessment in male veterans. Circulation 130: 653-658, 2014. [DOI] [PubMed] [Google Scholar]
- 14. Ebisawa S, Kashima Y, Miyashita Y, et al. Impact of endovascular therapy on oxidative stress in patients with peripheral artery disease. Circ J 78: 1445-1450, 2014. [DOI] [PubMed] [Google Scholar]
- 15. Kolls BJ, Sapp S, Rockhold FW, et al. Stroke in patients with peripheral artery disease. Stroke 50: 1356-1363, 2019. [DOI] [PubMed] [Google Scholar]
- 16. Takashima N, Arima H, Kita Y, et al. Incidence, Management and short-term outcome of stroke in a general population of 1.4 million Japanese - Shiga Stroke Registry. Circ J 81: 1636-1646, 2017. [DOI] [PubMed] [Google Scholar]
- 17. Noda H, Iso H, Toyoshima H, et al. Walking and sports participation and mortality from coronary heart disease and stroke. J Am Coll Cardiol 46: 1761-1767, 2005. [DOI] [PubMed] [Google Scholar]
- 18. Folsom AR, Szklo M, Stevens J, Liao F, Smith R, Eckfeldt JH. A prospective study of coronary heart disease in relation to fasting insulin, glucose, and diabetes. The Atherosclerosis Risk in Communities (ARIC) Study. Diabetes Care 20: 935-942, 1997. [DOI] [PubMed] [Google Scholar]
- 19. Folsom AR, Rasmussen ML, Chambless LE, et al. Prospective associations of fasting insulin, body fat distribution, and diabetes with risk of ischemic stroke. The Atherosclerosis Risk in Communities (ARIC) Study Investigators. Diabetes Care 22: 1077-1083, 1999. [DOI] [PubMed] [Google Scholar]


