Abstract
Purpose:
To provide dosimetric data for an epidemiologic study on the risk of second primary esophageal cancer among breast cancer survivors, by reconstructing the radiation dose incidentally delivered to the esophagus of 414 women treated with radiation therapy for breast cancer during 1943–1996 in North America and Europe.
Methods and Materials:
We abstracted the radiation therapy treatment parameters from each patient’s radiation therapy record. Treatment fields included direct chest wall (37% of patients), medial and lateral tangentials (45%), supraclavicular (SCV, 64%), internal mammary (IM, 44%), SCV and IM together (16%), axillary (52%), and breast/chest wall boosts (7%). The beam types used were 60Co (45% of fields), orthovoltage (33%), megavoltage photons (11%), and electrons (10%). The population median prescribed dose to the target volume ranged from 21 Gy to 40 Gy. We reconstructed the doses over the length of the esophagus using abstracted patient data, water phantom measurements, and a computational model of the human body.
Results:
Fields that treated the SCV and/or IM lymph nodes were used for 85% of the patients and delivered the highest doses within 3 regions of the esophagus: cervical (population median 38 Gy), upper thoracic (32 Gy), and middle thoracic (25 Gy). Other fields (direct chest wall, tangential, and axillary) contributed substantially lower doses (approximately 2 Gy). The cervical to middle thoracic esophagus received the highest dose because of its close proximity to the SCV and IM fields and less overlying tissue in that part of the chest. The location of the SCV field border relative to the midline was one of the most important determinants of the dose to the esophagus.
Conclusions:
Breast cancer patients in this study received relatively high incidental radiation therapy doses to the esophagus when the SCV and/or IM lymph nodes were treated, whereas direct chest wall, tangentials, and axillary fields contributed lower doses.
Summary
The authors reconstructed doses incidentally delivered to the esophagus of breast cancer patients treated with radiation therapy during 1943–1996 in North America and Europe. Fields treating the supraclavicular and/or internal mammary lymph nodes were used for 85% of patients and delivered the highest doses within 3 regions of the esophagus: cervical (population median 38 Gy), upper (32 Gy), and middle thoracic (25 Gy). Other fields (direct chest wall, tangential, and axillary) contributed substantially lower doses (approximately 2 Gy).
Introduction
Breast cancer is the most common cancer among women worldwide and has among the highest rates of survivorship in Western Europe and North America (1, 2). As survival has improved and use of radiation therapy (RT) has expanded (3, 4), understanding the late effects of breast cancer RT has become increasingly important. Several studies have demonstrated an elevated risk of second primary esophageal cancer by comparing incidence rates in patients who received RT with those who did not (5). However, no previous study has documented the pattern of RT doses along the esophagus from a large number of patients treated with a wide variety of radiation fields.
Recently an international study investigated the risk of second primary esophageal cancer among breast cancer survivors in North America and Western Europe (6). To derive a dose–response relationship, it was necessary to reconstruct the doses incidentally delivered along the esophagus in the breast cancer patients treated with RT (7–9). In this article we describe the dose reconstruction method and summarize doses delivered to the esophagus from breast cancer RT during 1943–1996. An analysis of the doses is presented according to treatment parameters including field location and beam energy.
Methods and Materials
Breast cancer surgery and RT techniques
The patients for this study were selected from a case–control study of esophageal cancer among 289,748 ≥5-year survivors of breast cancer, treated between 1943 and 1996 and who were registered in 1 of 5 European and North American population-based cancer registries (6). The case–control study included 452 patients who received RT. For this analysis, we included the 414 women for whom the RT records contained sufficient information to reconstruct doses. Included in the study were 156 cases of second primary esophageal cancer and 258 controls (2 controls per case) matched on registry, birth date, race (United States only), breast cancer diagnosis date, and survival after breast cancer. This study was approved by each study center’s institutional review board and exempted from review by the National Cancer Institute because analyses used only existing deidentified data.
The surgical approach to treat breast cancer patients changed considerably during the study period (Fig. 1a). Before 1975 more than 80% of patients had a mastectomy, and less than 10% of patients had a lumpectomy. By 1995 fewer than 40% of the patients had a mastectomy, and more than 60% had a lumpectomy. With the transition from mastectomy to lumpectomy, there were simultaneous modifications in the RT techniques (Fig. 1b and c). The use of direct anterior chest wall (CW) postmastectomy treatment decreased beginning in the late 1970s, from 44% of patients to 10% by the late 1990s. The tangential fields were parallel-opposed fields tangent to the CW, treating the CW or the entire breast, whereas the boost was a small localized field delivering additional dose to the tumor bed. The use of tangential fields increased from 27% to 87% from 1975 to 1996, and these were more often delivered after lumpectomy. The supraclavicular (SCV) and internal mammary chain (IM) fields were direct anterior fields treating the regional lymph nodes. The SCV treatments also used a posterior field in early years. The medial border of the SCV fields was located along the body midline or a few centimeters either side of midline. The IM fields generally extended to the midline. As an alternative to treating the IM and SCV nodes in 2 separate fields, they were sometimes treated together in a single SCV-IM field, also called “hockey stick” (HS). An axillary field, direct and posterior, often completed the SCV irradiation. The use of SCV, IM, and SCV-IM fields decreased after 1975, with these types of fields generally reserved for advanced node-positive cases in later years.
Fig. 1.
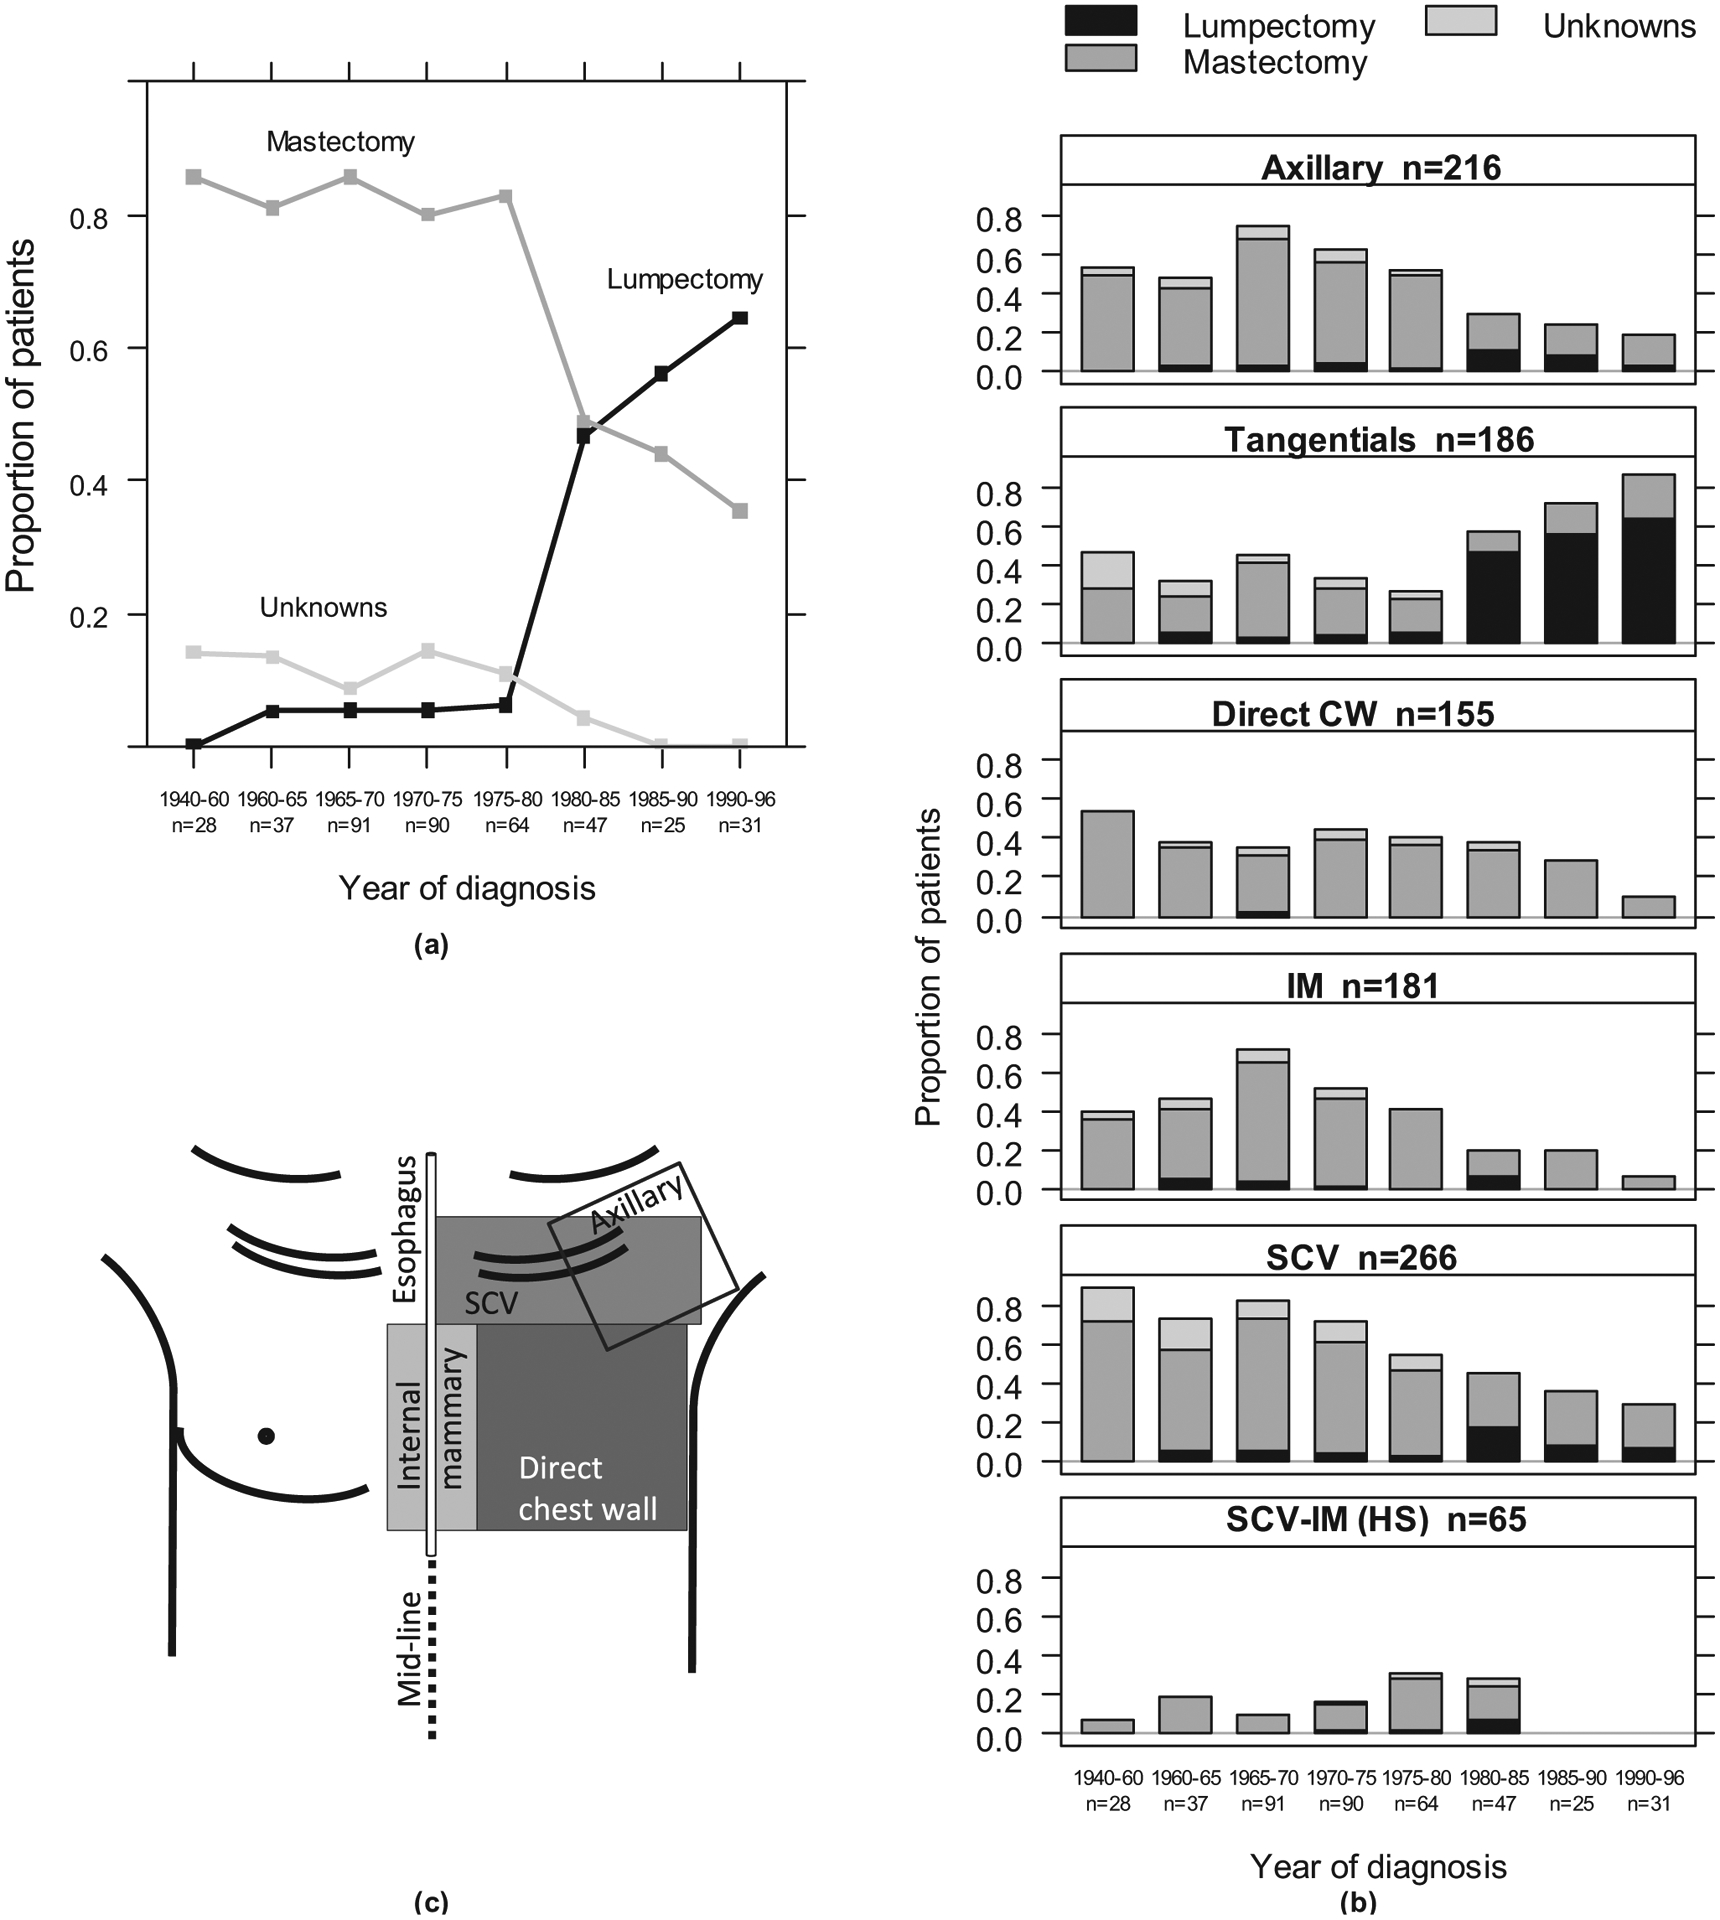
Time trends of breast cancer surgery (a) and radiation therapy fields (b) as diagrammed on the frontal patient’s skin (c) for 414 women. One patient had no surgery. There were 29 boosts, not shown. The numbers of patients are indicated. CW = chest wall; HS = hockey stick; IM = internal mammary; SCV = supraclavicular.
We abstracted each patient’s RT parameters, including treatment location(s), prescribed dose to the target volume or incident dose at dmax or in air, number of fields, field configuration(s), field size(s), and beam energies. In addition, dose per fraction was abstracted for a subset of patients with treatment field types of greatest interest to us (SCV, IM, and tangentials). The treatment beam types included 60Co (45% of fields), orthovoltage (33%), megavoltage photons (11%), and electrons (10%). Orthovoltage was most frequently used until the late 1960s, followed by 60Co during the 1970s and 1980s, and electrons and megavoltage photons from the late 1980s onward. The total prescribed dose to the tumor varied widely, from <15 to 65 Gy (Fig. 2), and generally increased with number of fractions. For example, for tangential fields, total prescribed tumor doses of 35 Gy and 50 Gy were typically delivered in 14 fractions and 25 fractions, respectively. We also observed differences in total dose and dose per fraction based on beam type. The total prescribed doses and number of fractions were typically lower (ie, higher dose per fraction) for orthovoltage compared with 60Co or megavoltage photon beams. For example, for orthovoltage treatments of SCV (with IM) fields, a total prescribed dose of 30 Gy was typically delivered in 10 fractions, whereas using 60Co, 40 Gy was delivered in 15 fractions.
Fig. 2.
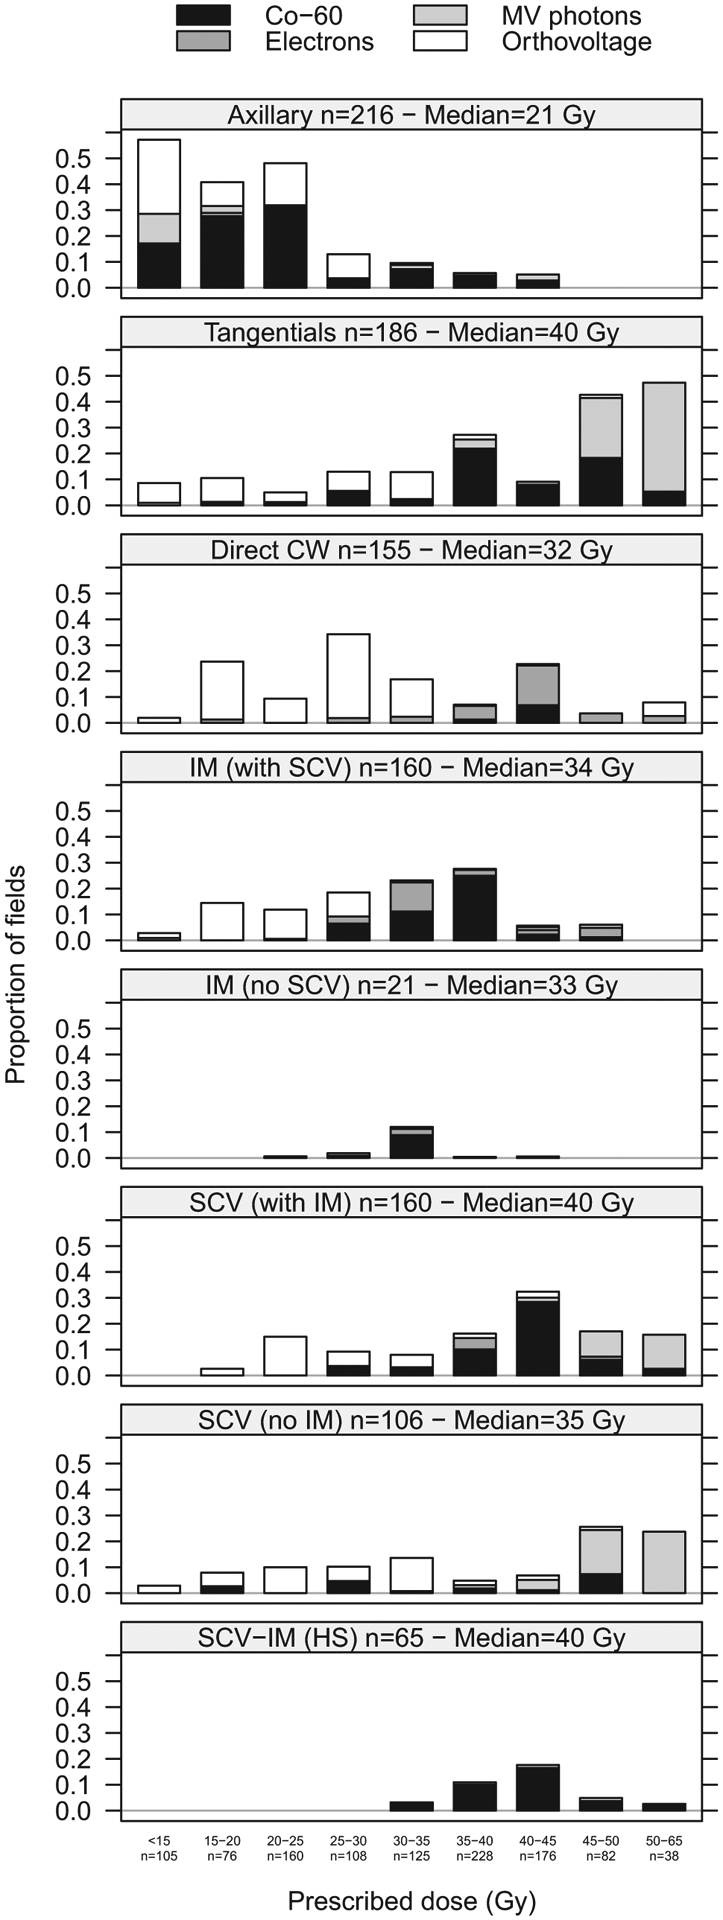
Proportion of fields by prescribed dose in grays (Gy) to the target volume, field, and beam types. HS = hockey stick; IM = internal mammary; SCV = supraclavicular.
Dose reconstruction
Before approximately 1980, computed tomography (CT) examinations were not available for RT treatment planning. Hence we had no information about individual patient size and shape. To reconstruct the doses, we used a computational phantom model of the human body (7) representing a typical adult patient. The median body mass index (BMI) of our cohort was 24 kg/m2, which was well within the range considered normal (18.5–25 kg/m2). Anatomic variations such as contour irregularities and internal tissue heterogeneities were not taken into account in the dose reconstruction.
The esophagus spans from the level of the 6th cervical vertebrae (C6) to the 11th thoracic vertebrae (T11) and is aligned closely with the midline of the body (10). We assessed doses at 25 locations in the esophagus at the level of each vertebrae and intervertebral disc space from the top of C6 to the gastroesophageal (GE) junction at the junction of T10/T11. We located the esophagus along the midline in the left–right direction. The calculation point for the GE junction was 2 cm left of midline. The depth of the esophagus from the anterior surface of the body varies along its length. To determine typical depths along the esophagus, we measured the distance from the center of the esophagus to the anterior surface at each vertebral level on contemporary deidentified chest CT images of 14 cancer patients from several institutions and with BMI ranging from 15.7 to 33.2 kg/m2. The depth of the esophagus increased from approximately 4 cm, on average, at the level of the cervical section, to approximately 12 cm, on average, at the lower thoracic section. The depth of the esophagus also increased with increasing BMI. For example, at the level of the T3 vertebrae, the depth was approximately 5 cm for BMI <18.5 kg/m2, approximately 6.1 cm for normal BMI, and approximately 8.2 cm for BMI >25 kg/m2. The average depth at each vertebrae level determined from 6 women with normal BMI was used for the dose reconstruction (Fig. 3). The esophagus was divided into 4 regions for analysis: cervical (from C6 to T2), upper thoracic (T3–T4), middle thoracic (T5–T7), and lower thoracic (T8-GE junction).
Fig. 3.
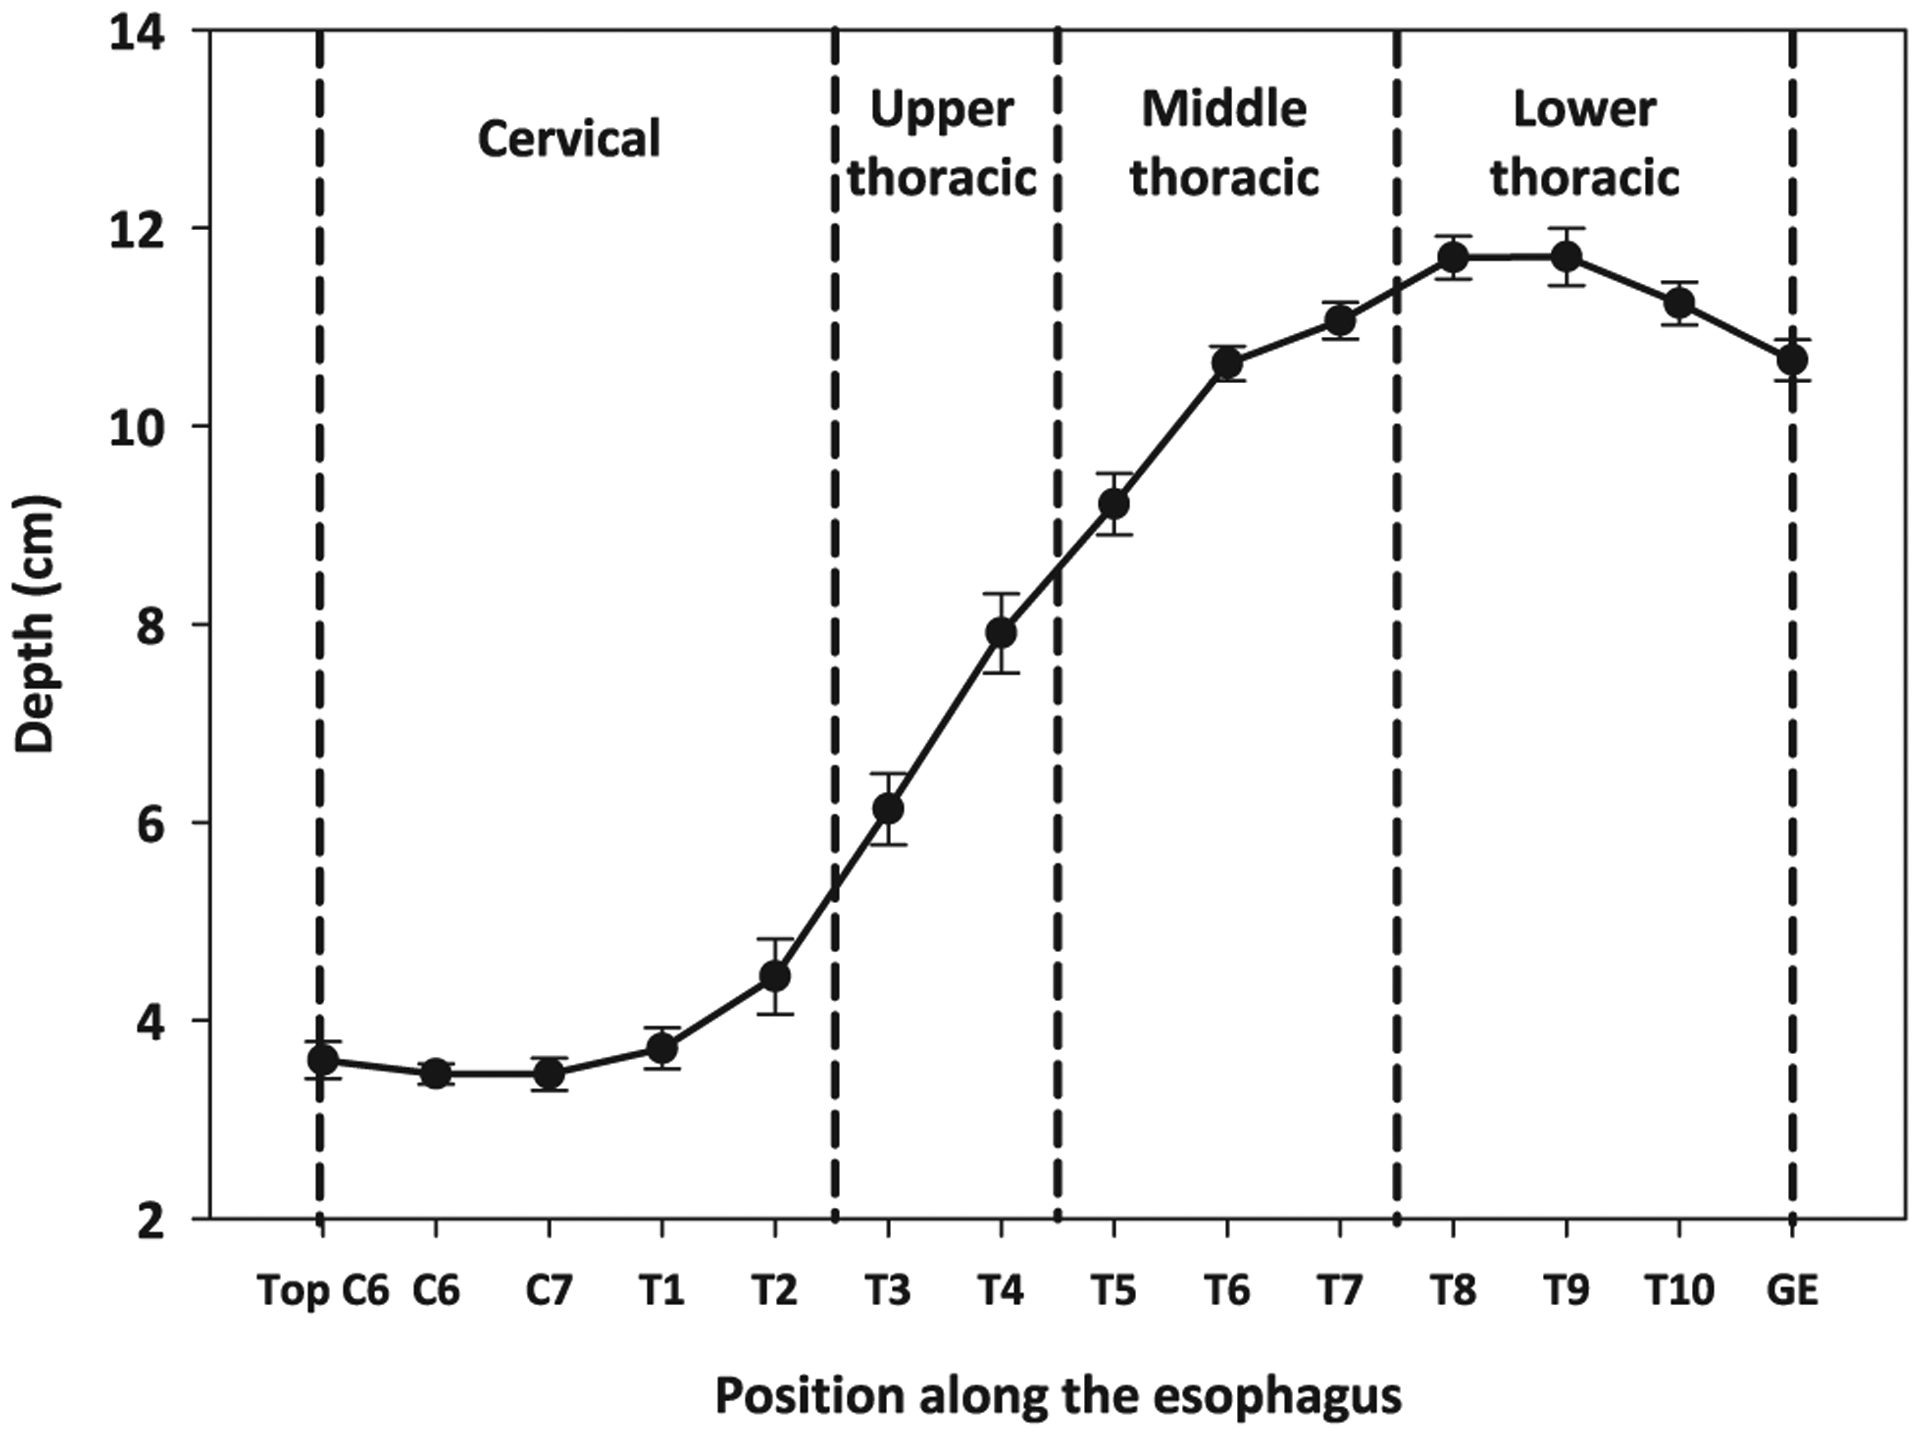
Mean depths of the esophagus at vertebrae landmarks measured on 6 CT scans and used for the dose reconstruction. Error bars represent the SEM. We divided the esophagus in 4 parts, as denoted. GE = gastroesophageal junction.
Treatment fields were located on the phantom relative to vertebral landmarks using the data abstracted from each patient’s treatment record. The SCV was located on the phantom with the superior border at the level of C6, the inferior border at T2, T4, or T5, and a medial border either at midline or 2 cm ipsilateral to the midline according to pictures or diagrams in the individual RT record. The SCV, IM, SCV-IM, and axillary fields were assumed to be directly anterior to posterior in orientation.
Point doses to the esophagus were calculated for individual breast radiation treatments using the methodology described by Stovall et al (7) and shown here as a formula. Doses in grays (Gy) were calculated to each point in an array, “o,” using Equation 1, where the array is the set of points used to describe the organ.
| (1) |
with i = [1,…,m], calculation points within the array “o”; j = [1,…,n], RT fields; Bj, energy of the jth radiation field; Aj, equivalent square of the jth radiation field; and D (dmax, Bj, Aj), the dose (Gy) on the central axis at the depth of maximum dose dmax for a field of beam energy Bj and of equivalent area Aj. If the treatment dose was prescribed at the target volume depth or in air, the dose at dmax was obtained using reference percent depth dose on the central axis and backscatter factors (11).
P is the percent of dose D(dmax, Bj, Aj) at oi, point located at depth dj from the patient surface and at distance lj perpendicular to the treatment field edge for field j of size Aj and beam energy Bj. If the point oi was within the field, P was obtained from percent depth dose data (11). Otherwise, P was derived from out-of-beam measurements conducted in a water phantom (7).
Results
Pattern of the incidental dose to the esophagus by treatment field type
The pattern of the median dose to the esophagus among patients in this study shown by field type in Figure 4a was derived from all field locations and sizes, beam energies, and prescribed doses to the target volume. The SCV and IM field types contributed the highest doses to the esophagus, whereas the direct CW, tangentials, axillary, and boost fields generally contributed less than 2 Gy (population median) at any point along the esophagus.
Fig. 4.
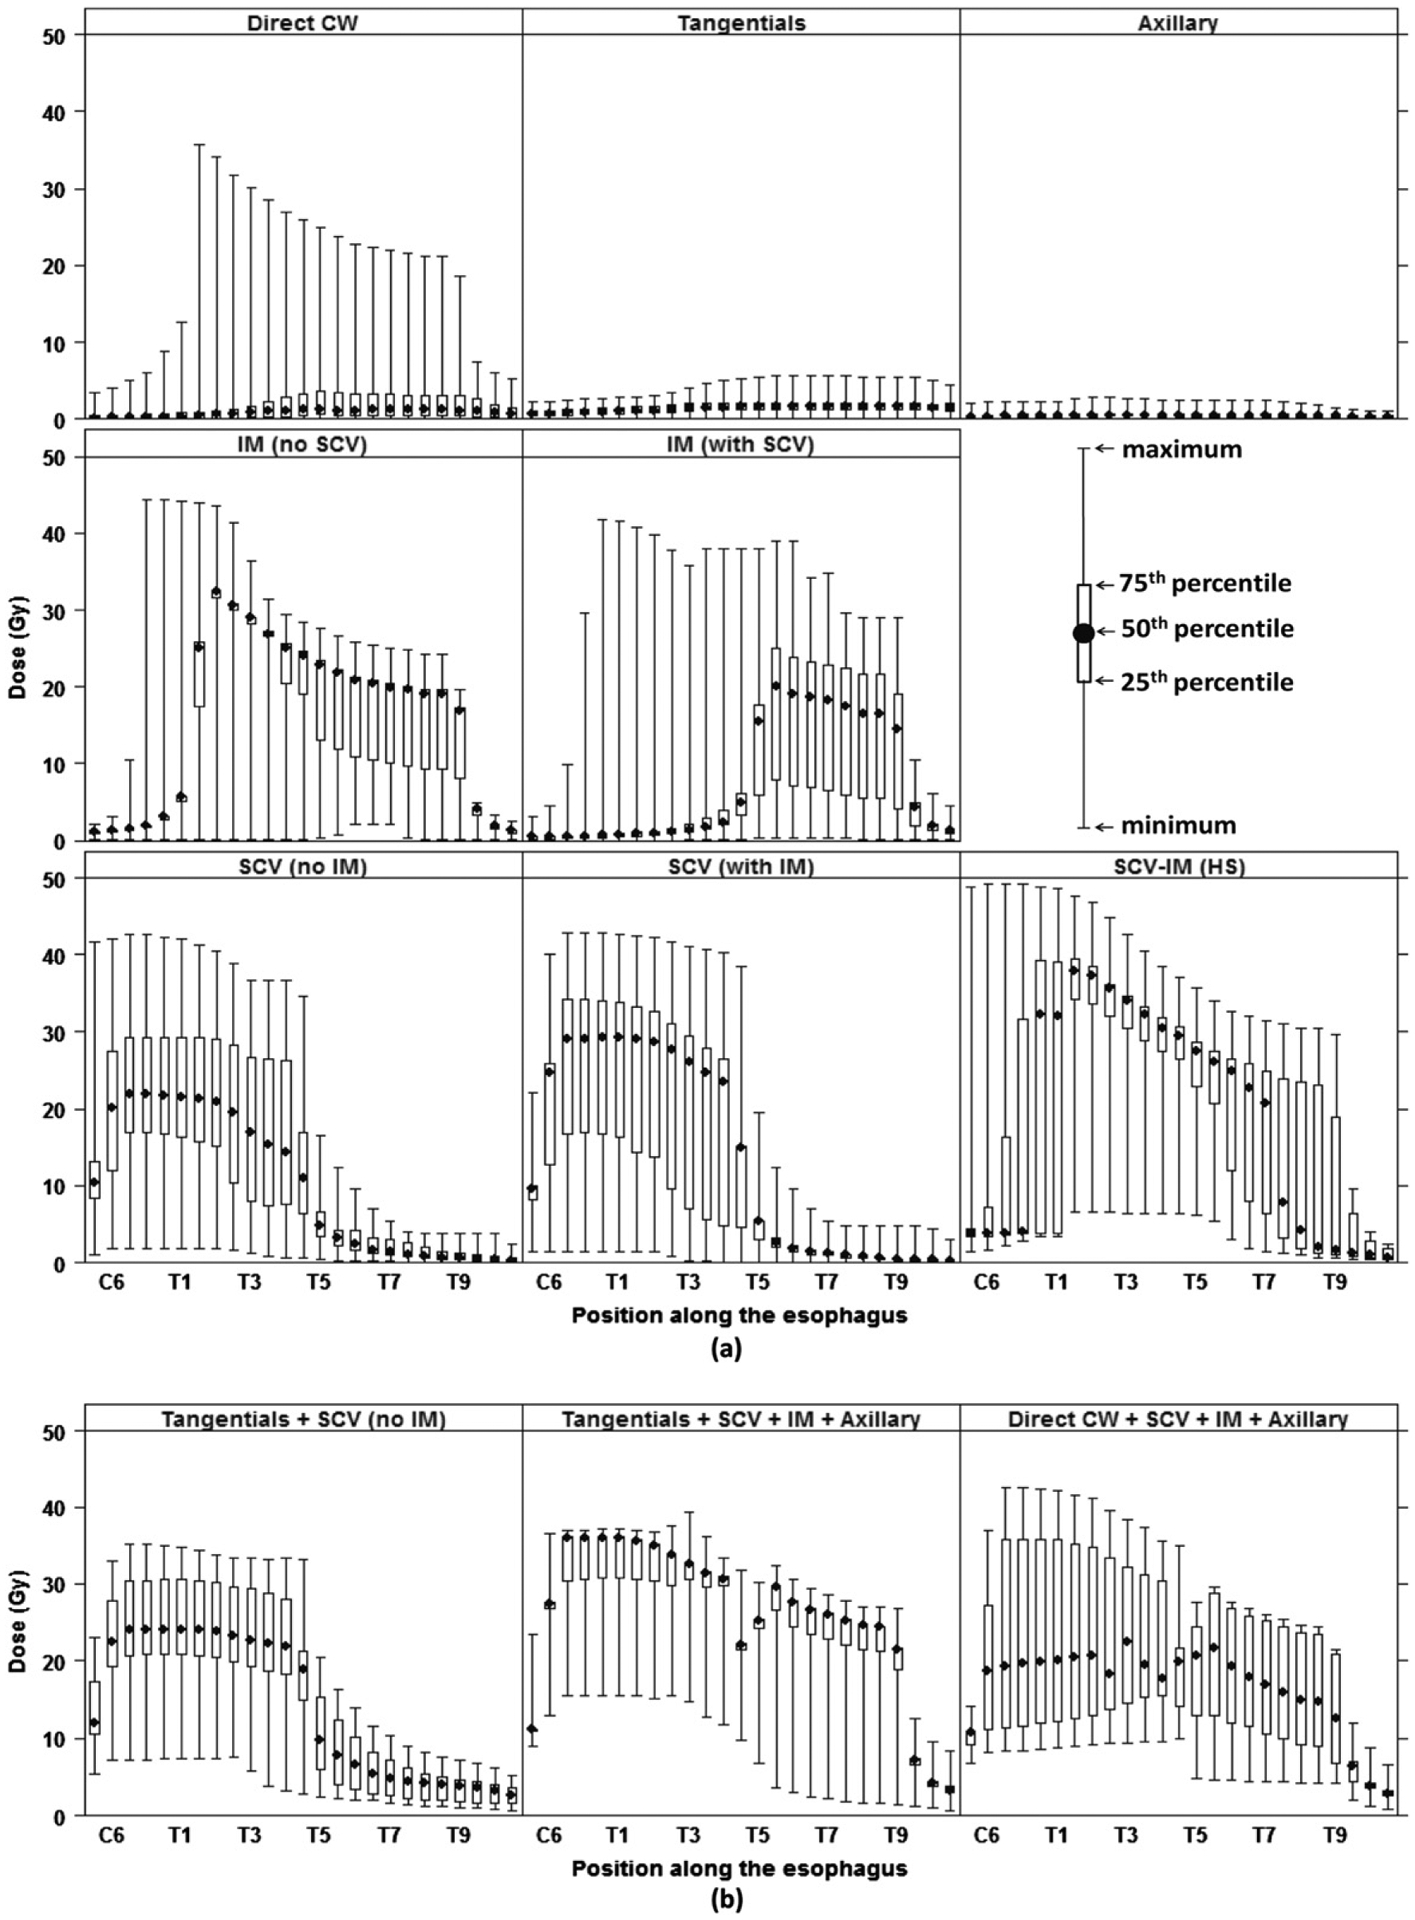
Pattern of dose in grays (Gy) to the esophagus (a) by field type and (b) for the most frequent field combinations. HS = hockey stick; IM = internal mammary; SCV = supraclavicular. Top left: a small number of direct CW fields had large sizes contributing to high doses.
The SCV fields were delivered either with a separate IM field and denoted as SCV (with IM) or without IM field and denoted as SCV (no IM). The SCV fields delivered 20–30 Gy (population median) to the cervical esophagus, 15–25 Gy to the upper thoracic esophagus, 10–15 Gy to the highest portion of the cervical esophagus (at C6) and lowest portion of the upper thoracic esophagus, and <5 Gy to the middle and lower thoracic esophagus (Fig. 4a). The IM fields, denoted as IM (no SCV) and IM (with SCV), had different field lengths depending on whether they were accompanied by the SCV. The IM (with SCV) fields delivered 15–20 Gy to the middle and lower thoracic esophagus to T9, but the IM (no SCV) also covered the upper thoracic esophagus (20–32 Gy). The SCV-IM delivered >20 Gy to the upper, middle, and lower thoracic esophagus and delivered the highest doses of all field types (up to 38 Gy, median at T2).
In Figure 4a, the length of the boxplots is indicative of the variation of dose by field among patients, which resulted from the combination of the treatment parameters. The location of the SCV field border relative to the body’s midline determined whether the points representing the cervical and upper thoracic esophagus lay inside or outside of the SCV field, resulting in a possible 3-fold dose variation between a medial field border at midline versus 2 cm ipsilateral of midline.
Whereas Figure 4a shows a summary of point-doses delivered over the length of the esophagus by individual fields, total dose is also an important metric used in health risk studies. The patients in our cohort were treated using a large variety of treatment field combinations. The 4 most frequently used field combinations were (1) tangentials + SCV + IM + axillary (11%), (2) direct CW + SCV + IM + axillary (10%), (3) tangentials only (8%), and (4) tangentials + SCV (7%). These 4 combinations delivered a total dose of approximately 30 Gy (population average from C6 to T9), 20 Gy (C6 to T9), <2 Gy (entire esophagus), and 23 Gy (C6 to T5), respectively (Fig. 4a and b). In 85% of the field combinations, at least 1 of the 3 field types contributing the highest doses (on average) were used (SCV, IM, or SCV-IM).
Influence of beam energy
The pattern of the dose along the esophagus depended strongly on the beam energy (Fig. 5). This variation was related to the total prescribed dose and the depth dose curves for each beam energy. For megavoltage photon beams, the median total prescribed dose was 47 Gy, compared with 38 Gy and 25 Gy for 60Co and orthovoltage beams, respectively. At a given depth of the esophagus, higher photon energies resulted in greater dose (MV > 60Co > orthovoltage), primarily owing to less attenuation in the overlying tissue. However, parts of the esophagus located at deeper depths generally received less absolute dose than those at shallower depths. With electrons, the esophagus dose was highly dependent on the esophagus depth because of the sharp fall-off in electron dose with depth.
Fig. 5.
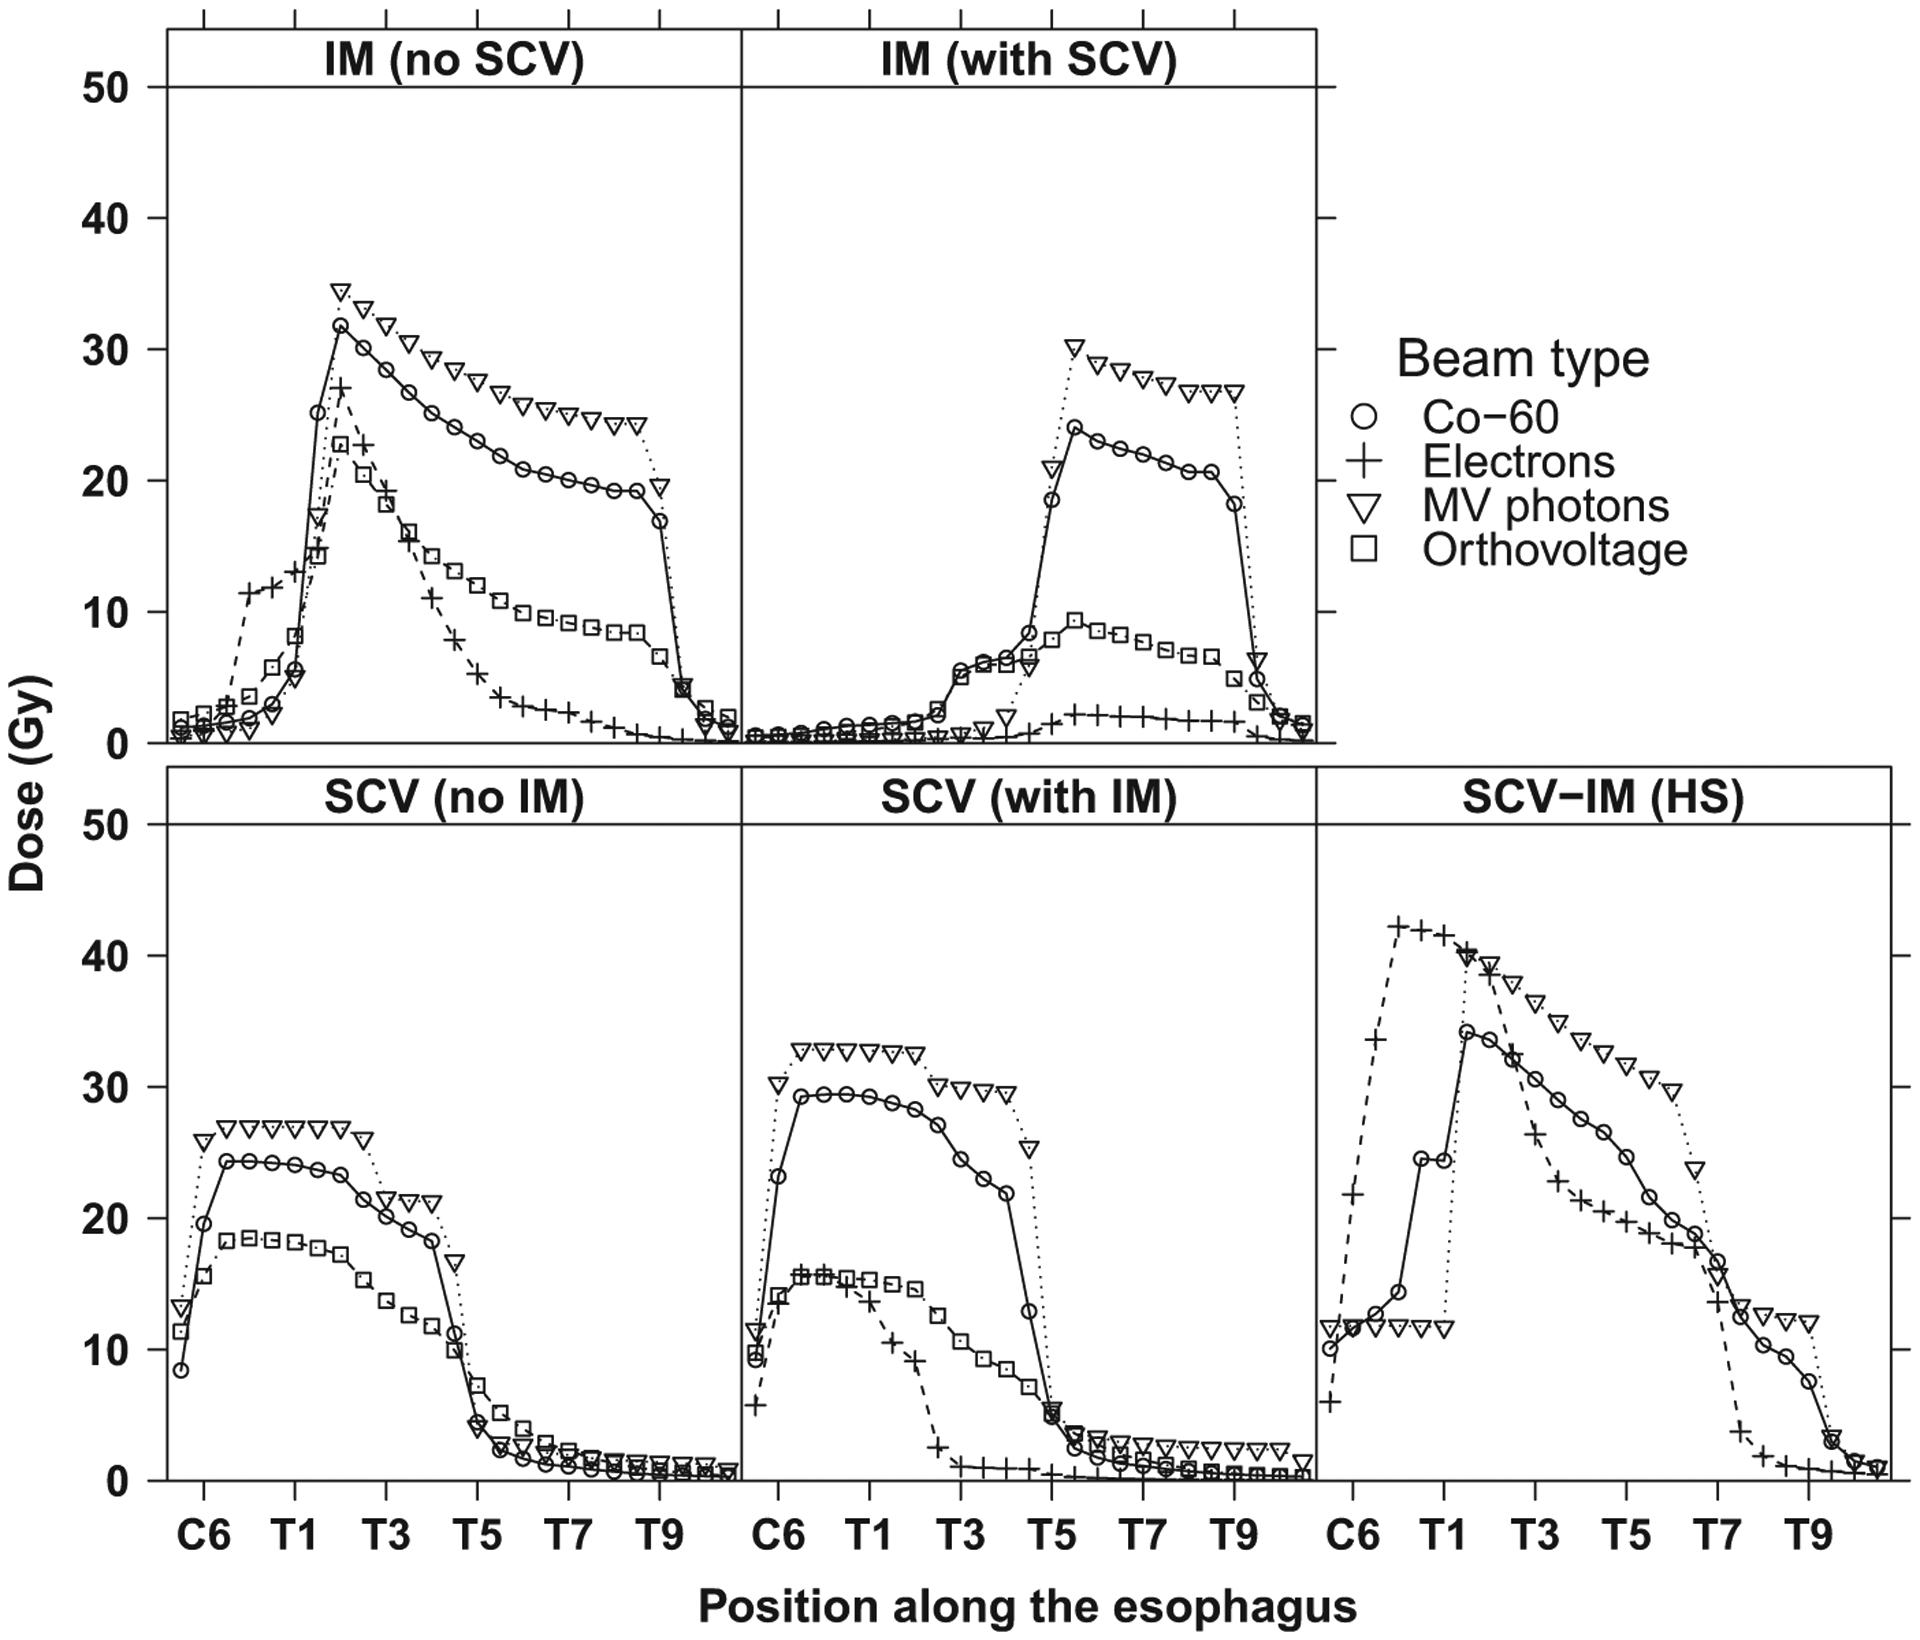
Mean dose in gray (Gy) to the esophagus for selected breast cancer radiation therapy fields by beam type. HS = hockey stick; IM = internal mammary; SCV = supraclavicular.
Outside the beam, the dose to the esophagus decreased at a faster rate for higher energy photon beams than for lower energy beams because the width of the beam penumbra decreases with increasing energy and increasing source–skin distance (50 cm for orthovoltage, 80 cm for 60Co, 100 cm for MV photons).
Discussion
To support an epidemiologic study on second primary esophageal cancer risk after breast cancer RT, we reconstructed the incidental radiation doses to the esophagus for RT treatments delivered in North America and Europe during 1943–1996 and identified the treatment parameters that influenced the esophagus dose. The SCV, IM, and SCV-IM fields were frequently used (85% of patients) and delivered the highest doses within 3 regions of the esophagus: cervical (population median up to 38 Gy), upper thoracic (32 Gy), and middle thoracic (25 Gy). Other fields (direct CW, tangential, axillary, and boost) contributed much less dose (approximately 2 Gy). The cervical, upper, and middle thoracic esophagus received large fractions of the prescribed doses (up to 100%, 90%, and 60%, respectively) because these esophagus parts are generally on the edge of, or within, the SCV and IM fields and are close to the anterior surface.
Risk of esophageal cancer after breast cancer RT was previously reported by Zablotska et al (5) and references therein. However, dose to the esophagus was not quantified, and thus the radiation dose–response model could not be evaluated. The dosimetry approach outlined in this study with quantitative reconstruction of esophagus doses from breast RT enabled the computation of a radiation dose–response relationship for esophageal cancer in our epidemiologic study (6). Furthermore, doses to the specific location of the esophageal tumor were estimated for the cases and at the same location for the matched control, an improvement over a simple average dose across the entire esophagus.
Data in Figures 2 and 5 can be useful to evaluate esophageal doses incidentally delivered to breast cancer patients treated in the past. Using the incidental dose to the esophagus and the previously described excess odds ratio for esophageal cancer per gray of 0.09 (6), the risk of second primary esophageal cancer can be estimated.
Uncertainty
Retrospective dose reconstruction of historic RT treatments is particularly challenging for cases where RT parameters where not recorded or when details on individual patient’s anatomy are not available, often the case when treatments took place before the use of CT scans for RT treatment planning. Incomplete data and assumptions made in modeling the patient’s body and RT treatment field result in uncertainty in dose estimates. In our analysis, we found that 3 sources of uncertainty were dominant, one potentially resulting in overestimation of dose, one potentially resulting in either over- or underestimation, depending on the difference in the true BMI from the assumed value, and one potentially resulting in underestimation, but only for cervical esophagus. The first and third sources of uncertainty are viewed as systematic sources of error, though their potential effects are in opposing directions, whereas the second source is viewed as random. We discuss each source of uncertainty in simple terms.
Uncertainty in location of SCV field and esophagus
The location of the SCV medial field edges relative to the position of the esophagus is an important source of uncertainty and is determined by (1) the actual location of the SCV field border relative to midline, and (2) the actual position of the esophagus relative to midline. Sixty-two percent of the RT records included either a photograph of the field outlined on the skin surface or a simple anatomic diagram showing the position of the field borders; the most common border was at midline. For the remaining 38% of the patients, the field border was unknown but assumed at midline. The position of the esophagus was assumed to be at midline for all patients but may actually vary up to 2 cm laterally in either direction. If the patient’s esophagus was actually outside the SCV treatment field but was assumed at the field edge, the dose would be overestimated by a factor of 3. We believe that less than 5% of the unknown cases may be in error more than this.
Uncertainty in esophagus depth
Another source of uncertainty in the esophagus doses is the variation between individual patient esophageal depths and the depths that were selected for the phantom calculations. This uncertainty is greatest when the patient’s true BMI deviates from “typical” values (18.5–25 kg/m2) that we assumed in this work. In the case of a patient whose true BMI was <18.5 kg/m2, the dose in the cervical esophagus might be underestimated by 5% for orthovoltage radiation and 3% for 60Co (on the central axis of 15 × 15-cm2 field). Conversely, for a patient with a true BMI >25 kg/m 2, the dose in the cervical esophagus may be overestimated by as much as 12%. These percent uncertainties due to depth would be greater in the thoracic esophagus, where doses were, however, much lower.
Uncertainty due to tissue heterogeneity
The phantom used for dose calculations is water equivalent and does not account for tissue heterogeneities (ie, trachea and sternum). The dose to the cervical esophagus may be underestimated by approximately 15% for 220 kV (orthovoltage) and approximately 4% for 60Co because of the presence of the trachea anterior to the esophagus (12). The trachea and the sternum lie above the upper thoracic and middle esophagus, such that the doses estimated in water should be close to the true doses, because the overestimation of dose in air and the underestimation in bone compensate for one another (13).
Conclusions
Our work, for the first time, quantified the pattern of incidental doses to the esophagus from breast cancer RT treatments conducted in the second half of the 20th century in North America and Western Europe. Importantly, doses to the specific location of the esophageal tumor were estimated for the cases and at the same location for the matched control, an improvement over a simple average dose across the entire esophagus. This strategy can be an advantage for many types of retrospective risk studies of second primary cancers and other late effects after RT (8) and was a significant contribution to the derivation of a radiation dose–response relationship for esophageal cancer after RT for breast cancer (6).
Acknowledgments—
The authors thank Jeremy Miller (Information Management Services, Silver Spring, MD) and Robert. M. Weinstock (deceased) for computer programming support, Dr Marc Faraldi (Centre hospitalier universitaire Compiegne, France) and Dr X. Allen Li (Department of Radiation Oncology, Medical College of Wisconsin) for enabling the measurements on CT images, Dr James A. Deye (Radiation Research Program, National Cancer Institute) for his scientific contribution, and Dr Stephanie Kovalchik (National Cancer Institute) for assistance with R software and graphing.
This study was funded by the Intramural Research Program of the National Cancer Institute, National Institutes of Health, US Department of Health and Human Services.
Footnotes
Conflict of interest: none.
References
- 1.Jemal A, Bray F, Center MM, et al. Global cancer statistics. CA Cancer J Clin 2011;61:69–90. [DOI] [PubMed] [Google Scholar]
- 2.Sant M, Allemani C, Santaquilani M, et al. Eurocare-4. Survival of cancer patients diagnosed in 1995–1999. Results and commentary. Eur J Cancer 2009;45:931–991. [DOI] [PubMed] [Google Scholar]
- 3.Schaapveld M, Visser O, Louwman MJ, et al. Risk of new primary nonbreast cancers after breast cancer treatment: A dutch population-based study. J Clin Oncol 2008;26:1239–1246. [DOI] [PubMed] [Google Scholar]
- 4.Ries LAG, Melbert D, Krapcho M, et al. Seer Cancer Statistics Review, 1975–2005. Bethesda, MD: National Cancer Institute; 2008. [Google Scholar]
- 5.Zablotska LB. Increased risk of squamous cell esophageal cancer after adjuvant radiation therapy for primary breast cancer. Am J Epidemiol 2005;161:330. [DOI] [PubMed] [Google Scholar]
- 6.Morton LM, Gilbert ES, Hall P, et al. Risk of treatment-related esophageal cancer among breast cancer survivors. Ann Oncol 2012;23:3081–3091. [DOI] [PMC free article] [PubMed] [Google Scholar]
- 7.Stovall M, Weathers R, Kasper C, et al. Dose reconstruction for therapeutic and diagnostic radiation exposures: Use in epidemiological studies. Radiat Res 2006;166:141–157. [DOI] [PubMed] [Google Scholar]
- 8.Travis LB, Ng AK, Allan JM, et al. Second malignant neoplasms and cardiovascular disease following radiotherapy. J Natl Cancer Inst 2012;104:357–370. [DOI] [PMC free article] [PubMed] [Google Scholar]
- 9.Taylor CW, Nisbet A, McGale P, et al. Cardiac exposures in breast cancer radiotherapy: 1950s-1990s. Int J Radiat Oncol Biol Phys 2007;69:1484–1495. [DOI] [PubMed] [Google Scholar]
- 10.Patti MG, Gantert W, Way LW. Surgery of the esophagus: Anatomy and physiology. Surg Clin N Am 1997;77:959–970. [DOI] [PubMed] [Google Scholar]
- 11.Bewley DK, Bradshaw AL, Burns JE, et al. Central axis depth dose data for use in radiotherapy. A survey of depth doses and related data measured in water or equivalent media. Br J Radiol 1983;17:1–147. [PubMed] [Google Scholar]
- 12.Khan FM. The physics of radiation therapy. 3rd ed. Philadelphia: Lippincott Williams & Wilkins; 2003. [Google Scholar]
- 13.Task Group No. 65 of the Radiation Therapy Committee of the American Association of Physicists in Medicine. Tissue Inhomogeneity Corrections for Megavoltage Photon Beams. AAPM Report No. 85. Madison, WI: Medical Physics Publishing; 2004. [Google Scholar]


