

Key Points
Question
Is Medicare eligibility associated with reductions in racial and ethnic disparities in access to care and health?
Findings
In this cross-sectional study using a regression discontinuity design, eligibility for Medicare at age 65 years was associated with reductions in racial and ethnic disparities in insurance coverage, access to care, and self-reported health across the US, but not mortality.
Meaning
Expanding eligibility for Medicare may be a viable means to reduce racial and ethnic disparities and advance health equity by closing gaps in insurance coverage.
Abstract
Importance
Medicare provides nearly universal health insurance to individuals at age 65 years. How eligibility for Medicare affects racial and ethnic disparities in access to care and health is poorly understood.
Objective
To assess the association of Medicare with racial and ethnic disparities in access to care and health.
Design, Setting, and Participants
This cross-sectional study uses regression discontinuity to compare racial and ethnic disparities before and after age 65 years, the age at which US adults are eligible for Medicare. There are a total of 2 434 320 respondents in the Behavioral Risk Factor Surveillance System and 44 587 state-age-year observations in the US Centers for Disease Control and Prevention Wide-Ranging Online Data for Epidemiologic Research Data (eg, the mortality rate for individuals age 63 years in New York in 2017) from January 2008 to December 2018. The data were analyzed between February and May 2021.
Exposures
Eligibility for Medicare at age 65 years.
Main Outcomes and Measures
Proportions of respondents with health insurance, as well as self-reported health and mortality. To examine access, whether respondents had a usual source of care, encountered cost-related barriers to care, or received influenza vaccines was assessed.
Results
Of 2 434 320 participants, 192 346 were Black individuals, 104 294 were Hispanic individuals, and 892 177 were men. Immediately after age 65 years, insurance coverage increased more for Black respondents (from 86.3% to 95.8% or 9.5 percentage points; 95% CI, 7.6-11.4) and Hispanic respondents (from 77.4% to 91.3% or 13.9 percentage points; 95% CI, 12.0-15.8) than White respondents (from 92.0% to 98.5% or 6.5 percentage points; 95% CI, 6.1-7.0). This was associated with a 53% reduction compared with the size of the disparity between White and Black individuals before age 65 years (5.7% to 2.7% or 3.0 percentage points; 95% CI, 0.9-5.1; P = .003) and a 51% reduction compared with the size of the disparity between White and Hispanic individuals before age 65 years (14.6% to 7.2% or 7.4 percentage points; 95% CI, 5.3-9.5; P < .001). Medicare eligibility was associated with narrowed disparities between White and Hispanic individuals in access to care, lowering disparities in access to a usual source of care from 10.5% to 7.5% (P = .05), cost-related barriers to care from 11.4% to 6.9% (P < .001), and influenza vaccination rates from 8.1% to 3.3% (P = .01). For disparities between White and Black individuals, access to a usual source of care before and after age 65 years was not significantly different: 1.2% to 0.0% (P = .24), cost-related barriers to care from 5.8% to 4.3% (P = .22), and influenza vaccinations from 11.0% to 10.3% (P = .60). The share of people in poor self-reported health decreased by 3.8 percentage points for Hispanic respondents, 2.6 percentage points for Black respondents, and 0.2 percentage points for White respondents. Mortality-related disparities at age 65 years were unchanged. Medicare’s association with reduced disparities largely persisted after the US Affordable Care Act took effect in 2014.
Conclusions and Relevance
In this cross-sectional study that uses a regression discontinuity design, eligibility for Medicare at age 65 years was associated with marked reductions in racial and ethnic disparities in insurance coverage, access to care, and self-reported health.
This cross-sectional study examines the association of Medicare with racial and ethnic disparities in access to care and health.
Introduction
The COVID-19 pandemic, which has disproportionately affected communities of color,1,2,3 and protests over racial injustice in the US have focused attention on health care and health equity. Most proposals to expand access to care are centered on expanding health insurance coverage. During the 2020 presidential campaign, President Biden, then the Democratic candidate, proposed lowering the Medicare eligibility age from 65 years to 60 years,4,5 in part to help workers who lost employment-based health insurance during the pandemic. Some members of Congress have advocated expanding Medicare to cover all US residents.6
Understanding the association of Medicare with access to care and health outcomes nationally and by race and ethnicity informs the ongoing debate over Medicare expansion. Prior studies show the introduction of Medicare was associated with increases in health care utilization,7 and entry into Medicare at age 65 years increases access to care and improves health for those previously without insurance.8,9,10,11,12,13 Earlier research also found reductions in racial and ethnic disparities in access at the national level at age 65 years.14 However, evidence of Medicare’s associations with racial and ethnic disparities in health outcomes, and on how associations with health and access differ across the US, is lacking. Moreover, it remains unclear whether Medicare’s effects on disparities persisted after the US Affordable Care Act (ACA) was implemented in 2014, given that the ACA is associated with reduced racial and ethnic disparities in coverage and access.15,16,17,18 Although Medicare’s association with coverage disparities are partly mechanical owing to the large preexisting racial and ethnic disparities in coverage, its association with access to care and health depend on how coverage translates into outcomes for different populations. Identifying the policies that address racial and ethnic disparities in access to care and health, which reflect the effects of structural racism in the US,19,20,21 is essential as the US reckons with racial injustice.
Using a “natural experiment” created by eligibility for Medicare at age 65 years, we estimated the effect sizes associated with entering Medicare using a regression discontinuity design.22,23 By comparing individuals just before and after age 65, a narrow band of years in which observable and unobservable characteristics of the populations are similar, we estimated effect sizes for the associations between Medicare eligibility with coverage, access to care, and health by race and ethnicity and state.
Methods
Study Design and Population
A regression discontinuity design was used to estimate the association between eligibilty for Medicare at age 65 and access to care. The key assumption was that other determinants of the outcome would be similar just before and after the threshold age of 65 years, with the exception of Medicare eligibility, which we test.22,23,24
We separately analyzed January 2008 to December 2018 data from the US Centers for Disease Control and Prevention’s (CDC) Behavioral Risk Factor Surveillance System (BRFSS) and the Wide-Ranging Online Data for Epidemiologic Research (WONDER) system. Although these data sets could not be linked, both contained demographic data, which allowed us to assess discontinuities at age 65 years by race and ethnicity. The BRFSS is the largest annual health survey across the 50 states, enabling estimates of Medicare’s effects at age 65 years at the national and state levels; between 2008 and 2018, the median response rate was 47.2% (range, 45.2%-54.6%) (eMethods and eFigure 1 in the Supplement). Further details about the BRFSS are available elsewhere.25 The CDC WONDER multiple cause of death data are derived from US death certificates and compiled from 57 vital statistics jurisdictions.26
We limited our primary sample to US citizens ages 51 to 79 years from 2008 through 2018 in the 50 states and Washington DC. We removed observations with missing values for any of the primary variables.27,28,29,30 The data were analyzed from February to May 2021. Yale University’s institutional review board deemed this study exempt from review because of the use of deidentified, publicly available data.
Study Variables
We assessed outcomes in 3 key domains. First, we defined insurance coverage based on whether individuals had health insurance at the time of the interview.
Second, we studied access to care. We examined whether respondents reported having access to a regular source of care (eg, a personal physician). We also assessed whether respondents reported cost-related barriers to seeing a physician during the past year. Additionally, we assessed whether respondents reported receiving an influenza vaccine during the past year. For each access measure, respondents answered based on their experience over the past year, not their situation at the time of the interview. Because our regression discontinuity design observed age in discrete years, we used a “donut” regression discontinuity approach, removing observations at age 65 years for these variables (because answers reflect respondent access at ages 64 and 65 years).31
Third, we examined self-reported health and mortality. We assessed whether respondents reported being in poor health, fair health, or good or better health (ie, good/very good/excellent) in the BRFSS. We assessed all-cause mortality for US citizens ages 51 to 79 years using CDC WONDER data (eMethods in the Supplement).
The racial and ethnic categories used in the BRFSS were: White only, non-Hispanic; Black only, non-Hispanic; American Indian or Alaskan Native only, non-Hispanic; Asian only, non-Hispanic; Native Hawaiian or other Pacific Islander only, non-Hispanic; other race only, non-Hispanic; multiracial, non-Hispanic; and Hispanic. Respondents self-identified their race and ethnicity. Participants who identified as non-Hispanic White adults (defined as White adults herein) were assessed for how health insurance coverage, access to care, and health changed for these respondents compared with those who identified as non-Hispanic, Black (defined as Black adults herein), or Hispanic. Together, White, Black, and Hispanic respondents comprised 92.6% of the population, with 7.4% belonging to other (American Indian or Alaskan Native, Asian, Native Hawaiian or other Pacific Islander, multiracial, or other) racial or ethnic groups that were excluded because of smaller sample sizes. We also included demographic characteristics from the BRFSS, including state, sex, marital status, educational attainment, employment status, and income. Consistent with prior work, we defined disparities as age-adjusted mean differences in the level of outcomes between groups.14
Statistical Analysis
We use a regression discontinuity design to estimate the association of the Medicare eligibility age with access to care outcomes at the age 65 years threshold. We estimated the adjusted discontinuity at age 65 years using a local linear regression with a uniform kernel. Our model allowed for different age trends above and below the discontinuity. The vertical difference between these 2 fitted lines quantified the adjusted discontinuity at age 65 years. We used a data-driven method that automatically selected a bandwidth (ie, the age range around the cutoff that we used to run local linear regression) that balanced bias and variance, and accounted for discreteness in our running variable (age in years).32 To account for additional extrapolation in discrete regression discontinuity, we reported bias-adjusted confidence intervals.32,33
We documented how estimates differed by race and ethnicity with separate analyses for Black, Hispanic, and White populations. We computed differences in adjusted discontinuities between racial and ethnic groups (eg, White vs Black adults) at age 65 years and used the delta method to recover bias-adjusted confidence intervals around that quantity (eMethods in the Supplement).34
In sensitivity analyses, we assessed the robustness of results in 3 ways: first, we reestimated our model using a triangular kernel, which places more weight on observations closer to the cutoff; second, we varied the sensitivity of the approach to the extrapolation because of our discrete variables; and third, we estimated parametric regression discontinuity models with linear or quadratic age trends, with and without adjusting for covariates. For parametric sensitivity tests, we varied the bandwidth around the cutoff. Lastly, we restricted the data to the post-ACA period (2014 and later) given evidence that the implementation of ACA was associated with reduced racial and ethnic disparities.15,16,17,18 In falsification tests, we tested for discontinuities in respondent characteristics at age 65 years, such as income or retiree status (eMethods in the Supplement) and response rates. One concern is that other life changes at age 65 years (in particular, retirement) may affect outcomes (eg, via increased leisure time).35
We also assessed the associations between Medicare eligibility and racial and ethnic disparities at the state level by estimating our model within each state. State-level estimates used smaller sample sizes, but allowed us to examine what share of the national-level reduction in racial and ethnic disparities associated with Medicare was also associated with reductions in disparities within states (how much racial and ethnic minority groups closed the gap with the White population in each state at age 65 years) as opposed to being a result of Medicare having larger effect sizes in states with greater shares of racial and ethnic minority groups (eMethods in the Supplement).36,37,38 State-level estimates also pinpoint where Medicare’s association with coverage, access, and health is geographically concentrated. This is important given evidence from ACA that racial and ethnic disparities may be more persistent in states that did not expand Medicaid.16 To assess where reductions in racial and ethnic disparities were largest, we grouped states into 4 census regions. To address noise in the estimates of state-level disparities, we use shrinkage before plotting state-specific estimates (eMethods in the Supplement).39
Statistical analyses were performed using R statistical software (version 4.0.3; R Foundation), with the primary and secondary analyses using the RDHonest package.32 We used 2-tailed tests of statistical significance, with α set at .05.
Results
Study Population
The study samples included 2 434 320 respondents in the BRFSS and 44 587 state-age-year observations (eg, individuals age 63 years in New York in 2017) of the mortality rate in the CDC WONDER data (eMethods in the Supplement). Demographic and socioeconomic characteristics did not differ markedly between individuals just younger and older than the Medicare eligibility age (Table 1; eFigure 2 in the Supplement).
Table 1. Characteristics of the Study Population.
| Characteristic | Sample means, No. (%)a | Change at age 65 years | ||
|---|---|---|---|---|
| Age, 51-64 y | Age, 65-79 y | Expected mean, %b | Adjusted discontinuity, pp (95% CI)c | |
| Race | ||||
| Black | 115 779 (12) | 76 567 (9) | 10.1 | 0.5 (−0.2 to 1.2) |
| Hispanic | 66 748 (11) | 37 546 (8) | 9.3 | −0.2 (−1.0 to 0.6) |
| White | 1 137 239 (77) | 1 000 441 (83) | 80.6 | −0.3 (−1.3 to 0.7) |
| Women | 820 598 (56) | 721 545 (60) | 57.0 | 0.7 (0.1 to 1.3) |
| Men | 499 168 (44) | 393 009 (40) | 43.0 | −0.7 (−1.3 to −0.1) |
| Married | 804 334 (65) | 602 405 (61) | 65.9 | −0.7 (−1.5 to 0.0) |
| Employed | 813 908 (62) | 210 094 (18) | 35.0 | −2.8 (−4.6 to −1.1) |
| Education | ||||
| Less than high school | 82 165 (11) | 94 521 (14) | 10.9 | 0.3 (−0.2 to 1.0) |
| High school | 369 632 (28) | 351 306 (31) | 27.2 | 0.8 (0.3 to 1.3) |
| Some college | 369 447 (30) | 291 358 (29) | 31.4 | −0.6 (−1.1 to −0.2) |
| College graduate | 495 160 (30) | 374 196 (26) | 29.9 | 0.0 (−0.6 to 0.7) |
| Income, $ | ||||
| <10 000 | 56 826 (5) | 34 326 (3) | 3.2 | 0.3 (−0.1 to 0.8) |
| 10 000-24 999 | 214 648 (16) | 251 030 (22) | 18.4 | 0.0 (−0.4 to 0.5) |
| 25 000-49 999 | 274 724 (20) | 296 758 (26) | 24.6 | −0.8 (−1.6 to 0.1) |
| 50 000-74 999 | 207 894 (15) | 144 777 (13) | 15.4 | −0.0 (−0.4 to 0.3) |
| >75 000 | 412 265 (33) | 190 585 (18) | 23.7 | −0.4 (−1.3 to 0.5) |
Abbreviation: pp, percentage points.
Columns present raw counts of respondents and survey-weighted shares in percentages.
Column presents the expected mean at age 65 years, the age eligibility threshold for Medicare, which is based on the local linear association between age and the outcome. The expected means contain the counterfactual outcome at age 65 years in the absence of the treatment (ie, the expected outcome at age 65 years without Medicare).
Adjusted discontinuity estimates are in percentage points.
Changes in Racial and Ethnic Disparities at the National Level After Age 65 Years
Nationwide, individuals were significantly more likely to have health insurance immediately after age 65 years compared with just before age 65 years (Table 2 and Figure 1). Insurance coverage increased more for Black respondents (from 86.3% to 95.8% or 9.5 percentage points [pp]; 95% CI, 7.6-11.4) and Hispanic respondents (from 77.4% to 91.3% or 13.9 pp; 95% CI, 12.0-15.8) than White respondents (from 92.0% to 98.5% or 6.5 pp; 95% CI, 6.1-7.0). There was a 53% reduction (from 5.7% to 2.7% or 3.0 pp; 95% CI, 0.9-5.1; P = .003), in the disparity between White and Black adults and a 51% reduction (from 14.6% to 7.2% or 7.4 pp; 95% CI, 5.3-9.5; P < .001) in the disparity between White and Hispanic adults.
Table 2. Medicare Eligibility Age-Related Discontinuities in Racial and Ethnic Disparities in Coverage, Access, and Health.
| Characteristic | White individuals | Black individuals | Hispanic individuals | Disparity | ||||||||
|---|---|---|---|---|---|---|---|---|---|---|---|---|
| Expected meana | Adjusted discontinuity (95% CI)b | Expected meana | Adjusted discontinuity (95% CI)b | Expected meana | Adjusted discontinuity (95% CI)b | White and Black individuals | White and Hispanic individuals | |||||
| Expected disparityc | Adjusted discontinuity in disparity (95% CI)b | P valued | Expected disparityc | Adjusted discontinuity in disparity (95% CI)b | P valued | |||||||
| Insurance coverage, % | 92.0 | 6.5 (6.1 to 7.0) | 86.3 | 9.5 (7.6 to 11.4) | 77.4 | 13.9 (12.0 to 15.8) | 5.7 | −3.0 (−5.1 to −0.9) | .003 (.01) | 14.6 | −7.4 (−9.5 to −5.3) | <.001 (<.001) |
| Health care access, % | ||||||||||||
| Have a usual source of care | 92.2 | 1.3 (0.8 to 1.8) | 91.0 | 2.5 (0.8 to 4.3) | 81.7 | 4.4 (1.5 to 7.2) | 1.2 | −1.2 (−3.2 to 0.7) | .24 (.38) | 10.5 | −3.0 (−6.1 to 0.0) | .05 (.09) |
| Unable to see physician in past year because of cost | 8.1 | −3.0 (−3.5 to −2.5) | 13.9 | −4.5 (−6.6 to −2.4) | 19.5 | −7.5 (−9.4 to −5.6) | −5.8 | 1.5 (−0.8 to 3.8) | .22 (.38) | −11.4 | 4.5 (2.4 to 6.7) | <.001 (<.001) |
| Received an influenza vaccination in past year | 53.5 | 2.2 (1.3 to 3.0) | 42.5 | 2.8 (0.8 to 4.9) | 45.4 | 7.0 (3.7 to 10.3) | 11.0 | −0.7 (−3.1 to 1.7) | .60 (.78) | 8.1 | −4.8 (−8.4 to −1.3) | .007 (.01) |
| Health | ||||||||||||
| Self-reported health, % | ||||||||||||
| Poor | 5.8 | −0.2 (−0.7 to 0.3) | 10.3 | −2.6 (−4.0 to −1.2) | 14.8 | −3.8 (−6.1 to −1.4) | −4.4 | 2.4 (0.8 to 4.0) | .002 (.01) | −8.9 | 3.6 (1.1 to 6.1) | .004 (.01) |
| Fair | 13.6 | −0.8 (−1.3 to −0.3) | 25.0 | −0.3 (−2.3 to 1.6) | 31.1 | 0.2 (−2.8 to 3.2) | −11.3 | −0.5 (−2.6 to 1.7) | .69 (.78) | −17.5 | −1.0 (−4.1 to 2.2) | .57 (.65) |
| Good or better | 80.7 | 0.9 (0.2 to 1.7) | 64.7 | 2.8 (0.3 to 5.2) | 53.9 | 3.1 (−0.6 to 6.8) | 15.9 | −1.8 (−4.5 to 0.9) | .20 (.38) | 26.8 | −2.1 (−6.1 to 1.8) | .30 (.40) |
| Mortality rate, per 100 000e | 1261.1 | −11.3 (−43.7 to 21.1) | 1902.6 | −7.0 (−61.8 to 47.9) | 1032.4 | −9.3 (−61.9 to 43.4) | −641.5 | −4.3 (−77.2 to 68.5) | .95 (.95) | 228.7 | −2.0 (−72.6 to 68.5) | .97 (.97) |
Columns present the expected mean at age 65 years, the age eligibility threshold for Medicare, which is based on the local linear association between age and the outcome. The expected means contain the counterfactual outcome at age 65 years in the absence of the treatment (ie, the expected outcome at age 65 years without Medicare).
Adjusted discontinuity estimates are in percentage points.
Column presents the expected disparity at age 65 years, the age eligibility threshold for Medicare, which is based on the local linear association between age and the outcomes for non-White and White populations. The expected disparity subtracts the expected mean for non-White populations from the expected mean for White populations at age 65 years.
Benjamini-Hochberg–corrected P values are presented in parentheses.
Mortality data are from the US Centers for Disease Control and Prevention Wide-Ranging Online Data for Epidemiologic Research system. All other data are from the Behavioral Risk Factor Surveillance System. Because these data are deidentified, they could not be linked.
Figure 1. Medicare Eligibility Age-Related Discontinuities in Coverage, Access, and Health by Race and Ethnicity.
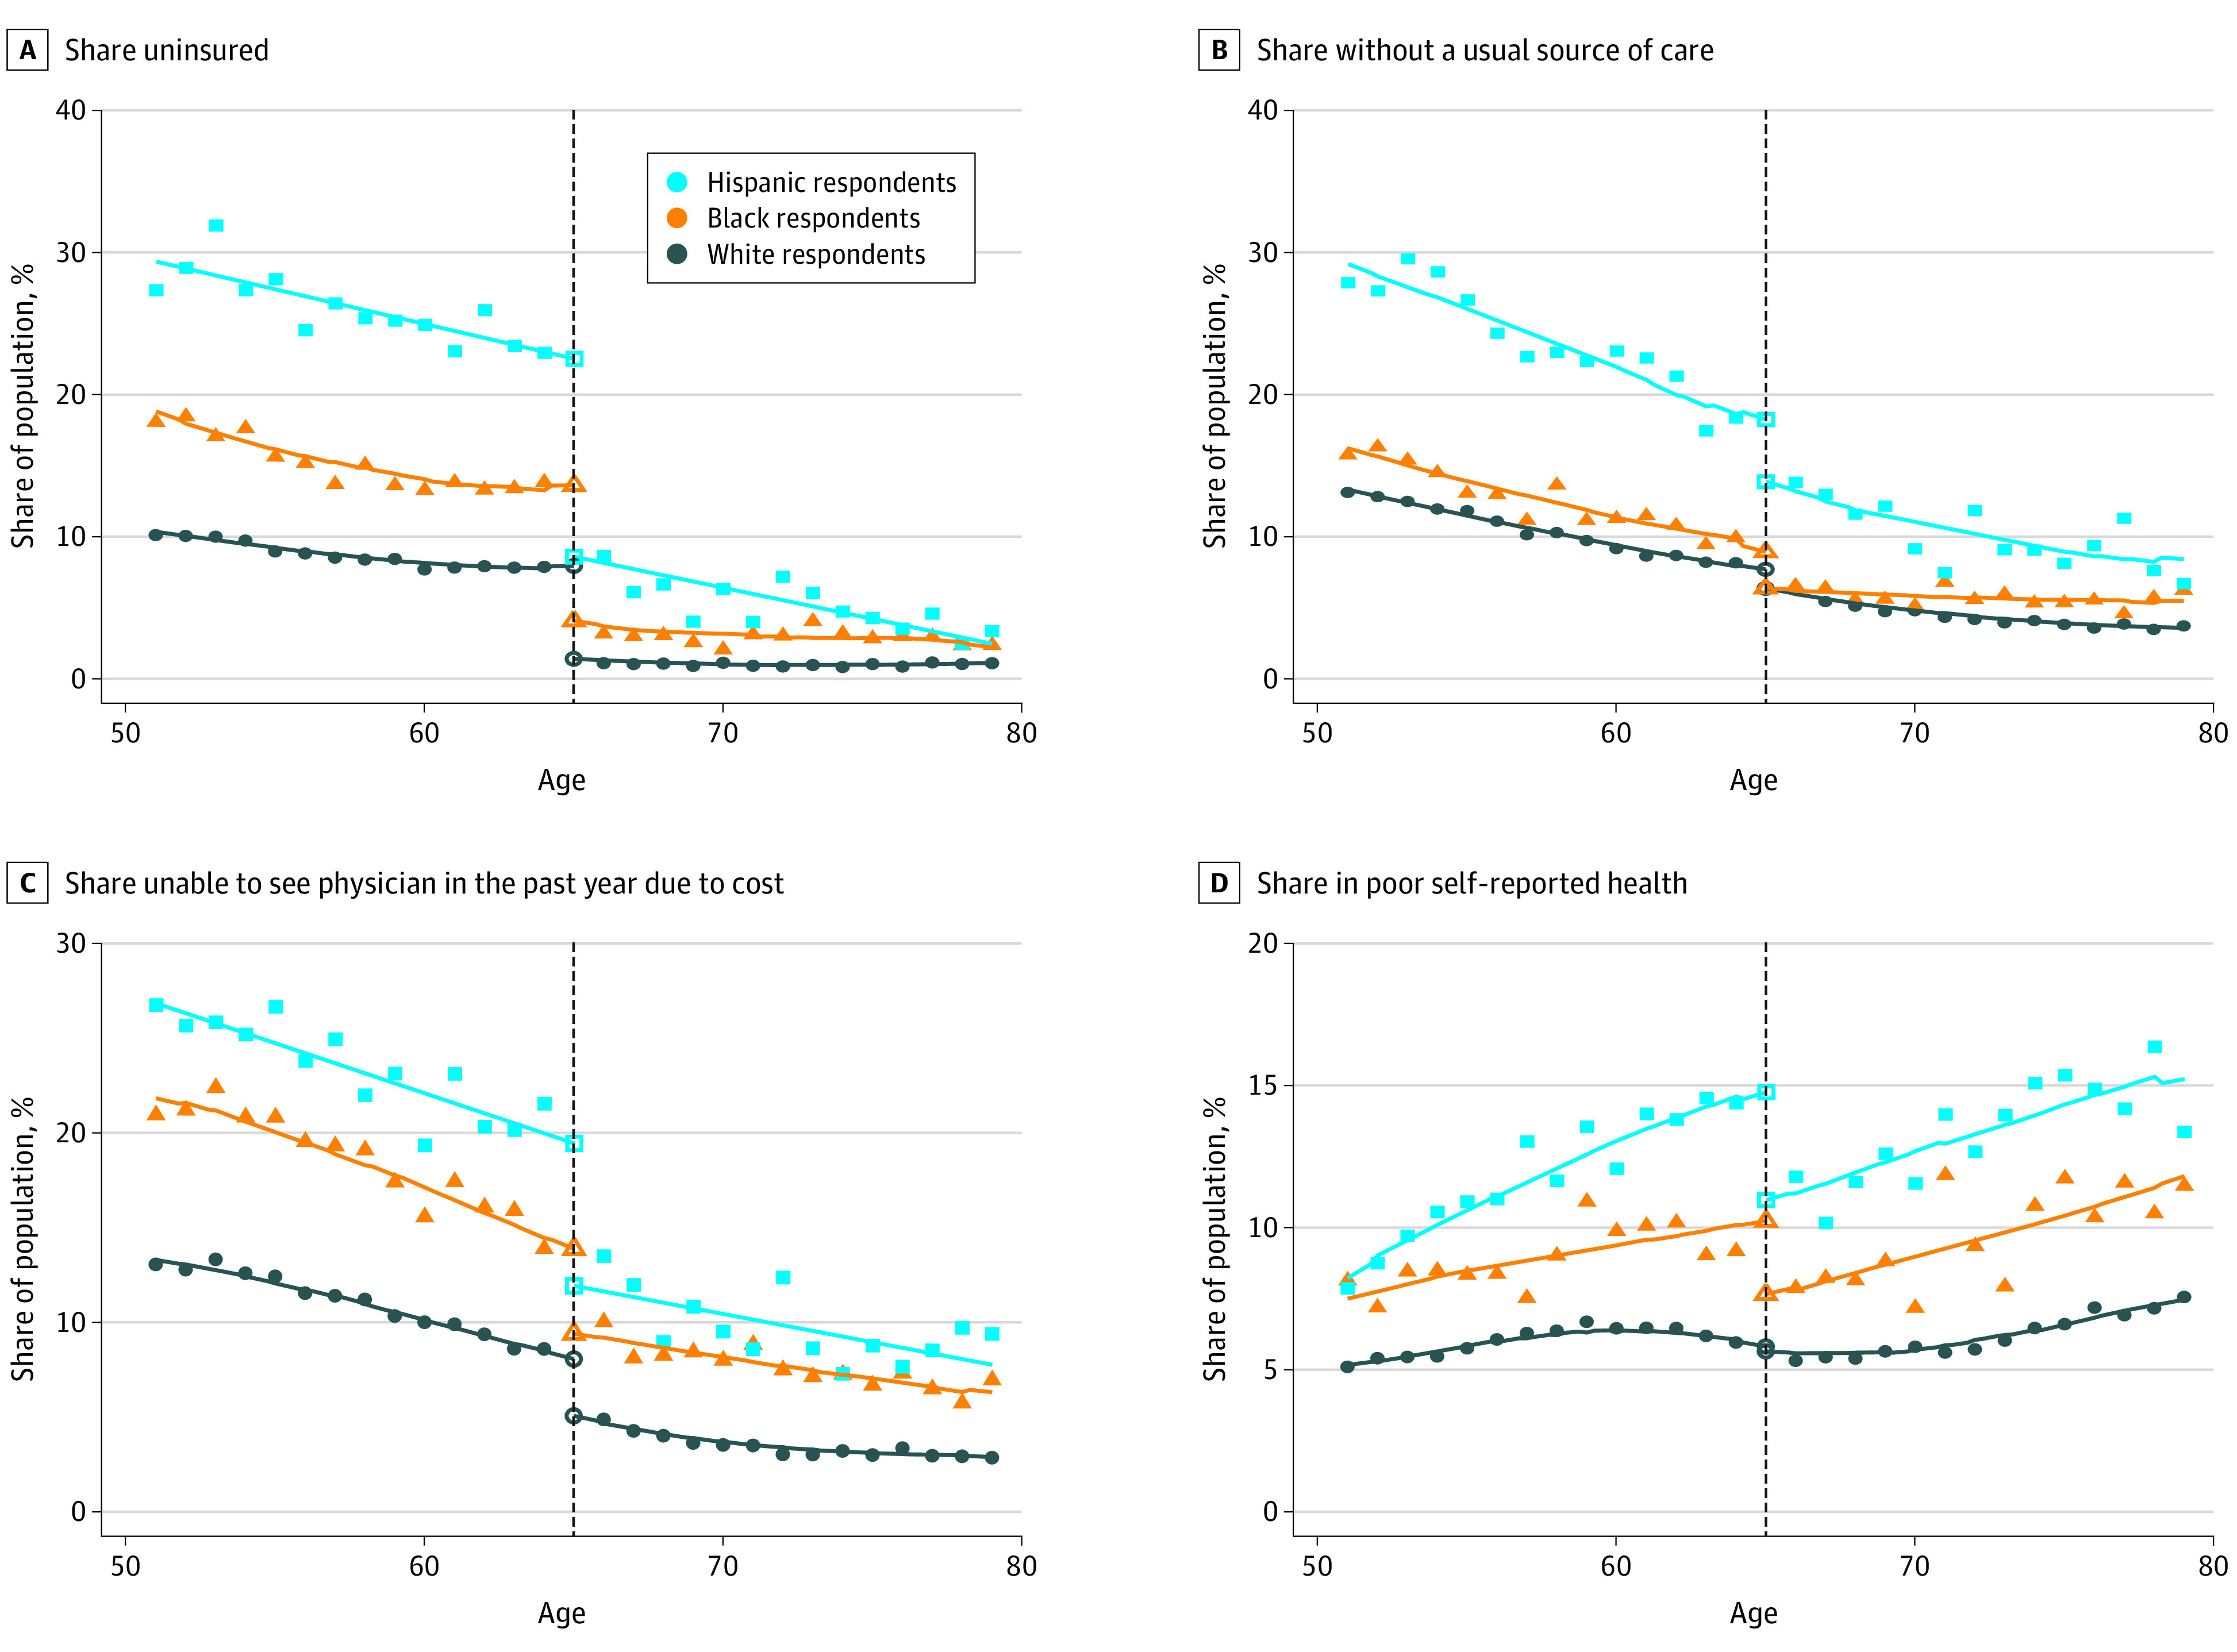
For each panel, the share of the population that reported an outcome is plotted by age in years separately for White, Black, and Hispanic respondents for the study period (2008-2017). For illustrative purposes, the local linear line of best fit based on the optimal bandwidth selected for our regression discontinuity model is plotted for each racial and ethnic group. The White group is comprised of non-Hispanic, White individuals. The black vertical dotted line denotes the Medicare eligibility age threshold at 65 years. Scatter plots for covariates that should not change but exhibit large changes because of entry to Medicare are presented in eFigure 2 in the Supplement.
Access to care improved at age 65 years for all racial and ethnic groups. For each access measure, improvements were larger for Black respondents and Hispanic respondents compared with White respondents. The differential changes in access at age 65 years was associated with a 29% (from 10.5% to 7.5% or 3.0 pp; P = .05) narrower disparity in the share of White and Hispanic people with a usual source of care, a 39% (from 11.4% to 6.9% or 4.5 pp; P < .001) narrower disparity in the share of White and Hispanic people unable to see a physician because of cost, and a 59% (from 8.1% to 3.3% or 4.8 pp; P = .01) narrower disparity in influenza vaccination rates among White and Hispanic people (Table 2 and Figure 1). For disparities between White and Black respondents, changes in access to a usual source of care (from 1.2% to 0%; P = .24), cost-related barriers to care (from 5.8% to 4.3%; P = .22), and influenza vaccinations (from 11.0% to 10.3%; P = .60) were not statistically significant (Table 2 and Figure 1).
For self-reported health, the share of people in poor self-reported health decreased sharply for Black respondents and Hispanic respondents at age 65 years, consistent with prior evidence on the association between health insurance and self-reported health.40 The share of people in poor self-reported health decreased by 3.8 pp (from 14.8% to 11.0%; 95% CI, 1.4-6.1) for Hispanic respondents and 2.6 pp (from 10.3% to 7.7%; 95% CI, 1.2-4.0) for Black respondents, but only 0.2 pp (from 5.8% to 5.6%; 95% CI, −0.7 to 0.3) for White respondents. This narrowed the disparity between White and Black respondents by 2.4 pp (from 4.4% to 2.0%; 95% CI, 0.8-4.0), a 55% reduction (P = .002), and the disparity between White and Hispanic respondents by 3.6 pp (from 8.9% to 5.3%; 95% CI, 1.1-6.1), a 40% reduction (P = .004). We did not detect changes in mortality-related disparities (Table 2).
Within-State Reductions and Changes in Racial and Ethnic Disparities After Age 65 Years
We found that 92% and 98% of the national-level reduction in the disparities between White and Black adults and White and Hispanic adults, respectively, in health insurance coverage was associated with within-state reductions in disparities (eTable 1 in the Supplement). For the access to care and health measures we examined, within-state reductions in disparities accounted for approximately 88% to 100% of the reductions in national-level disparities.
To explore heterogeneity in the association between entry to Medicare and racial and ethnic disparities by geography, we grouped states into 4 census regions (Figure 2). Hispanic respondents had the largest reductions in uninsurance rates in the Midwest (16.7 pp) and South (20.0 pp) regions. However, Black respondents had the largest reductions in uninsurance rates at age 65 years in the Northeast (9.5 pp) and South (9.6 pp) regions. In all 4 regions, White respondents had the smallest reductions in uninsurance rates. In all regions (and nationally), coverage rates for Black and Hispanic respondents lagged behind White respondents before age 65 years. The disparities between White and Hispanic respondents decreased by more than the disparities between White and Black respondents in each of the regions, except the Northeast. In the Northeast, the disparity between White and Black respondents decreased by 5.9 pp (from 9.6% to 3.7%; 95% CI, 1.3-10.5), or 61%. Regional differences in the other outcomes showed similar variation between areas and racial and ethnic groups (eFigure 3 in the Supplement). At the state level, the association between entry to Medicare and reductions in racial and ethnic disparities was largest in states where the disparities for those younger than 65 years were greatest, including Midwestern states such as Minnesota and Wisconsin, but also Northeastern states, such as New Jersey and New York (eFigure 4 and eTables 2 and 3 in the Supplement).
Figure 2. Changes in Racial and Ethnic Disparities in Health Insurance Rates at the Medicare Eligibility Age by Region.
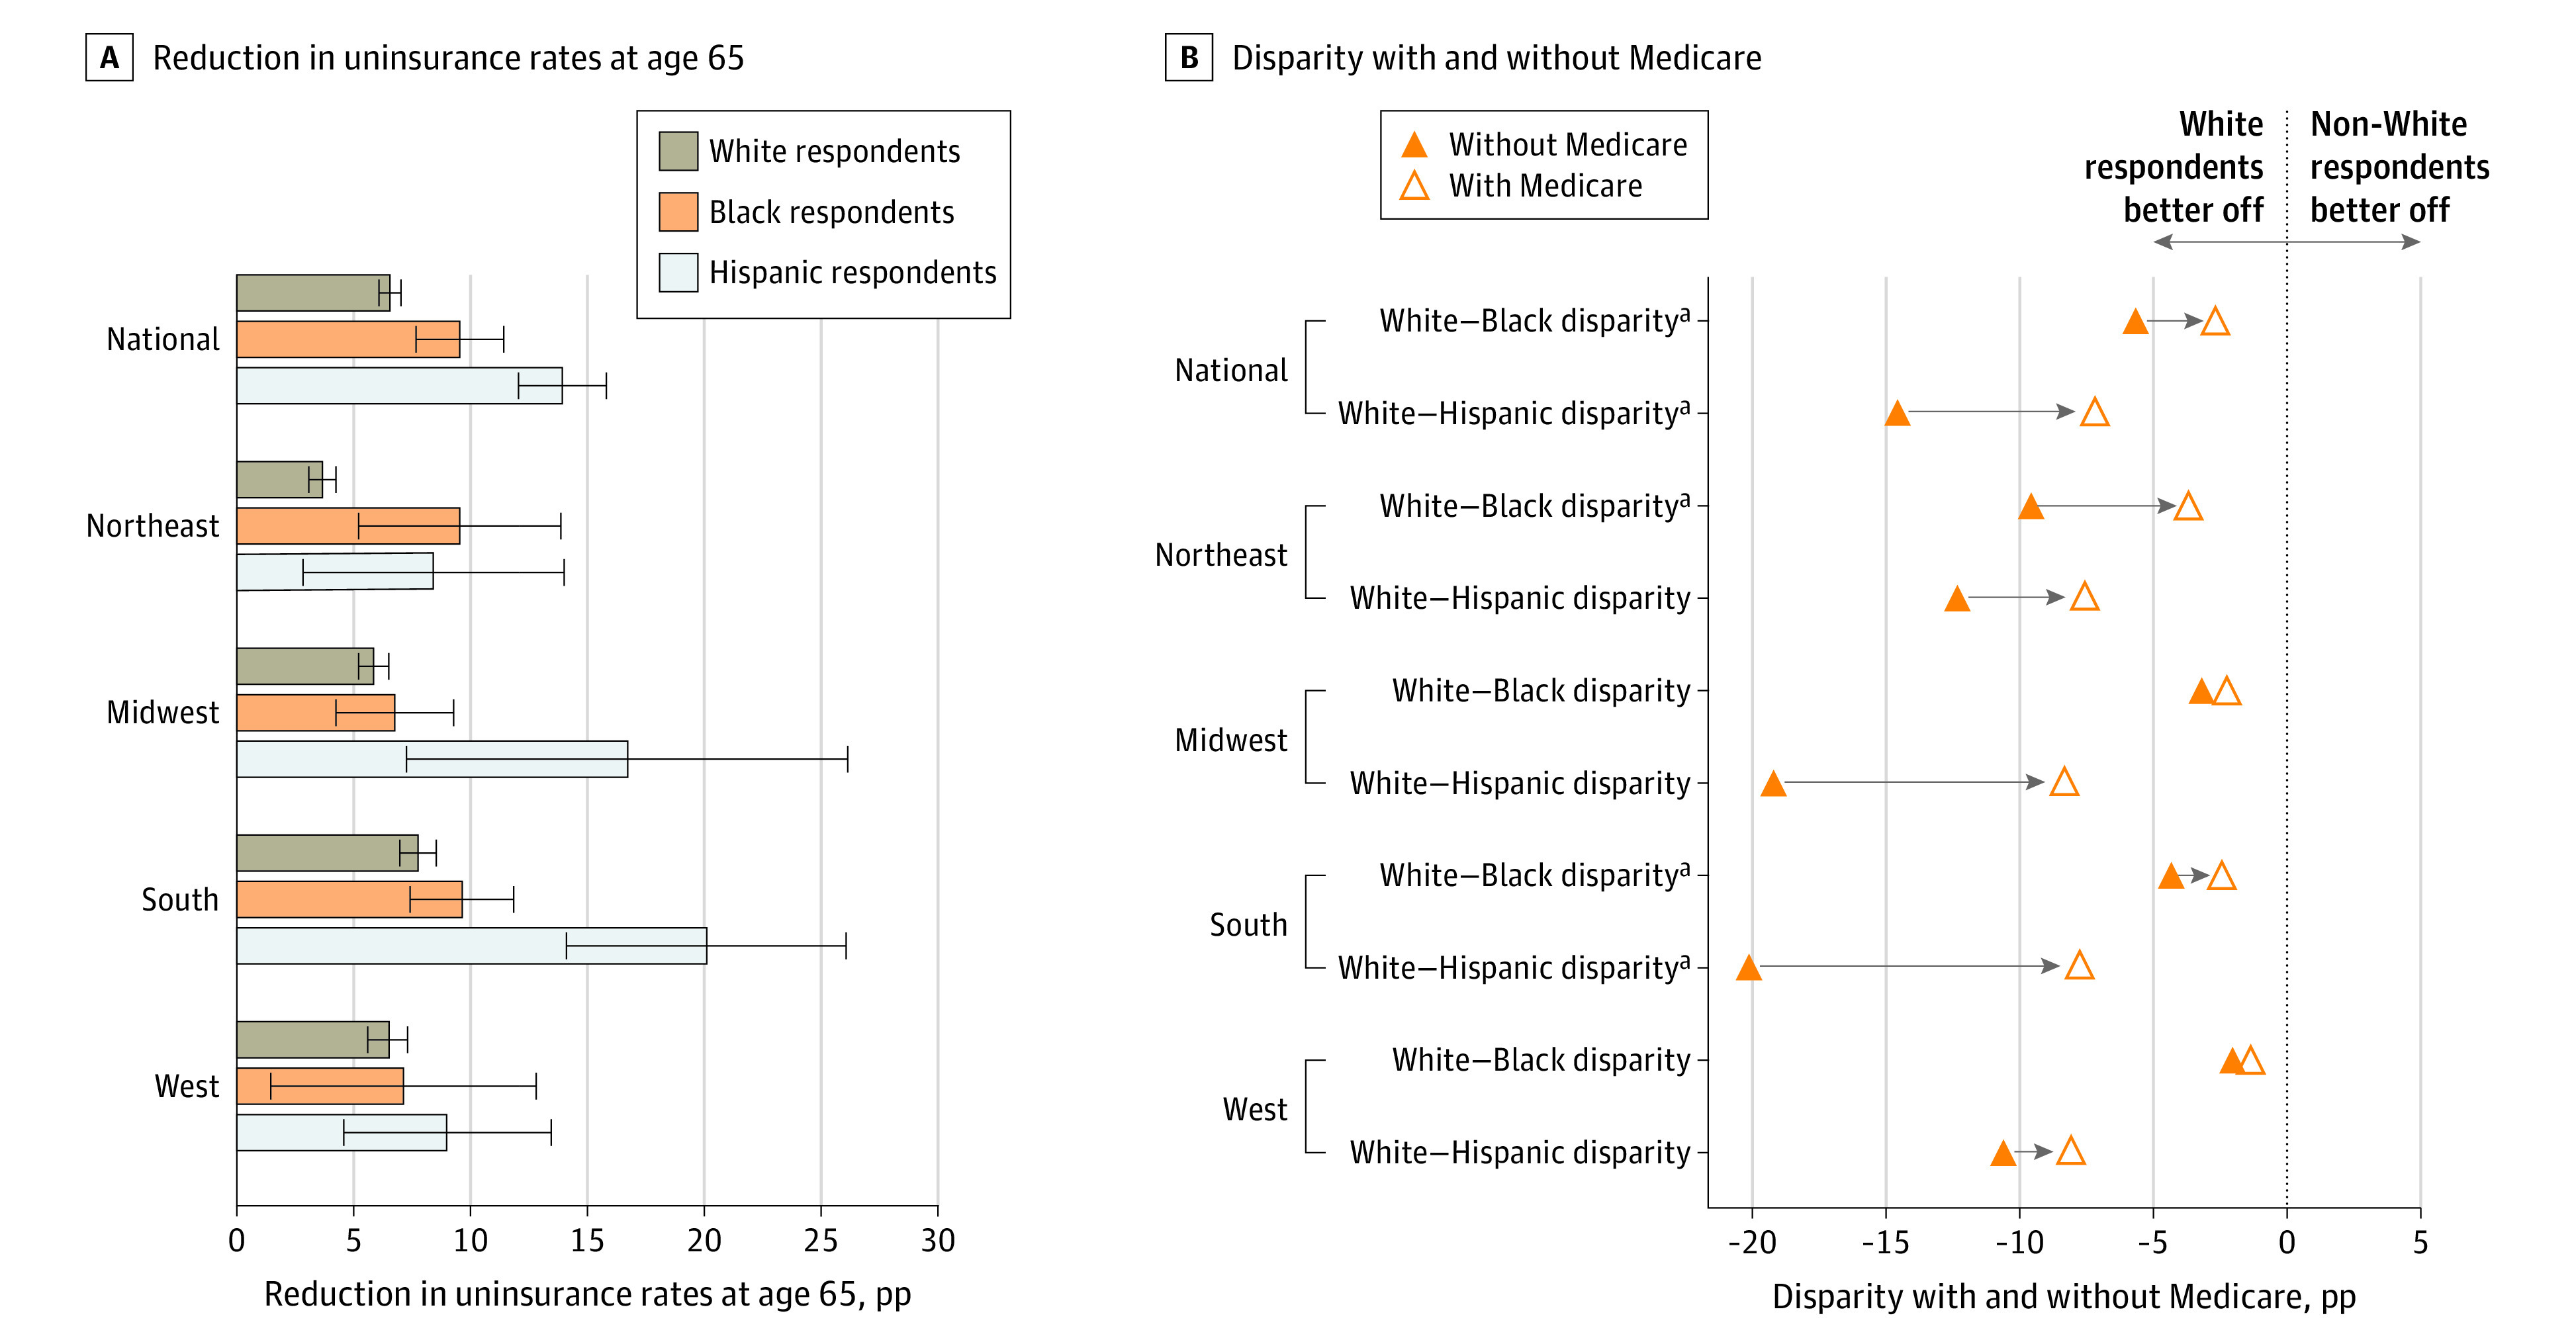
The left panel plots the size (and confidence intervals) of the immediate reduction in uninsurance rates (ie, the adjusted discontinuity) at the national level and separately by census regions for each racial and ethnic group. In the right panel, regression discontinuity estimates the adjusted disparities for individuals age 65 years right before Medicare eligibility (in solid) and right after Medicare eligibility (in hollow). The black vertical dotted line is the 0 disparity line; to the left a comparison of the mean outcome for White respondents and racial and ethnic minority respondents indicates that White respondents were better off.
aAdjusted discontinuity in the disparity (the difference between the 2 points) is statistically significant at the 5% level.
Sensitivity and Supplemental Analyses
Sensitivity analyses, including the use of alternative kernels and bandwidths, parametric regression discontinuity designs, adjustment for additional covariates, and testing for smoothness in response rates at the discontinuity, generally supported our primary conclusions (eTables 4-7 and eFigures 5 and 6 in the Supplement), although estimates of the association between entry to Medicare and disparities in access to a usual source of care were sensitive to alterations in our statistical model. Our findings were qualitatively similar in the pre- and post-ACA periods (Figure 3). However, disparities were lower among those younger than 65 years in the post-ACA period. The disparity between White and Black respondents in cost-related barriers among those younger than 65 years was so substantially reduced post-ACA that Medicare eligibility was not associated with a further closure of the gap.
Figure 3. Changes in Racial and Ethnic Disparities in Coverage, Access, and Health Around the Medicare Eligibility Age Pre-ACA vs Post-ACA.
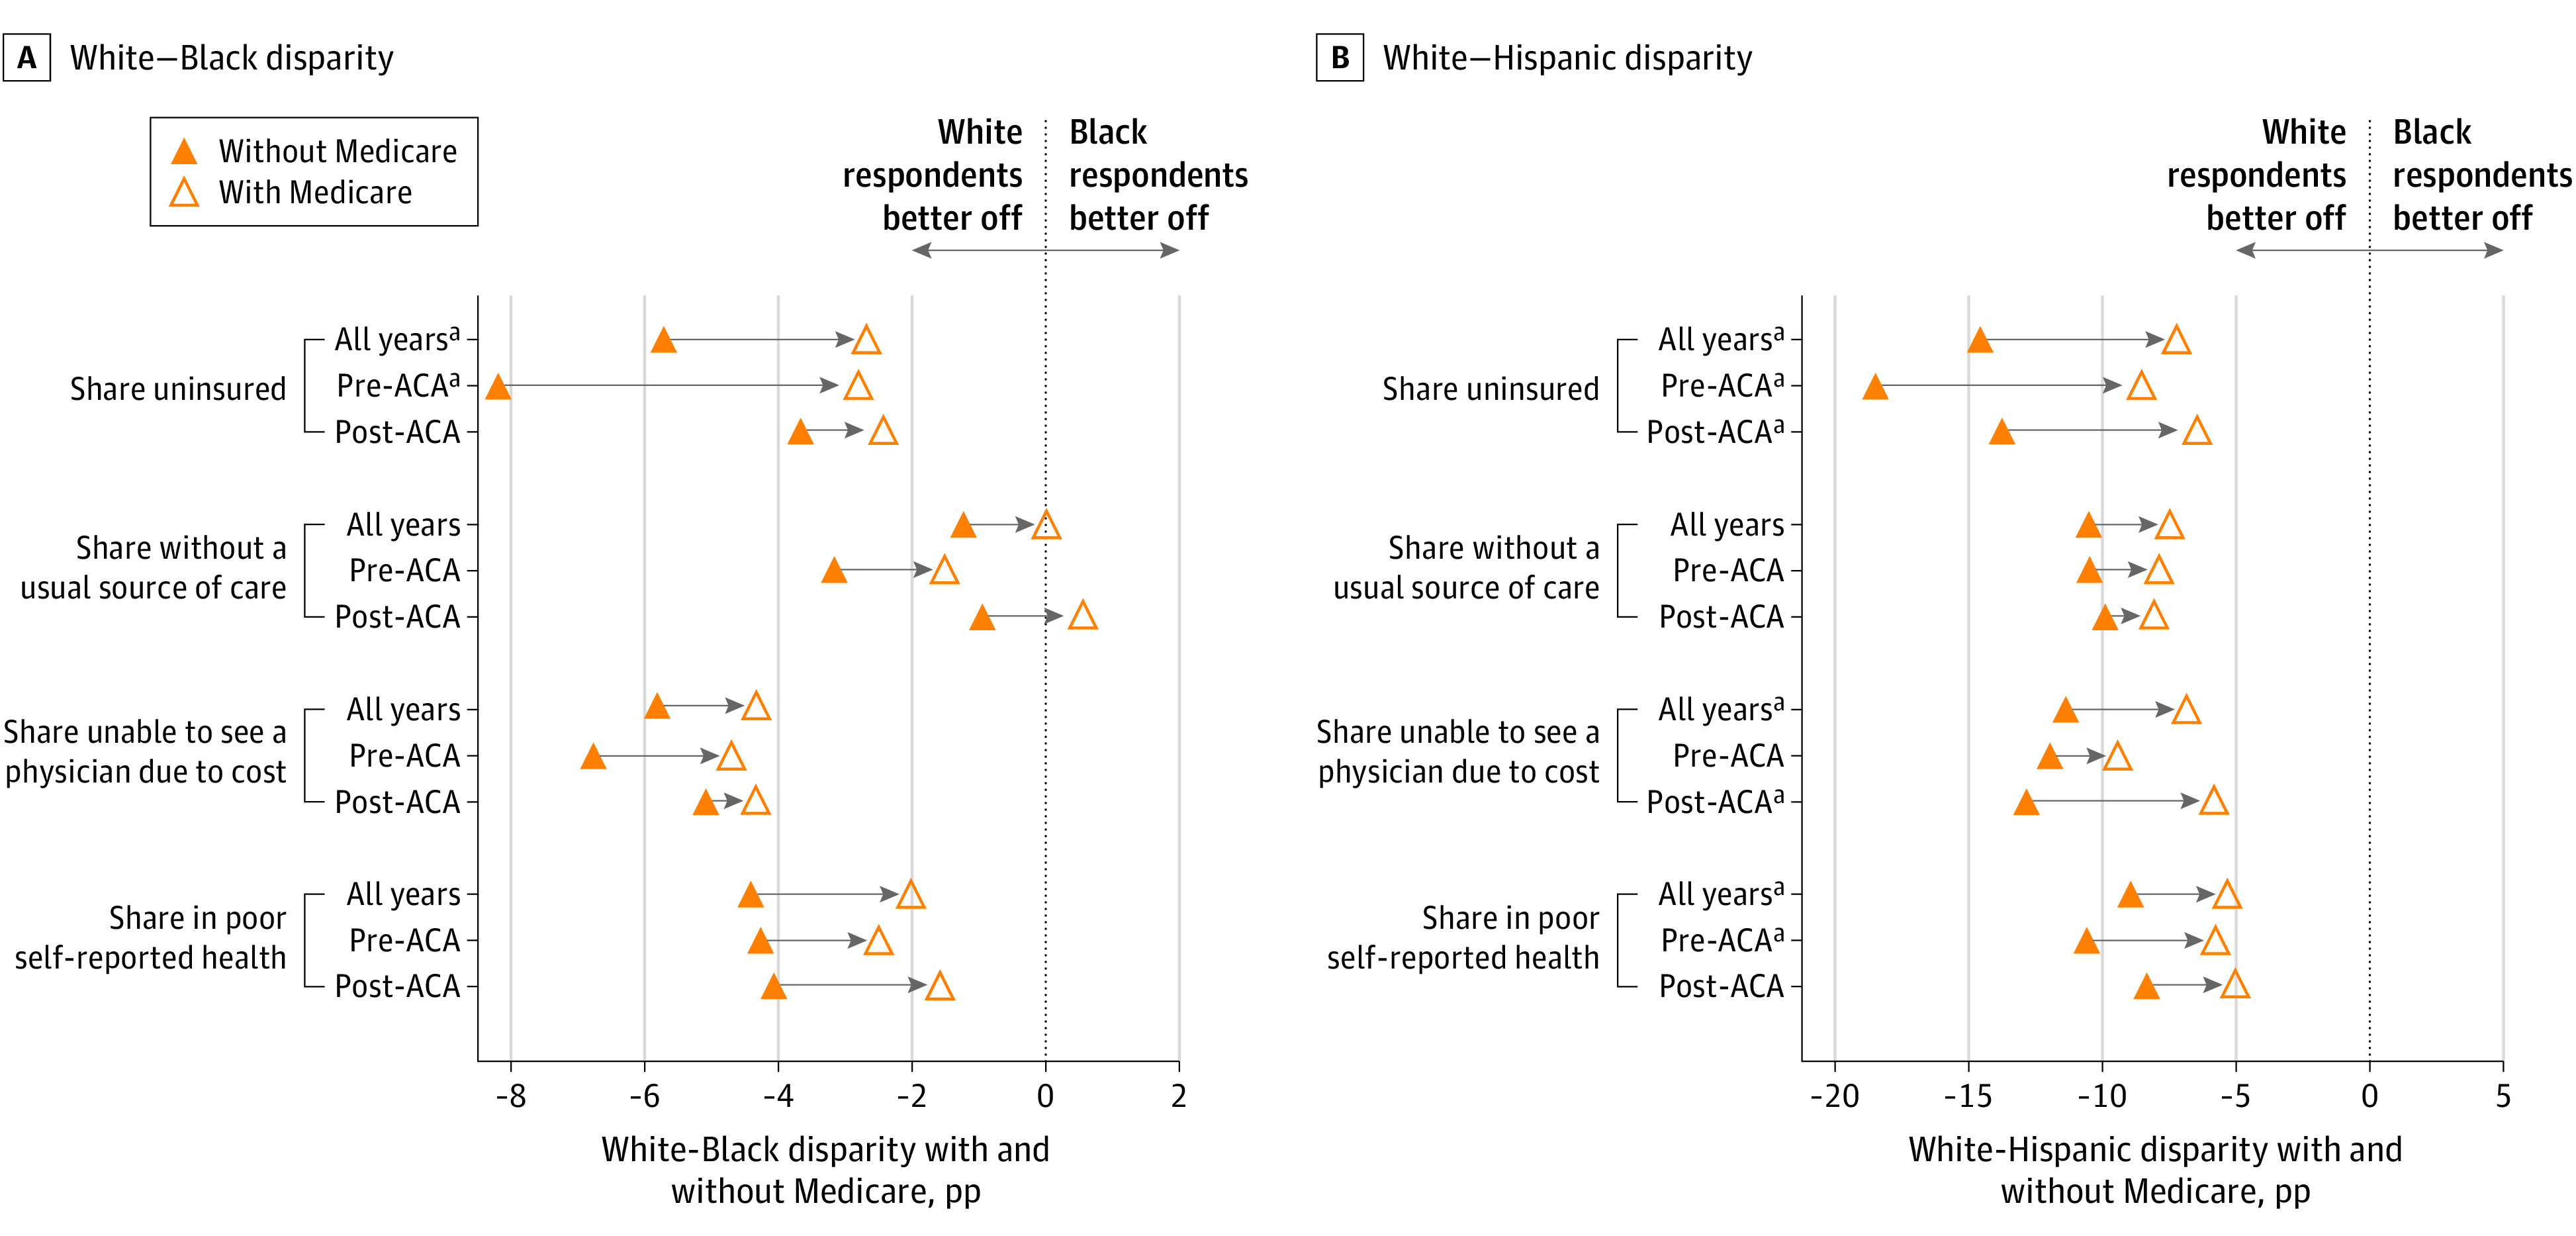
For each outcome, regression discontinuity estimates the adjusted disparities for individuals age 65 years right before Medicare eligibility (in solid triangles) and right after Medicare eligibility (in open triangles) before and after the implementation of the US Affordable Care Act (ACA). The black vertical dotted line is the 0 disparity line; to the left a comparison of the mean outcome for White respondents and racial and ethnic minority groups indicates that White respondents are better off. Panel A shows how the disparity between White and Black respondents changes at age 65 years; panel B shows how the disparity between White and Hispanic respondents changed at age 65 years; and pp indicates percentage points.
aAdjusted discontinuity in the disparity (the difference between the 2 points) is statistically significant at the 5% level.
Discussion
By comparing individuals before and after age 65 years, we found that eligibility for Medicare coverage was associated with reductions in racial and ethnic disparities in insurance coverage, access to care, and self-reported health. Reductions in disparities were associated with racial/ethnic minority groups closing gaps with the White population within states rather than larger effect sizes observed with Medicare in states with greater shares of Black or Hispanic populations. States with the largest preexisting disparities in insurance coverage before age 65 years had the greatest reductions in disparities associated with Medicare eligibility. Notably, states with high levels of disparities between White and Black respondents were economically, politically, and geographically diverse, whereas states with high levels of disparities between White and Hispanic respondents tended to be concentrated in the South. The results highlight an underappreciated aspect of Medicare: it is associated with sharp reductions in racial and ethnic disparities at age 65 years. However, racial and ethnic disparities were not eliminated by Medicare, supporting the view that disparities are shaped not only by policy decisions but also other social determinants of health, such as structural racism, that persist among elderly individuals.19,21
Although ACA reduced racial and ethnic disparities,15,16,17,18 we found associations between Medicare eligibility and racial and ethnic disparities in the post-ACA period. The disparities among those younger than 65 years were generally reduced in the post-ACA period, with the exception of disparities in self-reported health. The persistence of self-reported health disparities may reflect secular trends that complicate pre- and post-ACA comparisons or suggest that immediate improvements in self-reported health at age 65 years reflect short-run gains that are associated with changes in perception because of individuals being newly insured. However, the disparity between White and Black adults in cost-related barriers to care was substantially reduced post ACA, and Medicare eligibility was not associated with a further closure of the gap.
Entry to Medicare was associated with the largest population-level changes in coverage, access, and health in regions where uninsurance rates were highest (ie, the South).41 However, Medicare was associated with geographically widespread reductions in racial/ethnic disparities. For example, entry to Medicare was associated with large reductions in the disparity between White and Black adults in coverage in Midwestern states, such as Minnesota and Wisconsin, but also Northeastern states, such as New Jersey and New York. Our findings reveal that disparities in access and health among those younger than 65 years were not confined to the South, or to states that did not expand Medicaid, but remain widespread, with Medicare eligibility reducing disparities at age 65 years in most regions of the country. These results highlight the importance of understanding how the effects of public insurance programs differ by locality and race and ethnicity when assessing their potential to advance health equity.42 Our findings also suggest that expanding Medicare may be a viable means to reduce racial and ethnic disparities and advance health equity by closing coverage gaps across the US.
Limitations
Our study had several limitations. First, regression discontinuity estimates assess the short-run (ie, immediate) outcomes associated with Medicare eligibility. As such, the study may have underestimated the associations between Medicare and outcomes that respond with a lag (eg, mortality declines associated with the improved management of chronic illnesses). Although we did not find evidence that entry to Medicare was associated with reduced racial and ethnic disparities in mortality, a growing body of evidence finds that health insurance reduces mortality,43,44,45 suggesting that further work is needed in this area. Second, other life changes that occur around age 65 years may have confounded our results. We present evidence that changes in covariates at age 65 years are generally small and less robust to sensitivity analyses than our primary results; nevertheless, there may be other contributors (eg, retirement) to the changes in racial and ethnic disparities at age 65 years. Third, we examined a limited set of access to care and health measures, and associations with racial and ethnic disparities may differ for other measures. Additionally, our usual source of care measure may underestimate access if respondents with multiple clinicians did not consider themselves as having a usual source of care. Fourth, nonresponse bias in the BRFSS may differ around the discontinuity, biasing our results. However, response rates trend smoothly at age 65 years, and studies suggest prevalence rates in the BRFSS are comparable with those in other major surveys46; nevertheless, low response rates remain a limitation. Fifth, because of changing demographic patterns in the US, state-level effects may not generalize to future periods.
Conclusions
In this study, eligibility for Medicare at age 65 years was associated with reductions in racial and ethnic disparities in coverage, access, and health, but not mortality. Reductions in disparities were associated with racial and ethnic minority groups closing gaps with the White population within states, rather than Medicare having larger associations in states with greater racial and ethnic minority populations or in states that did not expand Medicaid under ACA. Eligibility for Medicare was associated with reductions in racial and ethnic disparities in economically, politically, and geographically diverse states.
eMethods. Supplemental Description of Methods
eTable 1. Share of the Reduction in Discontinuities in Racial/Ethnic Disparities After 65 Due to Within-State Reductions in Disparity
eTable 2. Medicare Eligibility Age-Related Discontinuities in White-Black Disparities in Coverage, Access, and Health by State
eTable 3. Medicare Eligibility Age-Related Discontinuities in White-Hispanic Disparities in Coverage, Access, and Health by State
eTable 4. Robustness of Primary Regression Discontinuity Estimates to Alterations in the Statistical Model
eTable 5. Robustness of Regression Discontinuity Estimates to Using Parametric Model with Linear Age Trend and 10 Year Bandwidth
eTable 6. Robustness of Primary BRFSS Results to Additionally Adjusting for Individual-Level Covariates in Parametric Model with Linear Age Trend and 10 Year Bandwidth
eTable 7. Response Rates at the Discontinuity and Adjusted Discontinuities in Response Rates, by Outcome
eFigure 1. Behavioral Risk Factor Surveillance System (BRFSS) Response Rates by Year
eFigure 2. National Level Covariate Smoothness Figures, Select Outcomes
eFigure 3. Changes in Racial/Ethnic Disparities, by Region
eFigure 4. Changes in Racial/Ethnic Disparities in Health Insurance Around the Medicare Eligibility Age vs. Existing Health Insurance Disparities, by State
eFigure 5. Sensitivity of Estimates of Adjusted Discontinuity in Disparity in Coverage and Access to Alterations in Bandwidth and Statistical Model, Black-White Disparity
eFigure 6. Sensitivity of Estimates of Adjusted Discontinuity in Disparity in Cost-Related Barriers to Access and Vaccination Rates to Alterations in Bandwidth and Statistical Model, Black-White Disparity
References
- 1.Yancy CW. COVID-19 and African Americans. JAMA. 2020;323(19):1891-1892. doi: 10.1001/jama.2020.6548 [DOI] [PubMed] [Google Scholar]
- 2.National Center for Health Statistics . Health disparities: race and Hispanic origin. Accessed February 15, 2021. https://www.cdc.gov/nchs/nvss/vsrr/covid19/health_disparities.htm
- 3.APM Research Labs . The color of coronavirus: COVID-19 deaths by race and Ethnicity in the U.S. Accessed February 15, 2021. https://www.apmresearchlab.org/covid/deaths-by-race
- 4.Song Z. Potential implications of lowering the Medicare Eligibility Age to 60. JAMA. 2020;323(24):2472-2473. doi: 10.1001/jama.2020.7245 [DOI] [PubMed] [Google Scholar]
- 5.Biden J. Joe Biden outlines new steps to ease economic burden on working people. Accessed June 29, 2020. https://medium.com/@JoeBiden/joe-biden-outlines-new-steps-to-ease-economic-burden-on-working-people-e3e121037322
- 6.Levitt L. Medicare for all or Medicare for more? JAMA. 2019;322(1):16-17. doi: 10.1001/jama.2019.8268 [DOI] [PubMed] [Google Scholar]
- 7.Finkelstein A.The aggregate effects of health insurance: evidence from the introduction of Medicare. Q J Econ. 2007;122(1):1-37. doi: 10.1162/qjec.122.1.1 [DOI] [Google Scholar]
- 8.Card D, Dobkin C, Maestas N. Does Medicare save lives? Q J Econ. 2009;124(2):597-636. doi: 10.1162/qjec.2009.124.2.597 [DOI] [PMC free article] [PubMed] [Google Scholar]
- 9.McWilliams JM, Meara E, Zaslavsky AM, Ayanian JZ. Health of previously uninsured adults after acquiring Medicare coverage. JAMA. 2007;298(24):2886-2894. doi: 10.1001/jama.298.24.2886 [DOI] [PubMed] [Google Scholar]
- 10.McWilliams JM, Meara E, Zaslavsky AM, Ayanian JZ. Medicare spending for previously uninsured adults. Ann Intern Med. 2009;151(11):757-766. doi: 10.7326/0000605-200912010-00149 [DOI] [PubMed] [Google Scholar]
- 11.McWilliams JM, Meara E, Zaslavsky AM, Ayanian JZ. Use of health services by previously uninsured Medicare beneficiaries. N Engl J Med. 2007;357(2):143-153. doi: 10.1056/NEJMsa067712 [DOI] [PubMed] [Google Scholar]
- 12.McWilliams JM, Zaslavsky AMA, Meara E, Ayanian JZ. Impact of Medicare coverage on basic clinical services for previously uninsured adults. JAMA. 2003;290(6):757-764. doi: 10.1001/jama.290.6.757 [DOI] [PubMed] [Google Scholar]
- 13.Jacobs PD. The impact of Medicare on access to and affordability of health care. Health Aff (Millwood). 2021;40(2):266-273. doi: 10.1377/hlthaff.2020.00940 [DOI] [PubMed] [Google Scholar]
- 14.Card D, Dobkin C, Maestas N. The impact of nearly universal insurance coverage on health care utilization: evidence from Medicare. Am Econ Rev. 2008;98(5):2242-2258. doi: 10.1257/aer.98.5.2242 [DOI] [PMC free article] [PubMed] [Google Scholar]
- 15.Buchmueller TC, Levinson ZM, Levy HG, Wolfe BL. Effect of the Affordable Care Act on racial and ethnic disparities in health insurance coverage. Am J Public Health. 2016;106(8):1416-1421. doi: 10.2105/AJPH.2016.303155 [DOI] [PMC free article] [PubMed] [Google Scholar]
- 16.Chaudry A, Jackson A, Glied SA. Did the Affordable Care Act reduce racial and ethnic disparities in health insurance coverage? Accessed February 15, 2021. https://www.commonwealthfund.org/publications/issue-briefs/2019/aug/did-ACA-reduce-racial-ethnic-disparities-coverage
- 17.Buchmueller TC, Levy HG. The ACA’s impact on racial and ethnic disparities in health insurance coverage and access to care: an examination of how the insurance coverage expansions of the Affordable Care Act have affected disparities related to race and ethnicity. Health Aff. 2020;39(3):395-402. doi: 10.1377/hlthaff.2019.01394 [DOI] [PubMed] [Google Scholar]
- 18.McMorrow S, Long SK, Kenney GM, Anderson N. Uninsurance disparities have narrowed for black and Hispanic adults under the Affordable Care Act. Health Aff (Millwood). 2015;34(10):1774-1778. doi: 10.1377/hlthaff.2015.0757 [DOI] [PubMed] [Google Scholar]
- 19.Bailey ZD, Krieger N, Agénor M, Graves J, Linos N, Bassett MT. Structural racism and health inequities in the USA: evidence and interventions. Lancet. 2017;389(10077):1453-1463. doi: 10.1016/S0140-6736(17)30569-X [DOI] [PubMed] [Google Scholar]
- 20.Evans MK, Rosenbaum L, Malina D, Morrissey S, Rubin EJ. Diagnosing and treating systemic racism. NEJM. 2020;383:274-276. [DOI] [PMC free article] [PubMed] [Google Scholar]
- 21.Gee GC, Ford CL. Structural racism and health inequities: old issues, new directions. Du Bois Rev Soc Sci Res Race. 2011;8(1):115. [DOI] [PMC free article] [PubMed] [Google Scholar]
- 22.Venkataramani AS, Bor J, Jena AB. Regression discontinuity designs in healthcare research. BMJ. 2016;352:i1216. doi: 10.1136/bmj.i1216 [DOI] [PMC free article] [PubMed] [Google Scholar]
- 23.Desai S, McWilliams JM. Consequences of the 340B drug pricing program. N Engl J Med. 2018;378(6):539-548. doi: 10.1056/NEJMsa1706475 [DOI] [PMC free article] [PubMed] [Google Scholar]
- 24.Lee DS, Lemieux T. Regression discontinuity designs in economics. J Econ Lit. 2010;48(2):281-355. doi: 10.1257/jel.48.2.281 [DOI] [Google Scholar]
- 25.US Centers for Disease Control and Prevention . Behavioral risk factor surveillance system: survey data and documentation. Accessed February 15, 2021. https://www.cdc.gov/brfss/data_documentation/index.htm.
- 26.US Centers for Disease Control and Prevention . Wide-ranging online data for epidemiologic research: about multiple cause of death, 1999-2018. Accessed March 21, 2020. https://wonder.cdc.gov/mcd-icd10.html.
- 27.Simon K, Soni A, Cawley J. The impact of health insurance on preventive care and health behaviors: evidence from the first two years of the ACA Medicaid expansions. J Policy Anal Manage. 2017;36(2):390-417. doi: 10.1002/pam.21972 [DOI] [PubMed] [Google Scholar]
- 28.Barbaresco S, Courtemanche CJ, Qi Y. Impacts of the Affordable Care Act dependent coverage provision on health-related outcomes of young adults. J Health Econ. 2015;40:54-68. doi: 10.1016/j.jhealeco.2014.12.004 [DOI] [PubMed] [Google Scholar]
- 29.Courtemanche C, Marton J, Ukert B, Yelowitz A, Zapata D. The impact of the Affordable Car Act on health care access and self-assessed health in the Trump Era (2017-2018). Health Serv Res. 2020;55(suppl 2):841-850. [DOI] [PMC free article] [PubMed] [Google Scholar]
- 30.Cawley J, Soni A, Simon K. Third year of survey data shows continuing benefits of Medicaid expansions for low-income childless adults in the US. J Gen Intern Med. 2018;33(9):1495-1497. doi: 10.1007/s11606-018-4537-0 [DOI] [PMC free article] [PubMed] [Google Scholar]
- 31.Barreca AI, Guldi M, Lindo JM, Waddell GR. Saving babies? revisiting the effect of very low birth weight classification. Q J Econ. 2011;126(4):2117-1223. doi: 10.1093/qje/qjr042 [DOI] [PubMed] [Google Scholar]
- 32.Kolesár M, Rothe C. Inference in regression discontinuity designs with a discrete running variable. Am Econ Rev. 2018;108(8):2277-2304. doi: 10.1257/aer.20160945 [DOI] [Google Scholar]
- 33.Armstrong TB, Kolesár M. Optimal inference in a class of regression models. Econometrica. 2018;86(2):655-683. doi: 10.3982/ECTA14434 [DOI] [Google Scholar]
- 34.Hochberg Y.A sharper Bonferroni procedure for multiple tests of significance. Biometrika. 1988;75(4):800-802. doi: 10.1093/biomet/75.4.800 [DOI] [Google Scholar]
- 35.Coe NB, Zamarro G. Retirement effects on health in Europe. J Health Econ. 2011;30(1):77-86. doi: 10.1016/j.jhealeco.2010.11.002 [DOI] [PMC free article] [PubMed] [Google Scholar]
- 36.Oaxaca R. Male-Female Wage Differentials in Urban Labor Markets. Int Econ Rev; 1973. [Google Scholar]
- 37.Blinder AS. Wage discrimination: reduced form and structural estimates. J Hum Resour. 1973:436-455. doi: 10.2307/144855 [DOI] [Google Scholar]
- 38.Kitagawa EM. Components of a difference between two rates. J Am Stat Assoc. 1955;50(272):1168-1194. doi: 10.2307/2281213 [DOI] [Google Scholar]
- 39.Schwartz AL, Friedman AB. Geographic variations in controlled trials. N Engl J Med. 2017;376(12):1196. doi: 10.1056/NEJMc1700529 [DOI] [PubMed] [Google Scholar]
- 40.Finkelstein A, Taubman S, Wright B, et al. ; Oregon Health Study Group . The Oregon health insurance experiment: evidence from the first year. Q J Econ. 2012;127(3):1057-1106. doi: 10.1093/qje/qjs020 [DOI] [PMC free article] [PubMed] [Google Scholar]
- 41.Goldsmith-Pinkham P, Pinkovskiy M, Wallace J. Medicare and the geography of financial health. Accessed February 15, 2021. https://www.newyorkfed.org/medialibrary/media/research/staff_reports/sr911.pdf
- 42.Garthwaite C, Graves JA, Gross T, Karaca Z, Marone VR, Notowidigdo MJ. All Medicaid Expansions Are Not Created Equal: The Geography and Targeting of the Affordable Care Act. National Bureau of Economic Research; 2019. [Google Scholar]
- 43.Sommers BD, Long SK, Baicker K. Changes in mortality after Massachusetts health care reform: a quasi-experimental study. Ann Intern Med. 2014;160(9):585-593. doi: 10.7326/M13-2275 [DOI] [PubMed] [Google Scholar]
- 44.Miller S, Johnson N, Wherry LR. Medicaid and Mortality: New Evidence from Linked Survey and Administrative Data. National Bureau of Economic Research; 2019. doi: 10.3386/w26081 [DOI] [Google Scholar]
- 45.Goldin J, Lurie IZ, McCubbin J. Health insurance and mortality: Experimental evidence from taxpayer outreach. Q J Econ. 2021;136(1):1-49. doi: 10.1093/qje/qjaa029 [DOI] [Google Scholar]
- 46.Pierannunzi C, Hu SS, Balluz L. A systematic review of publications assessing reliability and validity of the Behavioral Risk Factor Surveillance System (BRFSS), 2004-2011. BMC Med Res Methodol. 2013;13(1):49. doi: 10.1186/1471-2288-13-49 [DOI] [PMC free article] [PubMed] [Google Scholar]
Associated Data
This section collects any data citations, data availability statements, or supplementary materials included in this article.
Supplementary Materials
eMethods. Supplemental Description of Methods
eTable 1. Share of the Reduction in Discontinuities in Racial/Ethnic Disparities After 65 Due to Within-State Reductions in Disparity
eTable 2. Medicare Eligibility Age-Related Discontinuities in White-Black Disparities in Coverage, Access, and Health by State
eTable 3. Medicare Eligibility Age-Related Discontinuities in White-Hispanic Disparities in Coverage, Access, and Health by State
eTable 4. Robustness of Primary Regression Discontinuity Estimates to Alterations in the Statistical Model
eTable 5. Robustness of Regression Discontinuity Estimates to Using Parametric Model with Linear Age Trend and 10 Year Bandwidth
eTable 6. Robustness of Primary BRFSS Results to Additionally Adjusting for Individual-Level Covariates in Parametric Model with Linear Age Trend and 10 Year Bandwidth
eTable 7. Response Rates at the Discontinuity and Adjusted Discontinuities in Response Rates, by Outcome
eFigure 1. Behavioral Risk Factor Surveillance System (BRFSS) Response Rates by Year
eFigure 2. National Level Covariate Smoothness Figures, Select Outcomes
eFigure 3. Changes in Racial/Ethnic Disparities, by Region
eFigure 4. Changes in Racial/Ethnic Disparities in Health Insurance Around the Medicare Eligibility Age vs. Existing Health Insurance Disparities, by State
eFigure 5. Sensitivity of Estimates of Adjusted Discontinuity in Disparity in Coverage and Access to Alterations in Bandwidth and Statistical Model, Black-White Disparity
eFigure 6. Sensitivity of Estimates of Adjusted Discontinuity in Disparity in Cost-Related Barriers to Access and Vaccination Rates to Alterations in Bandwidth and Statistical Model, Black-White Disparity