

Abstract
Clinical translation of human pluripotent stem cells (hPSCs) requires advanced strategies that ensure safe and robust long-term growth and functional differentiation. Pluripotent cells are capable of extensive self-renewal, yet remain highly sensitive to environmental perturbations in vitro, posing challenges to their therapeutic use. Here, we deployed innovative high-throughput screening strategies to identify a small molecule cocktail that dramatically improves viability of hPSCs and their differentiated progeny. The combination of Chroman 1, Emricasan, Polyamines, and Trans-ISRIB (CEPT) enhanced cell survival of genetically stable hPSCs by simultaneously blocking several stress mechanisms that otherwise compromise cell structure and function. CEPT provided strong improvements for several key applications in stem cell research, including routine cell passaging, cryopreservation of pluripotent and differentiated cells, embryoid body (EB) and organoid formation, single-cell cloning, and genome editing. Thus, CEPT represents a unique polypharmacology strategy for comprehensive cytoprotection, providing a new rationale for efficient and safe utilization of hPSCs. Conferring cell fitness by multi-target drug combinations may become a common approach in cryobiology, drug development, and regenerative medicine.
Introduction
Pluripotency is a remarkable cellular state that allows unlimited self-renewal and differentiation into all cell types of the human body. The advent of the induced pluripotent stem cell (iPSC) technology has created novel paradigms for drug discovery, disease modeling, and cellular therapies1. However, to fully harness the therapeutic potential of iPSCs, it is critical to establish well-controlled, safe, and efficient strategies for cell line generation, cell expansion, directed differentiation into multiple phenotypes, and large-scale cell production (e.g. cryopreservation of master cell banks under good manufacturing practice conditions, “off-the-shelf” cellular products). Although significant progress has been made in characterizing the molecular and cellular features of pluripotency, culturing hPSCs remains variable and suboptimal2,3. This is particularly evident when hPSCs are dissociated into single cells for expansion, cryopreservation or cloning experiments. Poor survival of dissociated cells and low efficiency of single-cell cloning are also major obstacles for genome editing in iPSCs4,5.
A landmark paper reported that the Rho-associated coiled-coil forming protein serine/threonine kinase (ROCK) inhibitor Y-27632 improves survival of hESCs6. Subsequent studies identified that Y-27632 and other small molecules that act on the ROCK pathway (e.g. Blebbistatin, Fasudil, Pinacidil, Thiazovivin) improve cell survival by blocking cell contraction, which is detrimental to dissociated hPSCs and can lead to cell death by apoptosis and anoikis7–9. Interestingly, ROCK pathway inhibition also promotes the isolation and culture of sensitive cancer stem cells10. Other fields that benefit from using Y-27632 include reproductive biology, cryobiology, and transplantation medicine11. However, despite ROCK pathway inhibition and overall advances in cell culture techniques over the last two decades, poor cell survival remains a major roadblock due to lack of advanced approaches and incomplete understanding of the molecular mechanisms of cellular stress response in hPSCs. Hence, improving the viability of hPSCs and other sensitive cell types has become a daunting challenge. We here report the discovery and functional validation of a four-component small molecule cocktail, which enables integrated cytoprotection and provides new mechanistic insights into the complexity of cellular stress and can be broadly utilized in basic and translational research.
Results
New ROCK pathway inhibitor Chroman 1 is superior to Y-27632 and other drugs with similar mechanism
To discover novel compounds that can promote cell survival, we first determined conditions for hPSCs that enable CellTiter-Glo (CTG) cell viability screening in highly miniaturized 1536-well plates (Z’ factor = 0.77; Fig. 1a and Supplementary Fig. 1a-c). hESCs (WA09) were plated onto vitronectin (VN)-coated plates (500 cells/well) in chemically defined E8 medium and quantitative high-throughput screening (qHTS) was performed using diverse small molecule libraries12,13. We screened a total of 15,333 compounds, and each compound was tested at 7 to 11 different concentrations to generate full dose-response curves, a strategy that can reduce false-positive and false-negative rates in high-throughput screening14. This initial screen yielded 113 hits and the primary targets of these hits were mainly protein kinases and proteases (Supplementary Fig. 2a-d and Supplementary Table 1). Cluster analysis revealed that many active kinase inhibitors shared similar chemical structure with well-known ROCK1/2 inhibitors (Fig. 1b). Among these hits, 20 compounds were indeed known inhibitors of ROCK1/2 (e.g. Y-27632, Thiazovivin, Fasudil, GSK429286A). However, Chroman 1 emerged as the most potent ROCK inhibitor15 generating similar CTG readings as 10 μM Y-27632 when used at only 50 nM (Fig. 1c). Given this significant difference, we asked whether Chroman 1 could be a superior alternative to Y-27632, which is currently the most widely used ROCK inhibitor. Independent in vitro kinase assays confirmed that Chroman 1 was more potent against ROCK1 (IC50 = 52 pM) and ROCK2 (IC50 = 1 pM) than Y-27632 (ROCK1 IC50 = 71 nM and ROCK2 IC50 = 46 nM) (Fig. 1d,e). Furthermore, using the HotSpot kinase assay to profile target specificity against a panel of 369 human kinases that cover all major human protein kinase families16, we found that 10 μM Y-27632 inhibited not only its primary targets ROCK1/2 but also various off-targets such as PKCη (PRKCH), PKCε (PRKCE), PKCδ (PRKCD), PKN1, PKN2 and PRKX, to below 10% of their normal activity (Extended Data Fig. 1a,b). In contrast, 50 nM Chroman 1 only inhibited ROCK1/2 to such levels. When hPSCs were dissociated and treated with both inhibitors for 24 h, significantly fewer dead cells (Figs. 1f,g and 2e,f) and higher numbers of live cells (Fig. 2g) were detected in the presence of Chroman 1 compared to Y-27632. Moreover, hPSCs cultured for 40 passage with Chroman 1 (24 h exposure at every passage), maintained a normal karyotype (Fig. 1h), expressed pluripotency-associated markers, and differentiated into ectoderm, mesoderm, and endoderm by directed differentiation in adherent cultures (Extended Data Fig. 1c) and EBs (Extended Data Fig. 2f). Collectively, Chroman 1 was more potent and more selective against ROCK1/2 than Y-27632 and also improved cell survival by ~25% (Fig. 2g), while allowing long-term maintenance of pluripotency and multi-lineage differentiation. We therefore recommend replacing the widely used Y-27632 with Chroman 1.
Fig. 1: Quantitative HTS identifies Chroman 1 as best-in-class ROCK inhibitor.

a, Cell survival assay in 1536-well format for qHTS. Cell viability was assessed after compound exposure for 24 h using CellTiter-Glo (CTG) to measure cellular ATP levels of live cells.
b, Chemical structure similarity analysis of active compounds. Point size correlates with maximum survival achieved by the compound at all tested concentrations. Two compounds are connected in the similarity network when their chemical structures are similar (Tanimoto coefficient > 0.17). Color indicates the primary target (orange = AGC protein kinases; yellow = other protein kinases, green = caspases, gray = other targets).
c, Dose-response curves of selected ROCK inhibitors including Chroman 1, Fasudil, Thiazovivin and Y-27632 (n = 4 wells at each concentration of all groups). CTG readings were normalized to the average number obtained with 10 μM Y-27632 (control). Note that Thiazovivin shows toxic effects at higher concentrations.
d,e, Potency of Y-27632 and Chroman 1 against their primary targets ROCK1 and ROCK2 as determined by the HotSpot kinase assay (see also Extended Data Fig. 1a,b).
f,g, Improved survival of hESCs (WA09) with Chroman 1 treatment. Cells were dissociated with EDTA or Accutase and plated on VN in E8 Medium at 100,000 cells/cm2. Phase contrast and fluorescence images were taken 12 h after plating. Live and dead cells were stained with calcein green AM and propidium iodide (PI), respectively. Data represent mean ± s.d., n = 3 wells for each group, and 36 fields of view were analyzed for each well. ***p = 0.0004 for both comparison, one-way ANOVA. Scale bar, 100 μm.
h, hESCs (WA09) maintained a normal karyotype after serial passage (40 passages) with Chroman 1 applied for the initial 24 h during every passage.
Fig. 2: Combinatorial matrix screen identifies compounds with synergistic activities.

a, Heatmap summarizing the maximum CTG readings of all-versus-all dose matrices for 29 compounds (812 drug-drug combinations tested in total; see also Extended Data Fig. 2a-d for examples showing 10 × 10 checkerboard dose matrices). CTG readings were normalized to the value obtained with 10 μM Y-27632 representing 100% (control).
b, Total caspase-3 expression in hESCs (WA09) in comparison to their lineage-committed precursors after directed differentiation into ectoderm (PAX6), mesoderm (Brachyury), and endoderm (SOX17). Note that caspase-3 is strongly expressed in the pluripotent state and downregulated upon differentiation.
c, Western blot analysis of caspase-3 activation in response to single-cell dissociation. Cells were dissociated with Accutase and plated on VN in the presence of indicated compounds. Cell lysates were collected after 2 h-treatment, and caspase-3 activation (indicated by the cleaved version of caspase-3) was measured.
d, Live-cell imaging showing differences in cell behavior and survival upon treatment with Emricasan, Chroman 1 or C+E. Cells were dissociated with Accutase and plated on VN in the presence of indicated compounds. Cell blebbing continued in the presence of Emricasan and cells failed to attach to coated plates, eventually leading to cell death. In contrast, hESCs attached within 20 min when treated with either Chroman 1 or C+E. Scale bar, 25 μm. See also Supplementary Movie 1.
e-g, Combination of Chroman 1 with Emricasan (C+E) improves cell survival and reduces the number of apoptotic cells. hESCs (WA09) cells were dissociated with Accutase and plated on VN in E8 medium (100,000 cells/cm2). Caspase-3/7 green detection reagent was used to monitor caspase activation (e,f) and CTG was used to quantify viable cells 24 h post-seeding (g). Data represent mean ± s.d. (n = 25 fields of view for each group in f; n = 24 wells for each group in g), ****p < 0.0001 for both comparison, one-way ANOVA. Scale bar, 50 μm.
h, Emricasan effect on cleaved caspase-3 levels. Emricasan efficiently blocked activation of caspase-3 in response to cell dissociation but did not impact total caspase-3 levels. Note that cleaved caspase-3 is detectable 24–48 h after Emricasan washout.
i, hESCs (WA09) maintained a normal karyotype after serial passage for a total of 40 passages with C+E applied for the initial 24 h during every passage.
Chroman 1 and Emricasan synergize to enhance cell survival
Next, we adopted a combinatorial matrix screening strategy13 to test whether synergistic drug combinations can further improve cell survival. Considering the diverse mode of action (MOA) of identified hits (Supplementary Table 1), we prioritized 29 compounds for matrix screening (Fig. 2a). This experiment generated a total of 812 dose combination matrices. Exemplary matrices are shown in Extended Data Fig. 2a-d and all combinations analyzed are available here: https://tripod.nih.gov/matrix-client/?project=2621.
Using the Gaddum non-interacting model13, we identified several drug combinations with synergistic effects on cell survival (Fig. 2a). Generally, combinations of ROCK inhibitors or compounds with similar MOA (e.g. Chroman 1, Y-27632, Blebbistatin) together with pan-caspase inhibitors (e.g. Emricasan and Q-VD-OPh) yielded the strongest synergy scores (Extended Data Fig. 2a,b). In contrast, combined use of compounds with similar MOA (e.g. Chroman 1 and Blebbistatin) were modestly additive (Extended Data Fig. 2c,d). Knowing that Chroman 1 was more potent and more specific than Y-27632, we focused on characterizing the combination of Chroman 1 plus the clinical-stage drug Emricasan (C+E).
hPSCs display an overall increased propensity for cell death following replication stress or DNA damage17. Interestingly, the basal expression level of total caspase-3 was higher in pluripotent cells and downregulated during directed differentiation into ectoderm, mesoderm, and endoderm (Fig. 2b). When hPSCs were dissociated into single cells using Accutase and analyzed by Western blotting, Chroman 1 alone was already more potent than Y-27632 in reducing caspase-3 activation (cleaved form of caspase-3) but C+E was most efficient (Fig. 2c). Emricasan alone also efficiently blocked caspase-3 activation (Fig. 2c), however, without ROCK inhibition ongoing cell contractions eventually resulted in cell death (Fig. 2c,d and Supplementary Movie 1). Next, we used independent cellular assays to confirm that C+E was superior to single-compound treatment with either Y-27632 or Chroman 1. We monitored apoptosis following cell dissociation using CellEvent detection reagent, which labels cells upon caspase-3/7 activation. Exposure to C+E greatly reduced the emergence of green fluorescence, indicating minimal cell death (Fig. 2e,f). Accordingly, C+E treatment resulted in the highest number of live cells among all treatment groups (Fig. 2g; ~48% improvement over Y-27632).
To demonstrate that transient exposure to Emricasan was safe and did not permanently alter apoptosis in hPSCs, we monitored cleaved caspase-3 levels after cell dissociation following treatment with DMSO, Emricasan, and washout of Emricasan. We found that cleaved caspase-3 returned to basal levels 24–48 h after removing Emricasan, while total caspase-3 levels remained unaffected (Fig. 2h). To ensure that C+E was safe, we cultured hESCs for 40 passages and treated cells at every passage for 24 h with C+E. These cells maintained normal karyotypes (Fig. 2i), expressed pluripotency markers, and were capable of multi-lineage differentiation in monolayer and EB cultures (Extended Data Fig. 2e,f).
High-throughput screening at ultra-low cell density identifies the four-factor cocktail CEPT
Cell density and cell-cell contact are key determinants for hPSC survival3,18. The use of Chroman 1 alone or C+E significantly improved hPSC survival over Y-27632 during routine cell passaging (~25% and ~48%, respectively), however, advancement was relatively modest under extreme conditions such as very low cell density (25 cells/cm2; data not shown). This prompted us to develop a new combination screening assay to search for additional compounds that, when applied together with C+E, might further enhance cell survival. In this assay, we seeded only 10 cells into each well of 1536-well plates to model the stress associated with ultra-low cell densities (Extended Data Fig. 3a,b). Of note, we had used 500 cells/well in our original screen (Supplementary Fig. 1a,b and Supplementary Table 1). To our knowledge, high-throughput combination screening at ultra-low cell density using 1536-well plates has not been performed in the published literature. We used 3 replicate sets of plates to compensate for the variation that occurs when seeding such few cells for HTS and also took advantage of StemFlex culture medium and laminin (LN)-521 coating to further support cell growth at low cell density4,19. Using this new assay, a total of 7599 compounds was screened at single concentrations, selected individually for each chemical compound based on the efficacious and non-toxic concentration range optimized for NCATS libraries20, and after ranking all compounds by the median CTG values, we prioritized 316 hits that appeared to improve cell survival (Extended Data Fig. 3c and Supplementary Table 2). Guided by dose-response curves for these 316 hits (Extended Data Fig. 3d), the most promising hits (n = 36) were further studied. Among these hits were diverse classes of molecules previously reported to promote viability of hPSCs such as P53 inhibitors, antibiotics, and others5,21. Validating these hits indeed showed improved cell survival but Trans-ISRIB had the most significant effect when administered together with C+E (CET; Fig. 3a). Trans-ISRIB is a selective inhibitor of the integrated stress response (ISR) and regulates protein translation by directly targeting eIF2B, thereby reversing the effects of eIF2A phosphorylation and ensuring unperturbed protein synthesis22. Interestingly, Trans-ISRIB had failed to improve cell survival in our original single-agent screen (Supplementary Table 1), further underscoring the importance of polypharmacology. In a different set of experiments we empirically tested if other reagents and conditions may also support cell survival (e.g. 5% low oxygen, knockout serum replacement, Albumax, ascorbic acid, antioxidant supplement). We noticed that a commercially available mixture of Polyamines (40 ng/ml putrescine, 4.5 ng/ml spermidine, 8 ng/ml spermine), when applied together with C+E (CEP), promoted cell survival as well (Fig. 3b,c). Polyamines are essential polycations known to support cell growth, stabilize cellular structures and macromolecules, and modulate several cellular functions such as transcription, translation, cell cycle, stress response23 and self-renewal of mouse ESCs24. However, the polyamine pathway remains largely understudied in hPSCs. Using impedance analysis, we found that polyamines and Trans-ISRIB supported cell attachment during cell passaging when combined with C+E (Fig. 3d). Similarly, puromycin pulse-chase experiments revealed that polyamines and Trans-ISRIB in combination with C+E supported protein synthesis during cell passaging (Fig. 3e). Importantly, the strongest synergistic effects were observed when Chroman 1, Emricasan, Polyamines and Trans-ISRIB (CEPT) were used together, resulting in improved cell survival, cell attachment, and protein translation as compared to CET and CEP treatments (Fig. 3b-e). Based on these findings, independently reproduced by different team members, the utility of CEPT was further tested in the experiments detailed below.
Fig. 3: Combination of Chroman 1, Emricasan, Polyamines and Trans-ISRIB promotes clonal growth and expansion of genetically stable hPSCs.

a, Secondary combination screening validates multiple hits showing synergistic activity with C+E in promoting cell survival at ultra-low cell density. hESCs (WA09) were plated on LN521 at 25 cells/cm2 in StemFlex medium. After a 3-day incubation with compounds (in order not to disturb cells with early media changes), live cell numbers were quantified using calcein green AM on day 6. Data are presented as box plot (n = 6 wells for each group). Cell survival index represents cell numbers normalized to the C+E control group. Boxed area shows chemical structure of Trans-ISRIB, which had the strongest synergy with C+E among all hits.
b,c, CEPT combination is the most superior condition for cell survival. hESCs (WA09) were plated on LN521 at 25 cells/cm2 in StemFlex medium. After a 3-day incubation with compounds, cells were stained on day 6 with alkaline phosphatase (c) and calcein green AM (b). Data are mean ± s.d. n = 6 wells for each group, ****p < 0.0001 for both Y-27632 v.s. CET and Y-27632 v.s. CEPT, ***p = 0.0002 for Y-27632 v.s. CEP, one-way ANOVA. Scale bars, 300 μm.
d, Impedance-based continuous analysis of hESCs (WA09) shows that polyamines and Trans-ISRIB support cell attachment when added to C+E (CEP and CET), whereas CEPT is the most optimal condition. Data are mean ± s.e.m., n = 5 biological replicates for Y-27632, C+E, CEP, CET, n = 6 biological replicates for CEPT, and n = 7 biological replicates for Chroman 1.
e, Puromycin pulse-chase experiments using hESCs (WA09) and iPSCs (LiPSC-GR1.1) reveal that protein synthesis is impaired during routine cell passaging (3 h post-plating). Note the positive effects of polyamines and Trans-ISRIB when added to C+E (CEP and CET) but CEPT is the most favorable condition.
f, Pearson correlogram and significance of 95% confidence interval (X = not significant, color indicates direction of correlation) summarizing that there was no correlation between cell line, passage number or SNP genotype after hESCs were passaged for 20 passages using CEPT (24 h treatment at each passage). See also Extended Data Fig. 5c-f for more details.
g, Microfluidic cell sorter Hana used for fast and gentle single-cell dispensing.
h, Comparison of cloning efficiency using different hESC (WA01, WA09, HUES53) and iPSC (JHU078i) lines after cell sorting using Hana. Data are mean ± s.d. (WA01, n = 5 plates for both groups, **p = 0.0028; WA07, n = 4 plates for both groups, ****p < 0.0001; HUES53, n = 4 plates for both groups, **p = 0.0023; JU078i, n = 4 plates for Y-27632 and n = 6 plates for CEPT, **p = 0.0020). Unpaired two-tailed Student’s t-test.
i, Microfluidic cell dispensing of hESCs (WA09) and treatment with Y-27632, CEPT, and CloneR. Representative overview of 96-well plates showing alkaline phosphatase-positive clones.
j, Quantification of cloning experiments shown in (i). Cells were stained for alkaline phosphatase and quantification was performed 9 days after sorting single cells into 96-well plates. Data are mean ± s.d. (n = 4 plates for each group, ****p < 0.0001 for both comparisons), one-way ANOVA.
k, Live-cell imaging showing that CEPT enables single cell survival and growth into a clonal colony. See also Supplementary Movie 2. Scale bars, 300 μm.
Efficient and safe serial cell passaging by CEPT
To provide evidence that CEPT is compatible with routine long-term passaging, we cultured eight different cell lines using CEPT (exposure for 24 h at each passage) and performed careful analyses. Phase-contrast microscopy, immunocytochemistry, and quantitative high-content imaging confirmed that the vast majority of cells remained undifferentiated, expressed pluripotency-associated markers (alkaline phosphatase, OCT4, NANOG, SOX2) and retained normal karyotypes (Extended Data Fig. 4a-c). As expected, these cell lines were also capable of normal differentiation into neuronal cells and other lineages (Extended Data Fig. 4d and data not shown). Furthermore, four different cell lines (WA01, WA09, LiPSC-GR1.1, HUES53) were adapted to different media formulations (E8, StemFlex, mTeSR, MEF-conditioned medium, StemFit) and coating substrates (VN, Matrigel, LN521) and cell survival was compared at cell passaging using DMSO (control), Y-27632, CEPT, and commercially available reagents (CloneR, RevitaCell, SMC4) that were previously reported to support cell survival4,25. This unbiased systematic comparison in 384-well plates demonstrated that CEPT improved cell survival independent of cell line, media composition or coating substrate used (Supplementary Fig. 3).
Next, whole exome sequencing (WES) was used to monitor hESCs and iPSCs treated with CEPT for 20 passages (treatment for 24 h at every passage). Both cell lines maintained normal features of pluripotency including self-renewal and multi-lineage differentiation (Extended Data Fig. 5a,b). To perform more detailed genetic analysis on cells passaged with CEPT, we annotated variants for known cancer hotspots using various databases such as Cancer Hotspots26, Catalogue of Somatic Mutations in Cancer (COSMIC)27; hg38 RefSeq Gene28, dbSNP15029, The 1000 Genomes Project (TGP)30; The Exome Aggregation Consortium (ExAC)31, PolyPhen232, and ClinVar33 (Fig. 3f and Extended Data Fig. 5c-f). Recently reported dominant-negative mutations in the tumor suppressor gene TP5334 were absent in all samples, before and after CEPT treatment (passage 0, 10, 20). The only detected exonic TP53 single nucleotide polymorphism (SNP), rs1042522, was already present in hESCs and iPSCs, did not change due to CEPT exposure during passaging (Extended Data Fig. 5c), and is likely to be benign (ClinVar). Genotypes of 19 other COSMIC variants that were exonic and nonsynonymous also did not change during passaging (Extended Data Fig. 5c). Similarly, there was no significant correlation between carrier status of single SNPs or insertions/deletions (indels), number of passages after CEPT treatment, cell line, predicted variant effect, or sample genotype (Fig. 3f and Extended Data 5c-f). Collectively, CEPT is suitable for long-term serial passaging of hPSCs and does not induce widespread genetic abnormalities or cancer-causing mutations.
Efficient single-cell cloning by CEPT
To perform cloning experiments, we first used flow cytometry-based cell sorting into 96-well plates and compared cloning efficiencies after treatment with Y-27632 or CEPT. Treatment with CEPT yielded significantly more clones compared to Y-27632 (Extended Data Fig. 6a,b). To independently validate these observations and establish an improved platform for high-throughput cloning of hPSCs, we used a novel microfluidic-based cell sorting approach. This technology allows fast and gentle single-cell sorting in 96-well plates (1 min per plate) using pressure less than 2 psi (Fig. 3g), which is typically not achieved by traditional flow cytometry. Comparing four different cell lines, we noticed the expected variability in clonogenicity across different cell lines, however, CEPT was consistently superior to Y-27632 (Fig. 3h). Next, we compared CEPT to CloneR, a reagent specifically developed for single-cell cloning. CEPT was superior to Y-27632 and also outperformed CloneR in StemFlex medium (Fig. 3i,j). Using a different medium (mTeSR1), CEPT was again superior to Y-27632 and produced similar cloning rates as CloneR (Extended Data Fig. 6c). The reliable performance of CEPT enabled monitoring the growth of single cells into clonal colonies using time-lapse video microscopy (Fig. 3k and Supplementary Movie 2). As a third approach, improved single-cell cloning with CEPT was validated using Cytena (Molecular Devices), which directly captures microscopic images as evidence for stringent single-cell dispensing (Extended Data Fig. 6d-f). When comparing LN521 and VN coating, hESCs and iPSCs survived better and were more migratory on LN521, as also previously reported19, resulting in less compact clones as well as sometimes multiple cell clusters arising from a single cell that was dispensed (Extended Data Fig. 6g). On the other hand, hPSCs showed poorer survival, migrated less and always formed tight colonies on VN (Extended Data Fig. 6f). Lastly, eight clones generated by using CEPT were randomly selected and established as clonal cell lines. After four passages, all clonal cell lines (8/8) were karyotypically normal (Extended Data Fig. 6h) suggesting that CEPT did not cause genetic abnormalities.
Improved workflow for gene editing in hPSCs
Genome editing of hPSCs is cumbersome and time-consuming because cloning hPSCs is inefficient, requiring additional strategies such as drug selection, genetic modifications, p53 inhibition, and laborious cell culture work to identify and expand precisely edited cells5,35,36. Having established CEPT as a powerful tool for cell cloning (Fig. 3g-k and Extended Data Fig. 6a-g), we sought to demonstrate its usefulness for genome editing using CRISPR/Cas9. First, using three different cell lines, we confirmed that CEPT improved cell survival during electroporation, which is an additional stressful event for dissociated hPSCs (Extended Data Fig. 6i-l). As proof-of-principle, we then followed a recently published protocol36 and used the same parental cell line and reagents to engineer a knock-in reporter cell line by introducing the sequence for GFP in front of exon 1 of the LMNB1 gene (Extended Data Fig. 7a). After nucleofection of the donor vector together with the ribonuclear protein (RNP) complex of wild-type Cas9 protein and a synthetic sgRNA targeting the first exon of LMNB1, we obtained a mixture of GFP+ and GFP- cells at day 3. GFP+ cells displayed varying fluorescence intensities and labeling of the peri-nuclear region suggested successful tagging of GFP to the N-terminus of LMNB1 (Extended Data Fig. 7b). To identify correctly edited cells, individual GFP+ cells were sorted into single wells of 96-well plates. Treatment with CEPT enabled robust cell survival and clone formation. On day 12, we randomly picked 8 colonies and established clonal lines, which again was facilitated by CEPT administration during clone picking and subsequent passaging. Droplet digital PCR (ddPCR) was used to quantify copy numbers of the GFP-tag sequence, the ampicillin resistance gene (AMP) as part of the vector backbone, and the two-copy genomic reference gene RPP30 (Extended Data Fig. 7c). Of these eight clones, five clones showed mono-allelic integration, one clone indicated bi-allelic integration, and two clones had integrated the vector backbone containing AMP (Extended Data Fig. 7d). Fluorescence intensity, junctional PCR, Sanger sequencing and Western blot analysis of clone #5 (mono-allelic) and #8 (bi-allelic) confirmed accurate editing and differential expression of GFP-LMNB1 (Extended Data Fig. 7e-h). Moreover, genome-edited clones were karyotypically normal and capable of multi-lineage differentiation (Extended Data Fig. 7i-k). Hence, the workflow established here using CEPT should facilitate the efficient production of genome-edited iPSC lines and avoid testing hundreds of putative clones36.
Optimizing EB and organoid formation by CEPT
Generation of EBs from hPSCs is a widely used assay to measure pluripotency and differentiation into the three germ layers37. More recently, EBs have been utilized to produce organoids38. Since large numbers of cells undergo cell death and introduce significant variability during EB and organoid formation, we asked if CEPT could be beneficial in this context. hESCs were dissociated and plated into ultra-low attachment (ULA) plates in the presence of DMSO, Y-27632, Chroman 1 or CEPT. After 24 h, a striking difference was observed in that CEPT produced not only the most numerous numbers of EBs but these cultures were also virtually devoid of cellular debris (Fig. 4a). Dramatic improvement in cell survival was further confirmed under more controlled conditions when single EBs were generated in individual wells after performing cell counts. Exposure to CEPT for 24 h generated larger EBs (Fig. 4b,c), minimized cell death (Fig. 4d), and improved cell survival by 242% as compared to Y-27632 (Fig. 4e). Robust and continuous cell growth over 7 days was observed in EBs initiated with CEPT but not with Y-27632 (Fig. 4e). To find out if improved EB quality due to minimal cell death might have functional consequences, we developed a new assay to measure the differentiation potential of single EBs. Using 96-well plates, 20,000 cells were plated per well in chemically defined E6 Medium. On day 7, single EBs were measured for the expression of PAX6, Brachyury, and SOX17 genes using quantitative PCR (see Methods). Careful analysis revealed that a higher percentage of EBs (n = 24 EBs per group) displayed expression of all three genes after CEPT treatment (54%) compared to Y-27632 (25%). Hence, under these extreme conditions CEPT treatment more reliably generated EBs capable of multi-lineage differentiation (Fig. 4f and Extended Data Fig. 8a).
Fig. 4: Optimized EB and organoid formation.

a, EB formation in the presence of DMSO, Y-27632, Chroman 1 and CEPT. Human ESCs (WA09) cells were dissociated with Accutase and plated into 6-well ULA plates in E6 Medium. Representative phase-contrast images were taken at 24 h post-plating. Note that poor cell survival is typically observed when hPSCs are dissociated and plated in chemically defined E6 Medium without ROCK inhibitor (DMSO group). Scale bar, 200 μm.
b, Single EBs from hESCs (WA09) were generated by plating a defined number of cells (Accutase dissociation) into AggreWell plates (5,000 cells/well) in E6 Medium. Images were taken 24 h post-plating. In the presence of DMSO the vast majority cells underwent cell death and EB formation was not observed, which is a typical outcome when hPSCs are cultured in chemically defined E6 Medium in the absence of a ROCK inhibitor. Treatment with Y-27632 supported EB formation but significant fraction of dead cells was observed surrounding the EB. Note that CEPT enables superior EB formation. Scale bar, 100 μm.
c, Quantification of the diameter of single EBs (24 h post-plating). Data are mean ± s.d. (n = 20 EBs for Y-27632 and 22 for CEPT), ****p < 0.0001, unpaired two-tailed Student’s t-test.
d, Single EB formation in 96-well ULA plates. Dissociated hESCs were plated into 96-well ULA plates at 2,000 cells/well in E6 Medium. Live and dead cells were stained (calcein green AM and PI) 24 h after cell seeding. Scale bars, 100 μm.
e, Quantification of cell numbers in single EBs at day 1 and day 7 by using the CTG 3D assay. Note the significant difference between Y-27632 and CEPT treatment at both timepoints. Data represent mean ± s.d. (n = 24 EBs for each group), ****p < 0.0001 for both comparisons, one-way ANOVA.
f, CEPT improves multi-lineage differentiation of single EBs. Individual EBs were cultured in 96-well ULA plates in E6 Medium to allow for spontaneous differentiation. The percentage of EBs expressing lineage-specific genes (PAX6, SOX17, Brachyury) was analyzed on day 7 using an optimized quantitative RT-PCR protocol that enabled detection of low transcript levels in single EBs. Data represent mean ± s.d. (n = 3 experiments, 24 EBs were analyzed per experiment for each group), *p = 0.0327, unpaired two-tailed Student’s t-test.
g,h, Cerebral organoids were generated by administration of Y-27632 or CEPT for the first 24 h. On day 30, organoids were fixed, sectioned, processed for histology (hematoxylin and eosin stain) and immunohistochemistry for FOXG1. Representative images show that CEPT treatment resulted in larger organoids and more abundant FOXG1-expressing cells. Scale bars, 400 μm.
i, RNA-seq analysis based on differentially expressed (DE) genes in day-60 organoids showing more neural-specific categories after CEPT treatment versus Y-27632. The analysis was performed by comparing top 200 DE genes in each group to 84,863 transcriptomes representing diverse human cells and tissues in the ARCHS4 datasbase39. DE genes were normalized to undifferentiated hPSCs.
To investigate if organoid formation may also benefit from CEPT, we generated cerebral organoids38 using a kit (STEMCELL Technologies). The only difference that we introduced to the kit-based protocol was the use of CEPT instead of Y-27632 during the first 24 h. Histological analysis using hematoxylin-eosin staining at day 30 showed a dramatic difference in neural tissue differentiation (Fig. 4g). Immunohistochemistry for the forebrain marker FOXG1 confirmed that organoids generated by using CEPT produced larger amounts of neural tissue displaying complex morphologies (Fig. 4h). Improved neural differentiation of organoids generated by CEPT versus Y-27632 was also confirmed by unbiased transcriptomic analysis using massive mining of publicly available RNA-seq data39. Comparison of top-hit categories suggested that CEPT produced organoids with improved neural differentiation whereas Y-27632 treatment resulted in neural as well as non-neural categories such as omentum, adipose tissue, and respiratory smooth muscle (Fig. 4i). To test whether CEPT may also be beneficial for other developmental lineages, we focused on kidney organoid formation using a kit recommending the use of Y-27632 (STEMCELL Technologies). When Y-27632 was again replaced by CEPT, improved kidney organoid formation was observed, with stronger effects when lower cell numbers were plated per well (Extended Data Fig. 8b,c). Collectively, these findings indicate that optimizing cell survival during EB and organoid formation within the first 24 h has long-lasting consequences. Improving cell survival and minimizing cell death as an inherent variable should help with generating more reproducible EBs and organoids.
A chemical foundation for biobanking and utilization of pluripotent and differentiated cells
Development of cellular products requires reliable protocols for biobanking of various phenotypes at different developmental stages for on-demand use in drug screening, toxicology, and cell therapy. Cryopreservation and thawing hPSCs has been notoriously problematic and inefficient40,41. Remarkably, thawing cryopreserved hESCs (WA09) was dramatically improved after CEPT treatment for 24 h (~300%) compared to Y-27632 (Fig. 5a-c). To perform a more systematic comparison, we used different combinations of reagents for cell cryopreservation and thawing (Fig. 5d-g). Interestingly, the use of three different cryopreservation methods (Y-27632, CEPT, commercially available mFreSR) had little impact and yielded similar results, whereas the reagents administered during thawing produced large variations (Fig. 5d). Hence, all five hPSC lines tested showed significantly improved viability in the presence of CEPT versus DMSO, Y-27632, RevitaCell, CloneR and SMC4 (Fig. 5e-g). We therefore recommend using CEPT for both cryopreservation and thawing of hPSCs. Furthermore, since optimal biobanking is critical for regenerative medicine, we confirmed that CEPT treatment provided superior cell survival after long-term storage (cryopreservation with CEPT for 12 months) and thawing of hESCs, iPSCs, and astrocytes (Extended Data Fig. 9a, upper panel). Similarly, when long-term cryopreserved cells were kept on dry-ice for 72 h prior to thawing to simulate the shipment of frozen vials of stem cell product, the use of CEPT again dramatically improved cell survival (Extended Data Fig. 9a, lower panel).
Fig. 5: CEPT enables superior cryopreservation of pluripotent and differentiated cells.

a-c, Cryopreserved hESCs (WA09) were thawed and plated in E8 Medium in the presence of indicated compounds. Caspase-3/7 green detection reagent was used to monitor apoptosis over 12 h (a,b) and the CTG assay was used to quantify live cells 24 h post-thawing (c). Data represent mean ± s.d. (n = 25 fields of view for each group in b; n = 12 wells for each group in c), ****p < 0.0001, one-way ANOVA. Scale bar, 50 μm.
d, Variation analysis of experiments shown in e-g reveals that the thawing process is most critical for improving cell survival, whereas the use of mFreSR, Y-27632, or CEPT during cryopreservation yields similar results. Hence, the total variation for cryopreservation was 7%, while thawing accounted for 88% variation across groups. Source of variance values associated with cryopreservation and thawing processes from two-way ANOVA analysis (Fig. 5e-g) were compared by unpaired two-tailed Student’s t-test (n = 5 cell lines, ****p < 0.0001). Data is presented as mean ± s.d.
e-g, Different reagents and combinations were used for cryopreservation (mFreSR, Y-27632, CEPT) and thawing (DMSO, Y-27632, CEPT, RevitaCell, CloneR, SMC4) of two hESC lines and three iPSC lines. The recovery of cryopreserved cells was quantified by live and dead cell staining with calcein green AM and PI. Data is presented as mean ± s.d. n = 3 wells per combination of treatments. Note that CEPT is consistently superior during the cell thawing process compared to other reagents across all cell lines tested.
h, Frozen vials of iPSC-derived cardiomyocytes, hepatocytes, astrocytes, and motor neurons were thawed and treated with DMSO, Y-27632, and CEPT for 24 h. Cell survival was quantified using the CTG assay. Data are mean ± s.d. (n = 3 wells for each group), Cardiomyocytes, **p = 0.0047; Hepatocytes, ***p = 0.0008; Astrocytes, **p = 0.0021; Motor neurons, **p = 0.0019; one-way ANOVA.
i-k, Electrophysiological characterization of iPSC-derived cardiomyocytes 5 days post-thawing using multi-electrode arrays. Data in j represent mean ± s.d. (n = 6 wells for each group), **p = 0.0029, ***p = 0.0001, one-way ANOVA. Data in k represent mean ± s.d. (n = 6 wells for each group), *p = 0.0165, ***p = 0.0005, one-way ANOVA.
Next, we asked if CEPT may also improve the thawing of cryopreserved differentiated cells. Several iPSC-derived cell types obtained from a commercial vendor (FUJIFILM CDI) including cardiomyocytes, hepatocytes, motor neurons and in-house generated astrocytes showed significantly improved cell survival after CEPT treatment (Fig. 5h). For instance, cardiomyocytes showed ~36% improvement and motor neurons exhibited ~63% improvement as compared to DMSO. Improved survival of cardiomyocytes and motor neurons had long-lasting consequences and was reflected by enhanced functional activity as measured by multi-electrode arrays for up to 14 days post-plating (Fig. 5i-k and Extended Data Fig. 9b,c).
Lastly, to determine whether CEPT can support new iPSC line establishment, we used a Sendai virus-based method and the Yamanaka factors (OCT4, SOX2, C-MYC, KLF4) to reprogram skin fibroblasts42. Picking clones or colonies and establishing new iPSC lines is a critical step influenced by multiple technical and biological variables (e.g. donor age, proliferation rate, colony picking technique, culture conditions). When individual, similar-sized colonies (n = 30) of reprogrammed cells were picked and carefully transferred to single wells (10 colonies per condition), CEPT treatment yielded significantly more cellular progeny than the DMSO and Y-27632 groups (Extended Data Fig. 9d,e). Thus, CEPT should make colony picking more practical, which is important for automated platforms and handling a large number of newly generated iPSC lines in parallel43.
Chemical cytoprotection as a new approach for hPSC culture
To gain insights into the cellular and molecular mechanisms that are initiated in hPSCs after cell dissociation, we performed a series of complementary experiments. Irregularly shaped nuclei of stressed cells (nuclear dysmorphia) can compromise genomic stability in normal and cancerous cells44. Using a Lamin B1 (LMNB1) green fluorescent protein (GFP) reporter iPSC line36 and confocal microscopy at 3 h post-passage, we observed irregularly shaped nuclei in the presence of DMSO and Y-27632, whereas CEPT treatment maintained normal circularity of nuclei (Fig. 6a). Importantly, under DMSO or Y-27632 treatment, phosphorylation of histone variant H2AX on serine 139 (designated as γH2AX), a marker for DNA double-strand breaks and genomic instability17, was detected by immunocytochemistry and Western blotting. In contrast, γH2AX was absent in CEPT-treated cultures (Fig. 6b, 6f and Extended Data Fig. 10a). This striking finding suggests that DNA damage occurs more frequently during routine passaging of hPSCs than previously anticipated and can be prevented by CEPT. Next, immunocytochemical analysis of actin and non-muscle myosin (MYH10) revealed dramatic differences in cytoarchitecture at 3 h post-plating (Fig. 6c). Signs of cellular stress were detected in the presence of DMSO such as blebbing due to constant cell contractions7. As expected, treatment with Y-27632 prevented blebbing but led to the formation of actin stress fibers at the colony edge as previously reported18. In contrast, cells readily attached to VN-coated plates and displayed normal morphologies in the presence of CEPT (Fig. 6c). Next, we performed live-cell imaging and monitored the expression of the tight junction protein TJP1 (also known as ZO-1) by using a GFP reporter line36. Again, significant morphological differences were evident between all groups at 3 h post-passage indicating that CEPT-treated iPSCs were less stressed and recovered faster from single cell dissociation compared to DMSO and Y-27632 (Fig. 6d). Western blots confirmed that TJP1 (ZO-1) and other cell membrane-associated proteins such as cell adhesion molecule CDH1 (E-CADHERIN), focal adhesion molecule paxilin (PXN), and Annexin A1 (ANXA1) were expressed at higher levels in the presence of CEPT versus Y-27632 (Fig. 6e and Extended Data Fig. 10b). Together, these observations suggest that CEPT protects cells from anoikis more efficiently than Y-27632.
Fig. 6: CEPT protects dissociated hPSCs from multiple cellular stress mechanisms.

a, Confocal microscopic analysis of Lamin B1-GFP reporter cell line displaying dramatic morphological differences in nuclear shape during cell passaging (30 min post-plating). Note the abnormal nuclear morphology of cells undergoing contractions in the presence of DMSO. Although Y-27632 inhibits cell contractions and nuclear morphologies appear more normal, furrow-like constrictions (white arrowheads) indicate that nuclei are affected by ongoing physical stress. In contrast, cells exposed to CEPT maintain normal circular nuclei. Scale bar, 10 μm.
b, OCT4 expressing cells were immunoreactive for γH2AX when exposed to DMSO and Y-27632 (red arrowheads) but not when treated with CEPT (3 h post-plating). Scale bar, 10 μm.
c, Dramatic cytoskeletal differences during cell passaging (3 h post-plating) as measured by immunocytochemistry against actin and myosin. Stressed cells show blebbing (white arrowheads) in the presence of DMSO or form prominent actin stress fibers at the colony edge when exposed to Y-27632 (white arrowheads). Note the normal morphology and cell attachment in the presence of CEPT. Scale bar, 10 μm.
d, Confocal analysis of an iPSC GFP reporter cell line visualizing the tight junction protein TJP1 (ZO-1) before passaging and after cell dissociation. Representative images were taken 3 h post-plating for DMSO, Y-27632, and CEPT. Note the dramatic differences across treatment groups and better recovery of dissociated cells when treated with CEPT. Scale bar, 10 μm.
e, Western blot analysis of hESCs (WA09) treated with Y-27632 or CEPT. Several membrane-associated proteins were expressed at higher levels after CEPT treatment (24 h post-plating). Similar results were obtained with iPSCs (see Extended Data Fig. 10b).
f, Western blot analysis of hESCs (WA09) showing strong stress response in cells treated with DMSO or Y-27632 (3 h post-passage). Note the absence of γH2AX and ATF4 in CEPT-treated cells resembling the control group (no passage). Similar results were obtained with iPSCs (see Extended Data Fig. 10a).
g, Puromycin pulse-chase experiment of hESCs (WA09) demonstrates that protein synthesis was strongly impaired during cell passaging and can be rescued by CEPT (3 h post-passage). See also Extended Data Fig. 10c confirming these observations using iPSCs.
h, Glutathione levels were significantly higher in hESCs (WA09) passaged with CEPT (3 h post-plating). Data are mean ± s.d. (n = 4 wells for each group), ****p < 0.0001 for both comparison, one-way ANOVA. Similar results were obtained with additional two hESC and three iPSC lines (see Extended Data Fig. 10d).
i, Neutral 96-well comet chip assay was carried out on three different cell lines after treatment with different reagents (6 h post-passage). Note that CEPT-treated cells always displayed the lowest amount of DNA double-strand breaks. Data are mean ± s.d. (n = 5 replicates for each group), WA09, ****p < 0.0001; LiPSC-GR1.1, ****p < 0.0001, ***p = 0.0005, *p = 0.0198; NCMR-5, ****p < 0.0001, **p = 0.0058, one-way ANOVA.
j, Representative images showing comets stained with SYBR Gold and imaged by fluorescence microscopy. Comet tails were analyzed with the Comet Analysis Software (Trevigen) and correlated with the amount of DNA damage in single cells. Scale bar, 20 μm.
k, Schematic summarizing the various interconnected stress mechanisms that affect cell structure and function. Comparison between stressed (DMSO or Y-27632) and cytoprotected (CEPT) cells.
l, Overview of the various applications that can be optimized by using CEPT.
To delineate other cytoprotective mechanisms provided by CEPT, we performed additional Western blot experiments at 3 h post-passage using hESCs and iPSCs. As mentioned above, DNA damage was indicated by γH2AX expression and could be prevented by CEPT (Fig. 6b,f). Phosphorylation of checkpoint kinase 2 (CHK2), a marker for cell cycle arrest45, was detectable at higher levels in cultures exposed to DMSO and Y-27632 versus CEPT (Fig. 6f and Extended Data Fig. 10a). These observations are important because DNA damage and re-entering the cell cycle after cell dissociation are bottlenecks for hPSC survival3. Activating transcription factor 4 (ATF4) is a master regulator of cellular stress response in normal cells (e.g. unfolded protein response, ER stress, amino acid deprivation, hypoxia) and is frequently upregulated in cancer cells46. Notably, CEPT-treated cells and controls (no passage) did not express ATF4, whereas cultures treated with DMSO or Y-27632 strongly induced ATF4 in hESCs and iPSCs (Fig. 6f and Extended Data Fig. 10a). Moreover, CEPT treatment resulted in significantly lower levels of phosphorylated serine 51 of eIF2A, whereas high phosphorylation levels in DMSO and Y-27632 indicated protein translation arrest (Fig. 6f and Extended Data Fig. 10a). Pulse-chase puromycin experiments47 confirmed that protein synthesis was strongly impaired during cell passaging with DMSO, improved by Y-27632, but was markedly higher after CEPT treatment at 3 h post-passage (Fig. 6g and Extended Data Fig. 10c). Next, we measured glutathione levels after single cell dissociation. The tri-peptide glutathione is one of the most abundant intracellular antioxidants that protects mammalian cells from oxidative stress by maintaining redox homeostasis48. As confirmed in six different hPSC lines, glutathione levels were significantly higher in cells passaged with CEPT compared to DMSO and Y-27632 (Fig. 6h and Extended Data Fig. 10d), consistent with the notion that hPSCs were less stressed and better protected by CEPT. To further investigate the possibility that routine cell passaging of hPSCs may lead to DNA damage and genomic instability, we used the Comet assay as an independent and more direct assay for DNA double-strand breaks49 and compared CEPT to Y-27632 and commercially available reagents (CloneR, RevitaCell, SMC4). Remarkably, only CEPT prevented DNA double-strand breaks at 6 h post-passage as measured in three different cell lines, whereas significant DNA damage was observed in all other treatment groups (Fig. 6i,j).
To provide evidence that CEPT was cytoprotective while maintaining normal cellular stress response, we performed experiments using etoposide, a chemotherapeutic drug known to cause DNA damage. First, dose-response experiments established a positive correlation for increased etoposide concentrations and the amount of phosphorylated γH2AX (Extended Data Fig. 10e). Second, hESCs (WA09) growing in colonies (day 3 after passaging) showed basal expression of phosphorylated γH2AX (Extended Data Fig. 10f, first lane serving as control group treated with DMSO) consistent with the notion that hPSCs undergo replication stress as previously reported17. Interestingly, CEPT treatment for 3 h reduced the amount of γH2AX (Extended Data Fig. 10f, second lane). However, 3 h etoposide exposure strongly increased the signal for phosphorylated γH2AX (Extended Data Fig. 10f, third lane), whereas simultaneous administration with CEPT was capable of blunting the effect of etoposide (Extended Data Fig. 10f, fourth lane). Lastly, etoposide strongly induced various markers of DNA damage and stress (induction of p21, p53 and phosphorylation of BRCA1, CHK2, and p53) indicating that a normal physiological stress response is possible in the presence of CEPT (Extended Data Fig. 10g).
In summary, these findings support the notion that CEPT buffers cellular stress and provides comprehensive cytoprotection, which is not achieved by other strategies. The multiple advantages of using CEPT include the following: inhibition of cell contraction, maintenance of normal nuclear circularity, protection from DNA damage, prevention of cell cycle arrest, restoration of protein synthesis, higher expression level of proteins that enable cell-cell and cell-ECM interactions, and higher glutathione levels (Fig. 6k). Therefore, CEPT safeguards cell survival and cell fitness by favorably regulating complex interconnected mechanisms of cell structure and function that are compromised otherwise due to cascading events of cellular stress (Fig. 6l). Lastly, the CEPT cocktail is more cost-efficient compared to Y-27632, RevitaCell, CloneR and SMC4 (Supplementary Table 3), representing a versatile end-to-end platform that can be widely used in various fields.
Discussion
Controlling viability, safety, and cell function are key challenges for translational stem cell research. We addressed these challenges by performing iterative single-agent and combination screens in high-throughput 1536-well format using hPSCs. Overall, we screened 198 plates and a total of 304,128 samples and established full dose-response curves for nearly 16,000 compounds representing high-value selective tool molecules. The dataset should prove useful as a mining resource for biological experiments and cheminformatics. The present discoveries enabled the development of a versatile small molecule cocktail that helps to overcome fundamental challenges in cell culture. Mechanistic follow-up studies revealed the importance of using a multi-target polypharmacology strategy for cytoprotection and maintenance of normal cell structure and function during critical periods of cellular stress such as cell passaging (Figure 6k). CEPT was beneficial in widely used stem cell procedures, which has immediate and far-reaching implications for basic research and clinical applications (Fig. 6l). None of the currently available reagents that were tested in this study (Y-27632, CloneR, RevitaCell, SMC4) showed similar cytoprotective effects against cellular stress and DNA damage (Fig. 6i,j). We propose that CEPT will help to establish new quality control standards, increase experimental reproducibility, and bring the iPSC technology to patients more efficiently. Currently, there is no consensus in the field on the best method for routine passaging of hPSCs and therefore some laboratories address poor cell survival by passaging cells at higher density, while other groups try to improve cell survival by using various ROCK pathway inhibitors (e.g. Y-27632, thiazovivin, and blebbistatin). These strategies are insufficient and largely underestimate the amount of cellular stress that is prevalent in hPSC cultures during the first hours of cell passaging. Therefore, assessing cell culture quality should go beyond a routine check of recovered cells at 24 h post-passage and adding fresh medium. We anticipate that CEPT will become a more broadly used strategy for stem cells and various other fields that currently rely on ROCK pathway inhibition such as reproductive biology, cryobiology, transplantation medicine, and cancer research (e.g. establishing new cancer cell lines from patient material, isolating cancer stem cells, producing chimeric antigen receptor T cells)50,51.
Non-random genetic variations and oncogenic mutations can arise in hPSC cultures52–55. These changes occur largely for unknown reasons but increased passage number and enzymatic cell dissociation correlate with the risk of accumulating genetic aberrations3,56,57. In addition, hPSCs are predisposed to replication stress due to their shortened G1 phase during cell cycle17,58. Our data provide a new perspective by demonstrating that under currently used culture conditions and routine cell passaging, self-renewing hPSCs are exposed to unexpectedly high levels of stress affecting various cellular compartments. We propose a model whereby repetitive cycles of DNA damage and repair at every passage ultimately lead to accumulation of genetic abnormalities with increased passage number. In contrast, CEPT promotes cytoprotective cell survival by safeguarding hPSCs against several stress mechanisms that require an integrated strategy for optimal outcome. While future studies are warranted to establish broadly accepted standards, the strong and highly reproducible optimizations, quantitatively and qualitatively, achieved here by CEPT provide a new rationale for culturing hPSCs in a safer and more efficient fashion and should help to develop advanced strategies for drug discovery, disease modeling, and personalized cellular therapies.
Methods
Cell culture
All hESCs lines (WA01, WA07, WA09, WA17, WA14, WA26, HUES53) and iPSC lines (LiPSC-GR1.1 and NCRM5 from NIH Common Fund; ESI-035, GM25256, GM23476, GM2610 from Coriell Institute for Medical Research), and JHU078i (WiCell) were maintained under feeder-free condition using Essential 8 (E8) Medium and vitronectin (VN)-coated plates (#A14700; Thermo Fisher Scientific). To maximize cell survival in low cell density and cloning experiments, StemFlex medium (Thermo Fisher Scientific) and laminin-521 (LN521; BioLamina) were used. Cells were routinely passaged using 0.5 mM EDTA diluted in phosphate buffered saline (PBS) without calcium or magnesium (Thermo Fisher Scientific) when culture plates reached ~70–90% confluency, typically every 4 to 5 days. Some of the cell expansion experiments were performed using the automated CompacT SelecT cell culture system (Sartorius). Enzymatic cell dissociation was performed using Accutase (Thermo Fisher Scientific) and cell survival was tested by administration of different chemical compounds (see below) as indicated in respective experiments. For EB formation, hPSCs were single-cell dissociated using Accutase and plated into 6-well ultra-low attachment (ULA) plates (Corning) in Essential 6 (E6) Medium (Thermo Fisher Scientific), 96-well ULA round bottom plates (Corning) and AggreWell plates (STEMCELL Technologies). For neural induction, hPSCs were treated with LDN-193189 (100 nM; Sigma-Aldrich) and A83–01 (2 μM; Tocris) in E6 Medium for 6 days. Commercially available kits were used for standardized mesoderm and endoderm induction (STEMCELL Technologies). Embryoid body formation and pluripotency assessment were performed using the TaqMan hPSC Scorecard Panel following the instructions from the manufacturer (Thermo Fisher Scientific). All karyotyping experiments were performed by Cell Line Genetics (Madison, WI). All cultures were maintained at 37°C under humidified 5% CO2 and atmospheric O2. In some cloning experiments cell survival was tested under 5% low oxygen conditions. Mycoplasma testing was performed on a regular basis (every 2 weeks) using the Mycoalert Detection Kit (Lonza).
Small molecule chemical compounds
The ROCK inhibitor Y-27632 (#1254) and Trans-ISRIB (#5284) were purchased from Tocris. Chroman 1 (#HY-15392) was purchased from MedChem Express. Emricasan (#S7775) was purchased from Selleckchem. Polyamine supplement (#P8483) and antioxidant supplement (#A1345) were purchased from Sigma-Aldrich. To prepare the CEPT cocktail the following concentrations were used: 50 nM Chroman 1, 5 μM Emricasan, Polyamine supplement diluted 1:1000 according to manufacturer’s recommendation, 0.7 μM Trans-ISRIB. The small molecule libraries used for HTS include the NCATS Pharmacologically Active Chemical Toolbox (NPACT) designed to inform on novel phenotypes, biological pathways and cellular processes; the NCATS Pharmaceutical Collection (NPC) including FDA-approved drugs; the Mechanism Interrogation PlatE (MIPE); and the commercially available libraries Tocriscreen Plus (Tocris) and LOPAC 1280 (Sigma-Aldrich). More information and details on NCATS libraries are available here: https://ncats.nih.gov/preclinical/core/compound
Cryopreservation and thawing experiments
In cryopreservation testing experiments (Fig. 5d-g), each of the five hPSC lines were frozen under three different conditions at equal cell numbers: E8 Medium + 10% DMSO + 10 μM Y-27632; E8 Medium + 10% DMSO + CEPT or mFreSR (STEMCELL Technologies). Upon thawing, triplicate wells for each of the six thawing conditions with pre-warmed E8 Medium supplemented with DMSO, 10 μM Y-27632, CEPT, RevitaCell (Thermo Fisher), CloneR (STEMCELL Technologies), and SMC4 (Biovision) were plated into VN-coated 96-well plates at a density of 50,000 cells per well. 24 hours post-plating, labeling for live/dead cells was performed by using CellTrace calcein green AM (Thermo Fisher, C34852, 1:2000) to indicate live cells and propidium iodide (Thermo Fisher, P3566, 1;2000) to indicate dead cells. Plates were imaged at 20x magnification using the IncuCyte S3 Live Cell Analysis System (Sartorius) to generate 9 images per channel for each well and quantified using the IncuCyte S3 analysis software. A total of 270 wells and 2430 images was analyzed. Percentages of live cells were determined by dividing calcein green-positive cells by total number of cells (sum of calcein green and propidium iodide-positive cells). All results described above were independently confirmed by using the CellTiter Glo assay (Perkin-Elmer).
In experiments using long-term cryopreserved cells in CEPT (Extended Data Fig. 9a), cells were processed as described above and plated into 96-well plates. hESCs and iPSCs were plated at 30.000 cell/cm2 and astrocytes were plated at 50.000 cells/cm2. For each condition, three wells were quantified for live cells as described above.
Systematic comparison of cell survival reagents across media and coating substrates
All hESC and iPSC lines (H1, H9, HUES53, LiPSC-GR1.1) were adapted to and maintained for at least 3 passages in each media tested (E8, StemFlex, (Thermo Fisher Scientific), mTeSR (STEMCELL Technologies), MEF conditioned media (MEF-CM; R&D Systems) or StemFit (AMSBIO). 384-well white flat bottom plates (Corning) were coated with VN, LN521, or Matrigel at 37 °C for 1 h. Coating media was removed and each well immediately received 30 μl of the appropriate media supplemented with DMSO (2X), CEPT (2X), Y-27632 (20 μM), CloneR (2X; STEMCELLTechnologies), RevitaCell (2X; Thermo Fisher Scientific) or SMC3/4 (2X; BioVision). Once 384-well plates were ready, cells were dissociated with Accutase, re-suspended in the appropriate medium without supplements and dispensed into the 384-well plates at 2000 cells/well (30 μl per well, resulting in a final assay volume of 60 μl in each well and a final concentration of 1X for each supplement). After 24 h, 30 μl CTG was dispensed into each well and luminescence signals were read using the ViewLux μHTS microplate imager (Perkin-Elmer). All plates were prepared in six replicates to compensate for cell dispensing variation (see Supplementary Fig. 3).
Quantitative high-throughput screening (qHTS)
qHTS was performed on the Kalypsys robotic system (see Supplementary Fig. 1c). For screening in 1536-well format, plates with white flat bottom (Corning) were coated with VN diluted in E8 Medium (2 μl per well) at 37 °C for 1 h and received 23 nl small molecule compounds in DMSO transferred from the compound library source plates by a pintool. Once 1536-well plates were ready, hESCs (WA09) were dissociated with Accutase, re-suspended in E8 Medium and dispensed into the 1536-well plates at 500 cells/well (3 μl per well, resulting in a final assay volume of 5 μl in each well). After 24 h, 2 μl CTG was dispensed into each well and luminescence signals were read using the ViewLux μHTS microplate imager (Perkin-Elmer). After normalizing all CTG values with that of 10 μM Y-27632 (positive control representing 100%; DMSO as negative control), we set a threshold of 20% for individually tested compounds and identified 113 primary hits (Supplementary Fig. 2a and Supplementary Table 1). These hits revealed a wide variety of dose–response curves that could be classified14 into curve classes 1.1 (21 hits), 1.2 (4 hits), 2.1 (3 hits) and 2.2 (10 hits) (Supplementary Fig. 2b,c). When the cell viability assay was carried out at ultra-low cell density (10 cells/well) in 1536-well plates, hESCs were plated on LN521 and cultured in StemFlex medium to avoid daily media change. Dissociated cells were dispensed in the presence of Chroman 1 and Emricasan, and NPACT and kinase inhibitor libraries were tested at a single concentration, the second highest concentration in the libraries, in the primary screen. All plates were prepared in triplicates to compensate for cell dispensing variation. After ranking all compounds by their median CTG reading, 316 compounds were chosen for follow-up screens. In the follow-up screens, all compounds were tested at 7 different concentrations to generate dose-response curves and 6 replicates were used to compensate for cell dispensing variation.
Combinatorial small molecule matrix screening
Cell viability assay was performed as described above (qHTS section), except that compound combinations were spotted using the Echo 550 acoustic dispenser (Labcyte). Dose matrices were prepared in 10 × 10 checkerboard formats, in which the two single agents were spotted in the last row and the last column, respectively. Example matrices are shown in Extended Data Fig. 2a-d.
HotSpot kinase inhibitor profiling
HotSpot kinase assays were performed by Reaction Biology (Malvern, PA) for IC50 determination for Y-27632 and Chroman 1 towards their primary targets (ROCK1, ROCK2). Human kinase profiling against a panel of 369 human wild-type kinases was also carried out by Reaction Biology (Extended Data Fig. 1a,b).
Live and dead cell assays
Simultaneous staining with CellTrace calcein green AM (Thermo Fisher Scientific, C34852, 1:2000) to indicate intracellular esterase activity and red fluorescent propidium iodide (Thermo Fisher Scientific, P3566, 1:2000) to indicate loss of plasma membrane integrity allowed quick discrimination between live and dead cells. Caspase-3/7 activation in live cells was monitored using CellEvent Caspase-3/7 Green Detection Reagent (Thermo Fisher Scientific, C10423, 1:1000) in IncuCyte Zoom Live Cell Analysis System (Sartorius). Cells were plated at a density of 106 cells/well in 6-well plates, treated with indicated compounds and imaged with a 10x objective. The CellTiter-Glo and CellTiter-Glo 3D assays (Promega, G9241, G9681) were carried out following the manufacturer’s instructions to quantify cell viability in adherent and EB cultures, respectively. Luminescence signal was read using the ViewLux μHTS microplate imager (Perkin Elmer).
Western blotting
The Wes automated Western blotting system (Protein Simple) was used for quantitative analysis of protein expression and protein phosphorylation following the manufacturer’s instructions and all Western blot data are displayed by lanes in virtual blot-like images. Briefly, cell lysate and reagents were loaded into assay plates and placed into the Wes system. Cell lysates were loaded into the capillary automatically and separated by size as they migrate through a stacking and separation matrix. After the separated proteins were immobilized to the capillary wall, target proteins were identified using primary antibodies and immuno-probed using HRP-conjugated secondary antibodies and the chemiluminescent substrate. The resulting chemiluminescent signal was detected by an integrated detection camera and quantitated using the Compass software. Primary antibodies used are as follows: Caspase-3 (Cell Signaling Technologies (CST), 9665, 1:50), cleaved/active Caspase-3 (CST, 9664, 1:50), GAPDH (Santa Cruz, sc25778, 1:2000), GFP (Chromotek, 3H9, 1:50), Lamin B1 (Abcam, 16048, 1:50), OCT4 (Santa Cruz, sc9081, 1:50), Brachyury (CST, 81694, 1:50), SOX17(Abcam, 84990, 1:50), PAX6 (Biolegend, 901301, 1:50), phospho-CHK2 (CST, 2197T, 1:50), H2AX (CST, 9718S, 1:50), phospho-eIF2A (Novus, NBP2–67353, 1:50), anti-puromycin (Millipore, MABE343, 1:50), tubulin (Novus, NB600–936SS, 1:500), tight junction protein 1 (Novus Biologicals, NBP1–85047, 1:20), E-Cadherin (Novus Biologicals, MAB1838, 1:100), Annexin A1 (R&D, MAP37701, 1:100), and Paxillin (Novus Biologicals, AF4259, 1:4).
Protein translation assay
To monitor protein synthesis, we used a modified version of a previously described nonradioactive method 47. Briefly, pluripotent cells were dissociated with Accutase for 10 min at 37°C. To ensure single-cell dissociation, the cell suspension was gently pipetted up and down 4 times and washed with PBS. Cells were then pelleted, resuspended, and seeded onto VN-coated plates (25,000 cells/cm2) in E8 Medium containing DMSO, Y-27632, or CEPT. Cells were allowed to adhere for 2 h and then pulsed with 1 μM puromycin for 50–60 min. Subsequently, cells were harvested using a cell scraper, pelleted, washed with PBS, flash-frozen and stored at −20°C. Cell pellets were lysed by sonication in RIPA lysis buffer (Thermo Fisher Scientific) supplemented with Halt protease inhibitor cocktail (Thermo Fisher Scientific) and centrifuged at 14,000g for 15 min. Protein translation was analyzed on the Wes automated Western blotting system (ProteinSimple) using anti-puromycin antibody (1:50; Sigma-Aldrich, MABE343).
Pluripotency quantification of CEPT-passaged hESCs and iPSCs
Various hESC and iPSC lines were dissociated with EDTA for 5 min at 37°C and passaged onto VN-coated plates in E8 Medium containing CEPT up to 44 times. On the last passage, cells were fixed with 4% PFA and stained with anti-OCT4 (Santa Cruz, sc9081, 1:500), SOX2 (Millipore-Sigma, AB5603, 1:500), NANOG (CST, 4903, 1:50), followed by labelling with Alexa-Fluor 488 (Thermo Fisher Scientific, A-21202, 1:500) and Alexa-Fluor 568 (Thermo Fisher Scientific, A10042, 1:500) conjugated secondary antibodies. Additionally, cells were also stained with alkaline phosphatase stain II (Stemgent). Quantification of labeled cells was done using the method B algorithm of the Columbus image analysis system (Perkin-Elmer).
Immunocytochemistry
Cells were fixed with 4% PFA for 30 minutes, permeabilized and blocked with 0.3% Triton X-100 and 5% BSA in PBS for 1 h. Rabbit anti-PAX6 antibody (Biolegend, 901301, 1:200), rabbit anti-brachyury antibody (CST, 81694, 1:200) and rabbit anti-SOX17 antibody (Abcam, 84990, 1:200) were used to stain ectoderm, mesoderm and endoderm progenitor cells. To stain cytoskeletal components, pluripotency and DNA damage markers, rabbit anti-MYH10 (Millipore-Sigma, ABT1340, 1:200), mouse anti-OCT3/4 human isoform A (BD Biosciences, 561628, 1:40) and rabbit anti-Phospho-Histone H2A.X (CST, 9718S, 1:250) were used. Primary antibody staining was followed by labeling with goat anti-mouse Alexa Fluor 488 (115–546-068, 1:400), donkey anti-rabbit Alexa Fluor 488 (711–545-152, 1:400), and donkey anti-rabbit Rhodamine (711–025-152, 1:600), goat anti-rabbit Alexa Fluor 647 (111–606-144, 1:400) conjugated secondary antibodies from Jackson ImmunoResearch Laboratories and Hoechst 33342 (Thermo Fisher Scientific, H3570, 1:2000). Actin was visualized by staining with Alexa Fluor 488-conjugated phalloidin (Thermo Fisher Scientific, A12379, 1:40, methanol stock solution prepared according to the manufacturer’s instructions). Fluorescence images were taken with the Leica DMi8 epifluorescence and Zeiss LSM 710 confocal microscopes using appropriate filters.
Live-cell imaging of TJP1 (ZO-1) reporter cell line
A reporter cell line with a monoallelic mEGFP fluorescent tag of the TJP1 gene (AICS-0023 clone 20) was obtained from the Allen Institute for Cell Science. Fluorescent images were taken with the Zeiss LSM 710 confocal microscope.
Ultra-low cell density assay
hPSCs were single-cell dissociated with Accutase (Thermo Fisher Scientific) and seeded into 6-well plates at a density of 25 cells/cm2. StemFlex medium and LN521 coating was used to enhance cell survival. Compounds were applied for 72 hours. On day 6 after plating, hPSC colonies were stained for alkaline phosphatase and calcein green-AM to quantify cell confluency as a measure for cell survival and growth using the INCell Analyzer 2200 (GE Healthcare) with 2x objective to image entire wells. Local threshold algorithm was applied to segment live cells from the background.
Single-cell cloning using flow cytometry
Human PSCs were single-cell dissociated with TrypLE or Accutase, filtered through 40 μm-cell strainers and sorted into VN-coated 96-well plates using BD FACSAria Fusion flow cytometer (BD Biosciences). Stringent gating strategy was implemented in both side scatter (SSC) and forward scatter (FSC) gates to exclude doublets. StemFlex medium was used to improve hPSC clonal formation by minimizing perturbation due to media change. Tested compounds were applied for the first 72 h following FACS sorting. On day 9 after plating, hPSC clones were stained with calcein green AM and imaged using the INCell Analyzer 2200 (GE Healthcare) with 2x objective. Local threshold algorithm was applied to identify clones. In some single-cell cloning experiments the effect of 5% low oxygen at 37°C was tested in tri-gas CO2 incubators.
Microfluidic single-cell cloning with Hana
Prior to dissociation hESCs (WA09) were stained with calcein-green AM (Thermo Fisher Scientific, C34852, 1:50,000) for 1h. Cells were then dissociated with Accutase (Thermo Fisher Scientific) for 10 min at 37°C. To ensure single-cell dissociation, the cell suspension was gently pipetted up and down 4 times and washed with PBS. Cells were pelleted, resuspended in StemFlex medium containing DMSO, Y-27632, or CEPT and filtered through 15 μm-cell strainers (pluriSelect). Cells were counted and resuspended at 5,000 cells/ml and loaded onto a microfluidic chip (Namocell). Single cells were dispensed using the Hana microfluidic single-cell dispenser (Namocell) onto LN521-coated 96-well plates containing StemFlex medium supplemented with DMSO, Y-27632, or CEPT. Side scatter, forward scatter and FITC gates were set to 25–400, 50–450 and 25–1000, respectively, to exclude doublets and ensure only live calcein green AM-positive cells were dispensed. The presence of single cells was confirmed using a Leica DMi8 microscope or IncuCyte Zoom system (Sartorius). Three days after single cells were dispensed a daily half-media change with StemFlex media was performed until day 10 post plating. On day 10, cells were stained with alkaline phosphatase (AP) stain II (Stemgent) and the number of wells with AP positive colonies were counted.
Image-based single-cell cloning with Cytena
Single-cell dispensing with Cytena was conducted following the manufacturer’s instruction. Briefly, hESCs and iPSCs were dissociated with Accutase and resuspended in StemFlex medium containing Y-27632 or CEPT. After filtered through 35-μm-mesh filters into polystyrene round-bottomed tubes, cell suspension was loaded into the dispensing cartridge to generate droplets. When the droplet contained only one cell, it was dispensed into the well. When the droplet contained no cell or multiple cells, it was taken off by the vacuum into the waste. A total of 5 images were recorded for each droplet that was dispensed, including 3 images taken prior to deposit, 1 at deposit, and 1 post deposit in order to document the stringent deposition of single cells.
Electroporation experiments
Electroporation experiments were carried out using the NEON Transfection system (Thermo Fisher) following the instructions of the manufacturer. Briefly, dissociated cells were resuspended in 100 μl Resuspension Buffer R containing 54 pmole of gRNA, 54 pmole of recombinant Cas9 and 450 pmole of single-stranded oligodeoxynucleotides and then electroporated using 100 μl-pipette tips (1200 V, 20 ms, 1 pulse). Electroporated cells were divided into three groups and seeded into VN-coated 24-well plates containing media supplemented with DMSO, 10 μM Y-27632 or CEPT. For the control group, dissociated cells were prepared as described above, but not subjected to electroporation. Microscopic images were captured in the IncuCyte system at 24 h after electroporation. Cell viability was measured using CellTiter-Glo assay (Perkin-Elmer) and ViewLux microplate reader (Perkin-Elmer).
Clonal cell line generation following gene editing
Gene editing with CRISPR/Cas9 was carried out following the protocol developed by the Allen Institute for Cell Science with some modifications. The parental iPSC line GM25256 was purchased from Coriell. The donor plasmid to insert mEGFP into the N-terminus of lamin B1 was purchased from Addgene (#87422). TrueCut Cas9 protein v2 and TrueGuide 1-piece modified synthetic gRNA (GGGGTCGCAGTCGCCATGGC) were purchased from Thermo Fisher Scientific. iPSCs (GM25256) were dissociated into single cells using TrypLE and a cell pellet of 8 × 10⁵ cells was resuspended in 100 μl Neon Buffer R with 2 μg donor plasmid, 2 μg Cas9 protein, and sgRNA in a 1:1 M ratio to Cas9. Before addition to the cell suspension, the Cas9/sgRNA RNP was precomplexed for a minimum of 10 min at room temperature. Electroporation was with one pulse at 1300 V for 30 ms. Cells were then immediately plated onto LN521-coated 6-well dishes with StemFlex medium and CEPT was applied for the initial 24 h after plating. When transfected cells had recovered to ∼70% confluence (usually after 3–4 d), cells were harvested for FACS using TrypLE. The cell suspension (1.0 × 10⁶ cells/ml in StemFlex with CEPT) was filtered through a 35-μm mesh filter into polystyrene round-bottomed tubes. Cells were sorted using a FACSAriaIII Fusion (BD Biosciences) with a 100-μm nozzle and FACSDiva v9.0 software (BD Biosciences). Forward scatter and side scatter (height vs. width) were used to exclude doublets. Single cells were deposited into LN521-coated 96-well plates that were filled with CEPT-containing StemFlex medium. Half medium changes were performed with StemFlex medium (without CEPT) on day 3, day 6 and day 9 after FACS sorting. Most single-cell derived clones were transferred to 6-well plates for continued culture and further analysis on day 12.
Genetic screening with ddPCR
Genetic screening using droplet digital PCR (ddPCR) was performed following a previously published protocol36. Briefly, ddPCR was carried out using the Bio-Rad QX200 Droplet Reader, Droplet Generator, and QuantaSoft software (Bio-Rad). The reference assay for the two-copy, autosomal gene RPP30 was purchased from Bio-Rad (assay ID dHsaCP1000485, cat. no. 10031243). The hydrolysis probe–based PCR amplifications targeted to GFP (insert) and AMP (backbone) are as follows: GFP, primers (5′-GCCGACAAGCAGAAGAACG-3′, 5′-GGGTGTTCTGCTGGTAGTGG-3′) and hydrolysis probe (/56-FAM/AGATCCGCC/ZEN/ACAACATCGAGG/3IABkFQ/); AMP, primers (5′-TTTCCGTGTCGCCCTTATTCC-3′, 5′-ATGTAACCCACTCGTGCACCC-3′) and hydrolysis probe (/5HEX/TGGGTGAGC/ZEN/ AAAAACAGGAAGGC/3IABkFQ/). The GFP assay was run in duplex with the AMP assay as well as the genomic reference RPP30-HEX. The ratios of (GFP copies/μl)/(RPP30 copies/μl) were plotted against (AMP copies/μl)/(RPP30 copies/μl) to identify cohorts of clones for ongoing analysis.
Genetic analysis with junctional PCR and Sanger sequencing
A single PCR reaction was used to amplify both the edited and wild-type allele of lamin B1 (forward primer: CTCGTCTTGCATTTTCCCGC, reverse primer: GACCGAGACCCTGTTCCTTC). PCR reactions were prepared using Q5 High-Fidelity 2x Master Mix (New England BioLabs, Ipswich, MA) and 10 ng genomic DNA in a final volume of 25 μl. Cycling conditions were as follows: 98°C for 30 s; (98°C for 10 s, 65°C for 30 s, 72°C for 60 s) × 40 cycles; 72°C for 10 min. PCR amplicons were analyzed by Sanger sequencing (Genewiz, NJ, USA) following agarose electrophoresis and gel purification.
Whole exome sequencing
Pluripotent cells were collected by scraping and genomic DNA was extracted using the column-based DNeasy Blood and Tissue Kit (Qiagen) according to the manufacturer’s guidelines. DNA 260/280 ratios were assessed by Nanodrop. Whole-exome sequencing (WES) comprised three passaging timepoints (P) for H9 hESC and Lonza iPSC cell lines independently for a total of six samples: hESC P26 without CEPT, hESC P36 with CEPT, hESC P46 with CEPT, iPSC P31 without CEPT, iPSC P41 with CEPT, and iPSC P51 with CEPT. Analysis was as follows and pipeline code, including details of QC filters, is also available at the aforementioned Github repository. The Burrows-Wheeler Aligner (BWA) aligned samples to the hg38 reference genome, samples were sorted with Samtools, and the Genome Analysis Toolkit (GATK) Best Practices were followed for germline short variant discovery (GATK version 3.8–1; Broad Institute; https://software.broadinstitute.org/gatk/best-practices). Annotation of SNPs and indels was done in ANNOVAR version 2018–06-16 for the following databases: hg38 RefSeq Gene, dbSNP150, 1000 Genomes Project August 2015 release (TGP), The Exome Aggregation Consortium (ExAC) version 0.3, Catalogue of Somatic Mutations in Cancer (COSMIC) 70, ljb26 (for SNPs only, containing whole-exome SIFT and PolyPhen2 HDIV), and ClinVar July 2015 release.
Annotation filtration and statistical testing was done in R. Variants were searched for damaging mosaic mutations34, cancer hotspots26, and TP53 specifically. The mosaic mutation positions were converted to hg38 positions with UCSC Genome Browser LiftOver tool. Pearson correlations were computed with 95% confidence intervals and Kruskal-Wallis rank sum tests were done on the variables: passage number (0, 10, 20), sample genotype (noncarrier, heterozygous carrier, or homozygous carrier), cell line (hESC or iPSC), TGP global population frequency, COSMIC presence or absence, and PolyPhen2 predicted effect. Rarity was defined as TGP <= 0.05 or unknown frequency. For indels, ClinVar predicted effect was included instead of PolyPhen2, which is unavailable for such variants. Pearson correlations were calculated using R from the base stats package and plotting was done with the corrplot package.
Cellular reprogramming and iPSC line generation
Human fibroblasts from three apparently healthy individuals (GM00038, GM08680, GM05756) were purchased from Coriell. Reprogramming was performed using the CytoTune-iPS 2.0 Sendai reprogramming kit according to the manufacturer’s instructions (Thermo Fisher Scientific). Briefly, fibroblasts were plated at 20,000 cells/cm2 and cultured until they were 30–60% confluent. Cells were transduced with the Sendai reprogramming vectors at an MOI of 5:5:3 (KOS:hc-Myc:hKlf4). Cells were maintained in fibroblast media until passaged onto VN-coated plates on day 7. On day 8, medium was changed to E8 Medium and cells were cultured for additional 20 days. On day 28, colonies were picked using a 25-gauge needle to cut single colonies into 6–8 pieces and transferred onto VN-coated plates containing E8 Medium only or supplemented with Y-27632 or CEPT for 48 h. After 48 h, cells were kept in E8 Medium only. Confluency was assessed 8 days after colony picking using the Celigo Imaging Cytometer (Nexcelom Biosciences).
Viability analysis of cryopreserved hPSCs and differentiated cells
Commercially available iPSC-derived human cardiomyocytes (cat. R1017), hepatocytes (cat. R1027), and motor neurons (cat. R1051) were purchased from FUJIFILM Cellular Dynamics International (Madison, WI, USA). Instructions of the manufacturer were followed for thawing, media preparation, coating of culture plates, and cell plating density. Astrocytes were generated using an unpublished NCATS protocol generating iPSC-derived astrocytes at high efficiency in the absence of animal serum (Vukasin et al., in preparation; poster presented at ISSCR Meeting 2020). Cells were counted using Cellometer Auto 2000 (Nexcelom Biosciences) and plated using recommended media containing DMSO, Y-27632 or CEPT. Cell survival was measured by CTG and CellEvent Caspase-3/7 Green Detection Reagent was used to monitor apoptosis 24 h after thawing.
Multi-electrode array experiments
Cardiomyocyte and motor neuron activity was analyzed using the Maestro multi-electrode array system (Axion Biosystems) according to the manufacturer’s protocol. Briefly, cardiomyocytes were thawed in a 37°C bead bath for 4 min, followed by addition of 9 ml of room temperature cardiomyocyte plating media containing DMSO, Y-27632 or CEPT and mixed gently. Cardiomyocytes were plated at a density of ~63,000 cardiomyocytes/cm2. Forty-eight hours post-plating media was replaced with the appropriate volume of cardiomyocyte maintenance media without DMSO, Y-27632 or CEPT. Motor neurons were thawed in a 37°C bead bath for 2.5 min, followed by addition of 9 ml of room temperature complete maintenance media, pelleted and resuspended in room temperature complete maintenance media containing DMSO, Y-27632 or CEPT and mixed gently. Motor neurons were plated at a density of 5 million neurons/cm2 in complete media containing 10 μg/ml laminin. Twenty-four hours post-plating motor neuron maintenance media was replaced with maintenance media without DMSO, Y-27632 or CEPT and a 50% media exchange was performed every 2–3 days. Recordings were acquired on day 7 and 14 post-plating. For cardiomyocytes MEA plates were coated with 8 μl of 50 μg/ml fibronectin over the electrode recording area. For motor neuron experiments, MEA plates were coated with 0.1% polyethyleneimine (PEI).
Single-EB differentiation assay
Individual EBs were generated in 96-well ULA plates with 20,000 cells plated in each well and cultured in E6 Medium for 7 days to allow for spontaneous differentiation. On day 7, mRNA from individual EBs was extracted using TurboCapture 96 mRNA kit (Qiagen), reverse-transcribed into cDNA using Sensiscript RT kit (Qiagen), and pre-amplified using TaqMan PreAmp Master Mix (Thermo Fisher Scientific) and TaqMan probes for PAX6 (Hs01088114), Brachyury (Hs00610080) and SOX17 (Hs00751752), followed by qPCR quantification of PAX6, Brachyury, and SOX17. Cell number variation among EBs was normalized with the quantity of actin transcripts (Hs01060665).
Generation of cerebral organoids
Cerebral organoids were generated using a commercial kit (STEMdiff Cerebral Organoid Kit, STEMCELL Technologies, #08570), which has been adopted and optimized based on previously published protocol38. In brief, iPSCs (LiPSC-GR1.1) were detached using Accutase (Thermo Fisher Scientific) and plated in 96-well ULA round bottom plates (Corning) at a density of 9000 cells per well in 100 μl of Embryoid Body Formation Medium (STEMdiff Cerebral organoid Kit, STEM CELL Technologies) with either addition of 10 μM Y-27632 or CEPT cocktail. Additional 100 μL of Embryoid Body Formation Medium was added every other day for 5 days. At day 5, or typically when embryoid bodies (EBs) reached between 400–600 μm in diameter with round and smooth edges, each embryoid body was transfer into each well of 24-well ultra-low attachment plate (Corning) in 0.5 ml of Neural Induction Medium (STEMdiff Cerebral organoid Kit). 48 hours after transfer, or when neuroepithelium emerged, each organoid was embedded in 15 μl droplet of Matrigel (Corning) and transferred into 6-well ultra-low attachment plate (Corning) in Neural Expansion Medium (STEMdiff Cerebral organoid Kit). After 3 d, the media was changed to Neural Maturation Medium (STEMdiff Cerebral organoid Kit). Media was changed every 3 days.
Generation of kidney organoids
Kidney organoids were generated using a commercial kit (STEMdiff Kidney Organoid Kit, STEMCELL Technologies, #05160). In brief, on day −3 hESCs (WA09) previously maintained in mTeSR1 were detached using Accutase (Thermo Fisher Scientific) and plated in Matrigel (Corning) coated 96-well μ-plates (Ibidi) at densities of 250 – 1000 cells per well in 200 ml of mTeSR1 (STEMCELL Technologies) with either addition of 10 μM Y-27632 or CEPT cocktail. On day −2, media was removed, and cells were overlayed with 100 ml of cold mTeSR1 supplemented with Matrigel. On day −1, a full media change with 100 ml of mTeSR1 was performed. On day 0, media was replaced with 100 ml Stage 1 Medium (STEMdiff Kidney organoid Kit) On day 1.5, media was replaced with 100 ml Stage 2 Medium (STEMdiff Kidney organoid Kit). From days 4 – 18 Stage 2 Medium was replaced every 2–3 days. On day 18, cells were fixed with 4% PFA for 15 min, permeabilized with PBS for 15 min and blocked with PBS and 10% Donkey Serum (Sigma, D9663) in PBS for 1 h. Goat anti-Podocalyxin antibody (R&D Systems, AF1658, 1:100), mouse anti-E-Cadherin antibody (BD Biosciences, 610182, 1:100) and Lotus Tetragonolobus Lectin - Fluorescein (Vector Laboratories, FL-1321–2, 1:200) were used to stain kidney organoids. Primary antibody staining was followed by labeling with donkey anti-goat Alexa Fluor 594 (705–585-147, 1:400) and donkey anti-mouse Alexa Fluor 647 (715–605-151, 1:1000) conjugated secondary antibodies from Jackson ImmunoResearch Laboratories. Fluorescence images were taken with the Zeiss LSM 710 confocal microscope using appropriate filters.
Histology, immunohistochemistry, and RNA-seq of cerebral organoids
Organoids were fixed in 4% PFA at room temperature for 20 min and washed with PBS three times before immersion in 30% sucrose at 4°C overnight. The tissues were embedded in O.C.T. compound (Fisher Scientific), cut into 20-μm sections, and mounted on microscope slides (Fisher Scientific) for staining. For histological analysis, sections were stained for hematoxylin/eosin followed by dehydration in ethanol and xylene and mounting in Permount mounting media (Fisher Scientific). For immunohistochemical analysis, sections were permeabilized and blocked with 0.3% Triton X-100 and 5% BSA in PBS for 1 h. Mouse anti-TUJ1 (Biolegend, 801202, 1:200), rabbit anti-SOX2 (Abcam, AB5603, 1:100), and rabbit anti-FOXG1 (Abcam, AB18259, 1: 1000) were used, followed by labelling with Alexa-Fluor 488 (Thermo Fisher Scientific, A-21202, 1:500) and Alexa-Fluor 568 (Thermo Fisher Scientific, A10042, 1:500) conjugated secondary antibodies and mounting with ProLong™ Glass Antifade Mountant with NucBlue™ Stain (Thermo Fisher Scientific). Fluorescence images were taken with the Leica DMi8 microscope using appropriate filters.
RNA was extracted (three samples for each group, each consisting of three organoids) using the RNeasy Mini Kit (Qiagen). RNA was quantified using the Agilent RNA 600 Kit (Agilent) on a BioAnalyzer 2100 (Agilent). RNA (500 ng, RIN >8 was used to prepare RNA-seq libraries with the TruSeq Stranded mRNA Library Prep Kit (Illumina) according to the manufacturer’s protocol. Sequencing libraries were quantified by PCR using the KAPA library quantification kit for Illumina platforms (KAPA Biosystems) using QuantStudio 12K Flex Real-Time PCR System (Thermo Fisher Scientific). All samples were normalized according to concentration and pooled. Libraries were loaded and sequenced using the Illumina NextSeq 500 system.
RNA-Seq analysis
Bioinformatics analysis for bulk RNA-Seq was carried out using the computational resources of the NIH HPC Biowulf cluster (http://hpc.nih.gov) using R language 3.6.0 (https://cran.r-project.org/). Samples were quality trimmed using Trimmomatic 0.36 and the TruSeq3 paired-end adapters. STAR aligner 2.7.6a followed by HTSeq-count 0.9.1 produced deduplicated counts of reads in genes. Counts were imported into DESeq2 1.24.0. UCSC gene counts were normalized using the default median-of-ratios method. Differential expression tests used the lfcShrink function and gene set enrichment used package enrichR 1.0. For details see Data and Code Availability.
Etoposide sensitivity assay
Human iPSCs were dissociated with EDTA for 5 min at 37°C and passaged onto VN-coated plates in E8 medium containing CEPT. Cells were allowed to adhere overnight, followed by a complete E8 Medium change 12 h post passaging and daily until 72 h post passaging. At 72 h post passaging, cells were pretreated with or without CEPT for 1h, followed by 3h etoposide treatment at 340 μM in the presence or absence of CEPT. After etoposide treatment, cells were harvested using a cell scraper, pelleted, washed with PBS, flash-frozen and stored at −20°C. Cell pellets were lysed by sonication in RIPA lysis buffer (Thermo Fisher Scientific) supplemented with Halt protease inhibitor cocktail (Thermo Fisher Scientific) and centrifuged at 14,000g for 15 min. Etoposide sensitivity was analyzed on the Wes automated Western blotting system (ProteinSimple) using anti-phospho-γH2AX (CST, 9718, 1:50), phospho-BRCA1 (CST, 9009, 1:100), phospho-CHK2 (CST, 2197, 1:50), p21 (CST, 2947, 1:100), phospho-P53 (CST, 9284, 1:50), p53 (Santa Cruz, sc263, 1:50) and H2AX (CST, 2595, 1:50) antibodies.
Comet assay
hPSCs were subjected to neutral comet assays and performed according to the manufacturer’s protocol (Trevigen, #4260–096). Cells were dissociated with Accutase for 10 min at 37°C. To ensure single-cell dissociation, the cell suspension was gently pipetted up and down washed four times with PBS. Cells were then pelleted, resuspended, filtered through 15-μm cell strainer and seeded onto the 96-well Comet chip (5,000 cells/well) containing E8 Medium supplemented with DMSO, Y-27632, CloneR (STEMCELL Technologies), RevitaCell (Thermo Fisher Scientific), SMC4 (BioVision) or CEPT. Cells were allowed to settle and were incubated for 6 h. Subsequently, the 96-well comet chip was rinsed, overlayed with LMAgarose (Trevigen) and allowed to set for 3 min. Comet chip was placed in a lysis solution for 2 h at 4°C, equilibrated in neutral solution and subjected to electrophoresis at 4°C for 50 min at 22 V in neutral solution. Comet chip was stained overnight at 4°C in 0.2X SYBR Gold (Thermo Fisher Scientific). Comets were visualized using a Leica DMi5 microscope using the appropriate filters. Comets were analyzed using the Comet Analysis Software 1.3d (Trevigen).
Impedance analysis
Prior to cell plating, CytoView-Z 96-well plates (Axion Biosystems) were coated with VN at 5 μg per cm2 and incubated overnight at 37°C. After coating, VN solution was removed and 100 μl of E8 Medium supplemented 2X as indicated was added to each well. The plate was docked onto the Maestro Z (Axion Biosystems) to measure impedance electrode baseline. Cells were dissociated with Accutase for 10 min, pelleted and resuspended in E8 Medium at 100,000 cells per ml. 100 μl of cell suspension was added to each well (10,000 cells/well) of the coated CytoView-Z plates and left at room temperature for 1 h to ensure even coverage of the well. All wells contained a total of 200 μl of E8 Medium supplemented as indicated at a final concentration of 1X. Plates containing cells were docked onto the Maestro Z at 37°C and 5% CO2. Resistance was measured at 10 kHz for up to 36 h.
Time-lapse video microscopy
Live-cell imaging was performed at 37°C and humidified 5% CO2 atmosphere using IncuCyte Zoom systems (Sartorius).
Statistics and Reproducibility
Results are shown as mean ± s.d. or mean ± s.e.m. as indicated in Figure legends. In box plots presented in Fig. 3a and Extended Data Fig. 3b, the center line in each box is the median activity. The lower and upper box hinges correspond to the first and third quartiles, and the whiskers extend from upper or lower hinges to 1.5-fold inter-quartile range. Statistical tests included unpaired, two-tailed Student’s t-tests and one-way analysis of variance (ANOVA) for multiple comparisons were conducted using GraphPad Prism 9.0.0. Exact P-values are provided in the figure legends where P-values are equal or larger than 0.0001.
Fig. 2b, c, d, and h are representative of three independent experiments. Fig. 3e is representative of three independent experiments. Fig. 3k is representative of multiple single-cell cloning events recorded in one experiment. Fig. 4a, b, d, g, and h are representative of three independent experiments. Fig. 6a, b, c, d, e, f, g, and j are representative of three independent experiments. Extended Data Fig. 1c and 2e were performed once. Extended Data Fig. 4a, c, and d were performed once. Extended Data Fig. 5a, b, c, and d were performed once. Extended Data Fig. 6g is representative of multiple events recorded in one experiment. Extended Data Fig. 7b, e, f, h, j, and k were performed once. Extended Data Fig. 8b are representative of three independent experiments. Extended Data Fig. 10a, b, c, e, f, and g are representative of three independent experiments.
Data and code availability
Extended results of small molecule screening associated with Figs. 1, 2, 3 and Extended Data Figs. 2, 3, and Supplementary Information Figs. 1,2 are available at the following link: https://tripod.nih.gov/matrix-client/?project=2621.
Whole-exome and RNA sequencing files have been deposited to the Sequence Read Archive under BioProject PRJNA552890, https://www.ncbi.nlm.nih.gov/sra/?term=PRJNA552890. An interactive RShiny app is available to browse the RNA-Seq at https://ipsceq.ncats.io. Sequencing data analysis code is available at https://github.com/cemalley/Chen_methods. ANNOVAR and annotation databases are available for download at https://annovar.openbioinformatics.org/en/latest/user-guide/download/.
Extended Data
Extended Data Fig. 1: Target specificity and cell passaging with Chroman 1.

a, HotSpot kinase profiling was used to individually inhibit a panel of 369 human wild-type kinases using 50 nM Chroman 1 or 10 μM Y-27632 (concentrations were chosen based on dose-response curves and maximum cell survival in the primary screen). Note the significant differences among these two ROCK inhibitors revealing that Chroman 1 is more potent and has fewer off-targets than Y-27632.
b, Table summarizing the inhibitory activity of 50 nM Chroman 1 and 10 μM Y-27632 as determined by HotSpot kinase profiling shown in panel (a). Green portion of the table shows values for ROCK1 and ROCK2 as the primary targets, red portion indicates all off-target kinases that Y-27632 inhibits more strongly than Chroman 1. These include PKCeta (also known as PKCη or PRKCH), PKCepsilon (also known as PKCε or PRKCE), PKCdelta (also known as PKCδ or PRKCD), PKN1, PKN2 and PRKX. Two negligible off-target kinases that Chroman 1 inhibits relatively better than Y-27632 are LATS2 (15.32%) and DMPK2 (16.44%) (blue portion). Note that only values under 10% represent significant inhibitory activity according to ref. 16.
c, hESCs (WA09) maintained pluripotency and multilineage differentiation potential after serial passaging with Chroman 1 for 40 passages. Scale bar, 2.5 μm.
Extended Data Fig. 2: Synergy score examples and long-term culture in C+E.

a-d, Checkerboard examples from the matrix screening data. The 10 × 10 viability matrices (a,c) and the delta HSA value matrices (b,d) for the combination of Chroman 1 + Emricasan (a,b), and Chroman 1 + Blebbistatin (c,d). Chroman 1 + Emricasan enhanced the maximum survival compared to either Chroman 1 or Emricasan alone, which indicates synergistic activity. In contrast, Chroman 1 + Blebbistatin failed to further improve cell survival. Yellow boxes highlight the maximum survival and synergy level achieved by the combinations.
e,f, hESCs (WA09) were serially passaged for a total of 40 passages with C+E applied for the initial 24 h during every passage. Cells expressed pluripotent genes including NANOG and OCT4, and differentiated into ectoderm (PAX6), mesoderm (Brachyury) and endoderm (SOX17) lineages both by directed differentiation in adherent cultures (e) and spontaneous differentiation in EB cultures followed by Scorecard analysis (f). Scale bar, 2.5 μm.
Extended Data Fig. 3: Assay development for ultra-low cell density HTS.

a, hESCs (WA09) were single-cell dissociated with Accutase and dispensed into 1536-well plates at the indicated cell densities. Two plates were prepared for each seeding density. CTG reading was carried out with one plate immediately following cell dispensing (read 1) and with the second plate 24 h later (read 2). CTG-fold change was calculated as read 2 divided by read 1 to indicate cell recovery and growth within 24 h. Note the biphasic relationship between cell seeding density and the CTG-fold change, indicating that both high cell density (2000 cells/well) and ultra-low cell density (< 50 cells/well) impeded cell survival.
b, Assay development for hESCs (WA09) in 1536-well format to model the stress that is associated with ultra-low cell density on cell survival. Fewer than 50 cells per well was determined as ultra-low cell density (n = 128 wells for the density of 0 and 5; n = 256 wells for the density of 50, 100, 500, and 2000).
c, Summary of qHTS performed at ultra-low cell density (10 cells/well) that identified 316 hits showing synergy with C+E (see Supplementary Table 2 for details). All compounds were used in combination with C+E, tested in triplicates, and ranked based on their median CTG readings. Data were normalized to the average CTG reading obtained with C+E.
d, Example dose-response curves of Trans-ISRIB, Isotretinoin, and Y-27632. Data represent median ± s.d. (n = 6 wells for each concentrations of all groups).
Extended Data Fig. 4: Characterization of hPSC lines after long-term culture with CEPT.
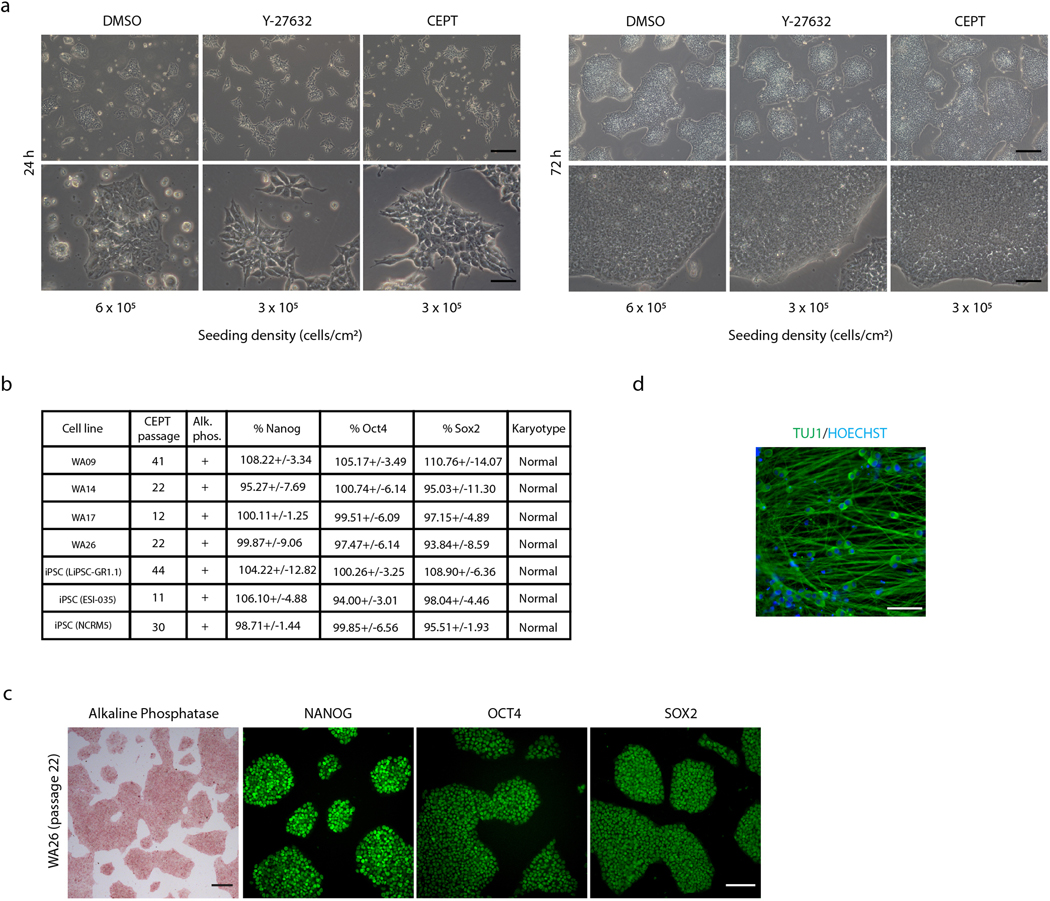
a, Phase-contrast images of hESCs (WA09) at 24 h and 72 h post-passage comparing DMSO (control), Y-27632, and CEPT. Twice as many cells were plated in the DMSO group to compensate for poor cell survival after single-cell dissociation with Accutase and plating in E8 Medium without a ROCK inhibitor. Note the absence of debris at 24 h post-passage after CEPT treatment. Scale bar, upper row, 200 μm; lower row, 50 μm.
b, Comprehensive analysis of eight cell lines passaged by using CEPT (24 h exposure at each passage). High-content imaging and quantification confirm that the vast majority of cells expressed pluripotency-associated markers. Staining and quantification was performed 3 days after plating using the method B algorithm of the Columbus image analysis system (Perkin-Elmer). Data are mean ± s.d. (n = 4 wells for each group). Karyotyping was carried out at the indicated passage numbers.
c, Representative images showing that hESCs grow in colonies and express typical pluripotency-associated markers (Alkaline Phosphatase, NANOG, OCT4, SOX2) after long-term serial passaging with CEPT. Scale bar, 200 μm.
d, Representative example demonstrating that hESCs (WA09) passaged by CEPT can be differentiated into neurons and other lineages (data not shown). Scale bar, 200 μm.
Extended Data Fig. 5: Whole exome sequencing (WES) of hESCs and iPSCs after serial passaging using CEPT.

a,b, To demonstrate that CEPT treatment was safe, hESCs (WA09) and iPSCs (LiPSC-GR1.1) were cultured for 20 passages and exposed to CEPT for 24 h during every passage. Western blots and immunocytochemistry show that both cell lines maintained OCT4 expression and differentiated into ectoderm, mesoderm and endoderm lineages by directed differentiation in adherent monolayer cultures. Scale bars, 100 μm.
c-f, WES variant annotations, genotypes, and CNV analysis show genetic stability of cell lines.
COSMIC variants by passage number for only exonic, nonsynonymous SNPs in cancer hotspots, split by cell line. There was no change in rarity or genotype over passaging (c). Genotype frequencies by passage number for all SNPs (upper panel) and SNPs in cancer hotspots (lower panel), which were proportionally constant (d). Functional SNP annotations by passage number (left) and exonic functional SNP annotations (right), a subset of the former, with unchanging variant counts per annotation category (e). Indel correlogram showing no significant correlation between key variables, passage number, and genotype. The CLINSIG database was used to analyze indels (f).
Extended Data Fig. 6: Improved single-cell cloning by CEPT and karyotype analysis of clonal lines.

a, Single-cell cloning experiment in 96-well plates. Single cells were deposited using BD FACSAria Fusion and treated with Y-27632 or CEPT. First medium change was on day 3 in order not to disturb single cells. Whole-well images were captured a 2x objective after calcein green AM staining to quantify clone numbers on day 9. Arrows show single clones in each well. Scale bar, 3.2 mm.
b, Quantification of single-cell cloning experiment showing higher colony formation rate after CEPT treatment. Data represent mean ± s.d. (n = 3 plates for each group), ***p = 0.0006, unpaired two-tailed Student’s t-test.
c, Single-cell cloning efficiency (WA09) in mTeSR1 medium with microfluidic cell-dispenser Hana shows that CEPT is superior to Y-27632 and comparable to CloneR confirming the broad applicability of CEPT with different cell culture media. Data represent mean ± s.d. (n = 6 plates for each group). ***p = 0.001, one-way ANOVA (see also Fig. 3g-k using StemFlex medium).
d, Time-lapse images recorded by Cytena to document stringent single-cell deposition. A single cell, highlighted in green color, was identified by the system in the outgoing droplet (the volume enclosed by the two concentric circles) and dispensed into well A11 in a 96-well plate.
e,f, CEPT improves single-cell cloning when Cytena single-cell dispenser is used. Single cells were dispensed using Cytena into 96-well plates coated with LN521 or VN and containing StemFlex media following Accutase dissociation. Clones were stained with calcein green AM 9 days after dispensing and images of the plates were scanned with a 2x objective using INCell Analyzer high content analysis (HCA) System. Single cells survived better and were more migratory on LN521 leading to less compact clones compared to those on VN. Data are mean ± s.d. (e: n = 3 plates for all groups. WA01, **p = 0.0054; WA09, ***p = 0.0005; GM25256, **p = 0.0061; LiPSC-GR1.1, **p = 0.01; f: n = 3 plates for all groups. WA01, **p = 0.0096; WA09, **p = 0.0011; GM25256, ***p = 0.0006; LiPSC-GR1.1, **p = 0.0025; unpaired two-tailed Student’s t-test).
g, Time-lapse microscopic images documenting that multiple clusters of pluripotent cells (WA09) arose from a single cell due to cell migration on LN521. Scale bar, 200 μm.
h, Single-cell cloning and establishment of eight clonal cell lines from hESCs (WA09) and iPSCs (LiPSC-GR1.1) by using CEPT treatment. All clonal cell lines maintained normal karyotypes as analyzed after passage 4.
i-l, CEPT supports cell survival after electroporation. The recovery of one hESC (WA09) and two iPSC (LiPSC-GR1.1 and NCRM5) lines from electroporation was quantified using the CTG assay 24 h post-electroporation. Representative images of cells (WA09) 24 h post-electroporation are shown in (l). Data represent mean ± s.d. (n = 9 wells for each group). Scale bar, 100 μm.
Extended Data Fig. 7: Efficient establishment of clonal lines of gene-edited iPSCs.

a, Improved workflow to generate gene-edited clonal cell lines from iPSCs.
b, Detection of GFP+ cells 3 days after electroporation. Scale bar, 5 μm.
c, Schematic of potential gene editing results with or without the integration of the plasmid backbone (AMP), both of which may lead to the expression and correct localization of GFP.
d, Randomly picked GFP+ clones (n = 8) were analyzed for genomic copy numbers of GFP and the plasmid backbone (AMP) using ddPCR. One clone showed bi-allelic correct editing (blue circle), five clones showed mono-allelic correct editing (green circles), and two clones were edited with plasmid integration (red circles).
e, Microscopic images of one of the mono-allelic correctly edited clones (clone #5) and the bi-allelic clone (clone #8). Note the stronger GFP signal intensity in the bi-allelic clone. Scale bar, 10 μm; inset, 2 μm.
f, Junction PCR to detect the GFP insertion into the N-terminus of LMNB1 in clone #5 and #8. GM25256 represents the parental iPSC line. The intermediate band in clone #5 was also reported by ref. 36, likely representing a heteroduplex of the tagged and untagged allele products.
g, Sanger sequencing confirming edited and unedited alleles.
h, Western blot analysis of LMNB1 expression in cell lines with mono- and bi-allelic modification and the parental iPSC line (GM25256).
i, Gene-edited clonal cell lines (clones #5 and #8) maintained normal karyotypes after expansion.
j,k, Differentiation of LMNB1-edited cells (clone #8) into ectoderm (PAX6), mesoderm (Brachyury), and endoderm (SOX17), and neurons (TUJ1).
Extended Data Fig. 8: CEPT improves EB differentiation and formation of kidney organoids.

a, Graphic summary of spontaneous multi-lineage differentiation of single EBs cultured individually in 96-well ULA plates in chemically defined E6 Medium. The expression of PAX6, SOX17 and Brachyury was measured using RT-PCR (see also Fig. 4f).
b, Overview of kidney organoids (one well of 6-well plate) using phase-contrast microscopy and immunocytochemical staining of nephron segment with LTL (Tetragonolobus Lectin), PODXL (Podocalyxin), and ECAD (E-Cadherin). Scale bars, 500 μm.
c, Quantification showing that CEPT treatment generated more kidney organoids as compared to Y-27632 and this effect is more pronounced when fewer cells are plated. Data are mean ± s.d. (n = 4 wells for each group), **p = 0.0049, two-way ANOVA.
Extended Data Fig. 9: CEPT improves thawing of cryopreserved cells and facilitates colony picking during iPSC line establishment.

a, Experiments in upper panel show that long-term cryopreservation and thawing of undifferentiated and differentiated cells (hESCs, iPSCs, astrocytes) in the presence of CEPT is superior to Y-27632 and CloneR. Cell survival was quantified using the CTG assay. In independent experiments (lower panel), long-term cryopreserved cells were placed on dry-ice for 72 h to simulate shipment and then thawed and analyzed at 24 h post-plating. Data are mean ± s.d. (n = 3 wells for each group). Upper row: WA09, ***p = 0.0002 for Y-27632 v.s CEPT, ***p = 0.0009 for CloneR v.s CEPT; LiPSC GR1.1, ***p = 0.0009 for Y-27632 v.s CEPT, **p = 0.0015 for CloneR v.s CEPT; Astrocytes, ****p = 0.0006 for Y-27632 v.s CEPT, ****p = 0.0002 for CloneR v.s CEPT; Lower row: WA09, ****p = 0.0003 for Y-27632 v.s CEPT, ****p = 0.0004 for CloneR v.s CEPT; LiPSC GR1.1, **p = 0.0023 for Y-27632 v.s CEPT, *p = 0.0126 for CloneR v.s CEPT; Astrocytes, ****p < 0.0001 for both comparisons. One-way ANOVA with Tukey post-hoc test.
b,c, Frozen vials of iPSC-derived motor neurons (FUJIFILM CDI) were thawed and treated with Y-27632 and CEPT for 24 h. Electrophysiological characterization of motor neurons was recorded using multi-electrode array technology. Note the higher spontaneous activity of neuronal cultures thawed with CEPT (recordings performed at 7 days after plating cells). Data are mean ± s.d. (n = 3 wells for each group). p = 0.5023, one-way ANOVA.
d,e, Human skin fibroblasts were reprogrammed using the Yamanaka factors and emerging individual iPSC colonies were manually picked and transferred to new plates. At day 8, cell confluency was measured demonstrating that CEPT yields more cellular material for cell line establishment. Data represent mean ± s.d. (n = 10 wells for each group), **p = 0.0044, *p = 0.0292, one-way ANOVA.
Extended Data Fig. 10: CEPT confers cytoprotection during passaging of hPSCs and demonstration of normal cellular stress response in the presence of CEPT.

a, Western blot analysis of iPSCs (LiPSC-GR1.1) showing cellular stress at 3 h post-passage in the presence of DMSO and Y-27632. Note that CEPT protects cells, which are more similar to the condition prior to passage (“no passage” served as control). See also Fig. 6f showing similar results using hESCs.
b, Western blot analysis of cell membrane-associated proteins. Human iPSCs (LiPSC-GR1.1) were dissociated and exposed to Y-27632 or CEPT for 24 h. Note that all proteins are expressed at higher levels after CEPT treatment. GAPDH was used as a loading control. Similar results were obtained using hESCs (see Fig. 6e).
c, Puromycin pulse-chase experiment demonstrating that CEPT-treated iPSCs (LiPSC-GR1.1) show higher protein synthesis capacity than cultures passaged with Y-27632. Note that protein synthesis is completely stalled in the presence of DMSO indicating cellular stress after single-cell dissociation with Accutase. All experiments were performed at 3 h post-passage and samples were collected after 50 min of puromycin exposure. See also Fig. 6g showing similar results with hESCs.
d, Measurement of glutathione levels in two hESC lines and three iPSC lines. Glutathione levels were consistently higher in CEPT treated cultures compared to DMSO and Y-27632. Data represent mean ± s.d. (n = 4 wells for each group). WA01, ****p < 0.0001 for both comparison; WA07, **p = 0.0071 and ***p = 0.0002; GM23476, ****p < 0.0001 and ***p = 0.0001; GM25256, ****p < 0.0001 and ns = 0.0952; GM26107, ****p < 0.0001 and **p = 0.0075; one-way ANOVA. See also Fig. 6h showing similar results for the WA09 cell line.
e, Dose-response experiment showing that increasing concentrations of etoposide correlate with enhanced signal for γH2AX in hESCs (WA09) as measured by Western blotting.
f, hESCs (WA09) were treated with 340 μM etoposide for 3 h. Note that CEPT treatment reduces γH2AX levels with and without etoposide treatment.
g, hESCs (WA09) treated with CEPT show expected physiological stress-response to etoposide-induced DNA damage and strongly induce γH2AX, p21, p53, and phosphorylation of BRCA1, CHK2, and p53. Cells were treated with 340 μM etoposide for 3 h.
Supplementary Material
Supplementary Movie 1. Cell attachment and survival strongly depend on the presence of Chroman 1
Human ESCs (WA09) were dissociated with Accutase, plated on VN-coated 6-well plates in E8 Medium, and treated with DMSO, Y-27632, Chroman 1, and C+E. Movies were recorded with a 10x objective at 10 min intervals for 24 h. Chroman 1 and C+E support cell attachment and survival, whereas Emricasan administered alone is inefficient and similar to the DMSO control condition. Scale bar, 25 μm.
Supplementary Movie 2. CEPT enables single cell cloning and monitoring of clone formation
Human ESCs (WA09) were dissociated with Accutase, filtered through a cell strainer, and loaded into the Hana microfluidic cell dispenser (Namocell). Single cells (one cell per well) were plated onto LN521-coated 96-well plates in StemFlex medium containing CEPT. Movies were recorded with a 4x objective at 6 h intervals. For quantification see also Fig. 3k.
Supplementary Fig. 1: Assay development in 1536-well format and quantitative analysis of screening results
a, Different numbers of hESCs (WA09) were dispensed into each well of 1536-well plates in the presence of 10 μM Y-27632. CellTiter-Glo (CTG) reagent was dispensed 24 h later to assess the number of live cells in each well. Data are mean ± s.d. (n = 128 wells for each group).
b, A total number of 500 cells per well was determined to provide an appropriate Z’ factor suitable for qHTS.
c, Workflow of qHTS in 1536-well plates using hPSCs. Plates were coated with VN diluted in E8 medium at 37°C for 1 h, followed by transfer of small molecule compounds (diluted in DMSO) from the compound library source plates by using a pintool. Once 1536-plates were ready, hESCs were dissociated with Accutase, re-suspended in E8 Medium, and dispensed into the plates at a density of 500 cells per well. After the plates were incubated for 24 h, CTG reagent was dispensed and the luminescence signal was determined using the ViewLux plate reader.
Supplementary Fig. 2: Overview and dose-response analysis of qHTS data
a, Scatter plot of maximum CTG values obtained for all compounds screened. Data were normalized to the CTG values obtained using 10 μM Y-27632, which was set as 100% (control). Setting a threshold of 20% resulted in 113 active compounds (red, blue and green circles).
b, Compound dose-response curves classified as class 1.1 (indicated as red circles in panel a) according to ref. 14.
c, Compound dose-response curves classified as classes 1.2, 2.1, and 2.2 (indicated as blue circles in panel a) according to ref. 14.
d, Target-based analysis of the 113 hits discovered in the primary screen. Maximum cell survival achieved by the compounds in the primary screening binned per mechanistic classes. Maximum survival was normalized to the CTG reading obtained with 10 μM Y-27632 treatment. Each point represents a compound which has the designated primary target and target class on the left panel. The bars in the scatter plot are the median of maximum survival for the given target.
Supplementary Fig. 3: Systematic analysis and comparison of CEPT across different cell lines, media, coating substrates, and cell survival-promoting reagents
a-c, A total of four hPSC lines (WA01, WA09, HUES52, LiPSC-GR.1.1) were cultured in parallel in E8 Medium, StemFlex, mTeSR, MEF-CM or StemFit and passaged using DMSO, Y-27632, CEPT, CloneR, RevitaCell or SMC4. Cells were dissociated with Accutase, counted, and plated on Vitronectin, Matrigel or Laminin 521. Consistently, CEPT improved cell survival in all conditions tested. Data are presented as mean ± s.d. (n = 4–6 biological replicates for each condition).
Supplementary Table 3: Cost analysis of CEPT
In addition to its unique cytoprotective effects, CEPT is also more cost-efficient than other reagents that are currently used to improve cell survival.
Supplementary Table 1. List of 113 hits identified in the primary single-agent screen. Included for each hit are Sample Name, PubChem SID, CAS#, Dose-response curve classification, AC50, Efficacy, Max data, primary MOA and SMILES. Trans-ISRIB is appended to demonstrate its inefficiency to promote cell survival as a single agent.
Supplementary Table 2. List of 316 hits identified in ultra-low cell density combination screens. Included for each hit are Sample Name, PubChem SID, CAS#, Dose-response curve classification, AC50, Efficacy, Max data, primary MOA and SMILES.
Acknowledgements
We thank Paul Shinn, Misha Itkin, Zina Itkin, Carleen Klumpp-Thomas, John Braisted, Jessica Freilino, Ty Voss, Michael Iannotti, Charles Pepper Bonney, Yeliz Gedik, Deborah Ngan, Anna Rossoshek, and Ann Knebel for their support throughout this work. We are grateful to Alan Hoofring and Ethan Tyler from the NIH Medical Arts Design Section and Dr. David C. Gershlick (University of Cambridge) for their art designs. The authors would like to thank David Panchision for critical reading of the manuscript. We also gratefully acknowledge funding from the Regenerative Medicine Program (RMP) of the NIH Common Fund and in part by the intramural research program of the National Center for Advancing Translational Sciences (NCATS), NIH. The funders had no role in study design, data collection and analysis, decision to publish or preparation of the manuscript.
Footnotes
Competing Interest Statement
Y.C., A.S., and I.S. are co-inventors on a US Department of Health and Human Services patent application covering CEPT and its use.
References
- 1.Shi Y, Inoue H, Wu JC & Yamanaka S Induced pluripotent stem cell technology: A decade of progress. Nat. Rev. Drug Discov. 16, 115–130 (2017). [DOI] [PMC free article] [PubMed] [Google Scholar]
- 2.Chen G et al. Chemically defined conditions for human iPSC derivation and culture. Nat. Methods 8, 424–429 (2011). [DOI] [PMC free article] [PubMed] [Google Scholar]
- 3.Barbaric I et al. Time-lapse analysis of human embryonic stem cells reveals multiple bottlenecks restricting colony formation and their relief upon culture adaptation. Stem Cell Reports 3, 142–155 (2014). [DOI] [PMC free article] [PubMed] [Google Scholar]
- 4.Chen Y & Pruett-miller SM Improving single-cell cloning work fl ow for gene editing in human pluripotent stem cells. 31, 186–192 (2018). [DOI] [PubMed] [Google Scholar]
- 5.Ihry RJ et al. P53 inhibits CRISPR-Cas9 engineering in human pluripotent stem cells. Nat. Med. 24, 939–946 (2018). [DOI] [PubMed] [Google Scholar]
- 6.Watanabe K et al. A ROCK inhibitor permits survival of dissociated human embryonic stem cells. Nat. Biotechnol. 25, 681–686 (2007). [DOI] [PubMed] [Google Scholar]
- 7.Chen G, Hou Z, Gulbranson DR & Thomson JA Actin-myosin contractility is responsible for the reduced viability of dissociated human embryonic stem cells. Cell Stem Cell 7, 240–248 (2010). [DOI] [PMC free article] [PubMed] [Google Scholar]
- 8.Ohgushi M et al. Molecular pathway and cell state responsible for dissociation-induced apoptosis in human pluripotent stem cells. Cell Stem Cell 7, 225–239 (2010). [DOI] [PubMed] [Google Scholar]
- 9.Xu Y et al. Revealing a core signaling regulatory mechanism for pluripotent stem cell survival and self-renewal by small molecules. Proc. Natl. Acad. Sci. 107, 8129–8134 (2010). [DOI] [PMC free article] [PubMed] [Google Scholar]
- 10.Tilson SG et al. ROCK Inhibition Facilitates In Vitro Expansion of Glioblastoma Stem-Like Cells. PLoS One 10, e0132823 (2015). [DOI] [PMC free article] [PubMed] [Google Scholar]
- 11.Zhao M et al. Y-27632 preconditioning enhances transplantation of human-induced pluripotent stem cell-derived cardiomyocytes in myocardial infarction mice. Cardiovasc. Res. 115, 343–356 (2019). [DOI] [PMC free article] [PubMed] [Google Scholar]
- 12.Huang R et al. The NCGC Pharmaceutical Collection: A Comprehensive Resource of Clinically Approved Drugs Enabling Repurposing and Chemical Genomics. Sci. Transl. Med. 3, 80ps16–80ps16 (2011). [DOI] [PMC free article] [PubMed] [Google Scholar]
- 13.Mathews Griner LA et al. High-throughput combinatorial screening identifies drugs that cooperate with ibrutinib to kill activated B-cell–like diffuse large B-cell lymphoma cells. Proc. Natl. Acad. Sci. 111, 2349–2354 (2014). [DOI] [PMC free article] [PubMed] [Google Scholar]
- 14.Huang R et al. Chemical genomics profiling of environmental chemical modulation of human nuclear receptors. Environ. Health Perspect. 119, 1142–1148 (2011). [DOI] [PMC free article] [PubMed] [Google Scholar]
- 15.Chen YT et al. Asymmetric synthesis of potent chroman-based Rho kinase (ROCK-II) inhibitors. Med. Chem. Commun. 2, 73–75 (2011). [Google Scholar]
- 16.Anastassiadis T, Deacon SW, Devarajan K, Ma H & Peterson JR Comprehensive assay of kinase catalytic activity reveals features of kinase inhibitor selectivity. Nat. Biotechnol. 29, 1039–1045 (2011). [DOI] [PMC free article] [PubMed] [Google Scholar]
- 17.Vallabhaneni H et al. High Basal Levels of γH2AX in Human Induced Pluripotent Stem Cells are Linked to Replication-Associated DNA Damage and Repair. Stem Cells (2018). doi: 10.1002/stem.2861 [DOI] [PMC free article] [PubMed] [Google Scholar]
- 18.Närvä E et al. A Strong Contractile Actin Fence and Large Adhesions Direct Human Pluripotent Colony Morphology and Adhesion. Stem Cell Reports 9, 67–76 (2017). [DOI] [PMC free article] [PubMed] [Google Scholar]
- 19.Rodin S et al. Clonal culturing of human embryonic stem cells on laminin-521/E-cadherin matrix in defined and xeno-free environment. Nat. Commun. 5, 1–13 (2014). [DOI] [PubMed] [Google Scholar]
- 20.Inglese J et al. Quantitative high-throughput screening: A titration-based approach that efficiently identifies biological activities in large chemical libraries. Proc. Natl. Acad. Sci. 103, 11473–11478 (2006). [DOI] [PMC free article] [PubMed] [Google Scholar]
- 21.Chang M-Y et al. Doxycycline Enhances Survival and Self-Renewal of Human Pluripotent Stem Cells. Stem Cell Reports 3, 353–364 (2014). [DOI] [PMC free article] [PubMed] [Google Scholar]
- 22.Sidrauski C, McGeachy AM, Ingolia NT & Walter P The small molecule ISRIB reverses the effects of eIF2α phosphorylation on translation and stress granule assembly. Elife 2015, 1–16 (2015). [DOI] [PMC free article] [PubMed] [Google Scholar]
- 23.Miller-Fleming L, Olin-Sandoval V, Campbell K & Ralser M Remaining Mysteries of Molecular Biology: The Role of Polyamines in the Cell. J. Mol. Biol. 427, 3389–3406 (2015). [DOI] [PubMed] [Google Scholar]
- 24.Zhao T, Goh KJ, Ng HH & Vardy LA A role for polyamine regulators in ESC self-renewal. Cell Cycle 11, 4517–4523 (2012). [DOI] [PMC free article] [PubMed] [Google Scholar]
- 25.Valamehr B et al. A novel platform to enable the high-throughput derivation and characterization of feeder-free human iPSCs. 1–11 (2012). doi: 10.1038/srep00213 [DOI] [PMC free article] [PubMed] [Google Scholar]
- 26.Chang MT et al. Identifying recurrent mutations in cancer reveals widespread lineage diversity and mutational specificity. Nat. Biotechnol. 34, 155–163 (2016). [DOI] [PMC free article] [PubMed] [Google Scholar]
- 27.Tate JG et al. COSMIC: the Catalogue Of Somatic Mutations In Cancer. Nucleic Acids Res. 47, 941–947 (2018). [DOI] [PMC free article] [PubMed] [Google Scholar]
- 28.O’Leary NA et al. Reference sequence (RefSeq) database at NCBI: Current status, taxonomic expansion, and functional annotation. Nucleic Acids Res. 44, D733–D745 (2016). [DOI] [PMC free article] [PubMed] [Google Scholar]
- 29.Sherry ST dbSNP: the NCBI database of genetic variation. Nucleic Acids Res. 29, 308–311 (2001). [DOI] [PMC free article] [PubMed] [Google Scholar]
- 30.Auton A et al. A global reference for human genetic variation. Nature 526, 68–74 (2015). [DOI] [PMC free article] [PubMed] [Google Scholar]
- 31.Lek M et al. Analysis of protein-coding genetic variation in 60,706 humans. Nature 536, 285–291 (2016). [DOI] [PMC free article] [PubMed] [Google Scholar]
- 32.Adzhubei IA et al. A method and server for predicting damaging missense mutations. Nat. Methods 7, 248–249 (2010). [DOI] [PMC free article] [PubMed] [Google Scholar]
- 33.Landrum MJ et al. ClinVar: Public archive of interpretations of clinically relevant variants. Nucleic Acids Res. 44, D862–D868 (2016). [DOI] [PMC free article] [PubMed] [Google Scholar]
- 34.Merkle FT et al. Human pluripotent stem cells recurrently acquire and expand dominant negative P53 mutations. Nature 545, 229–233 (2017). [DOI] [PMC free article] [PubMed] [Google Scholar]
- 35.Li X-L et al. Highly efficient genome editing via CRISPR–Cas9 in human pluripotent stem cells is achieved by transient BCL-XL overexpression. Nucleic Acids Res. 1–21 (2018). doi: 10.1093/nar/gky804 [DOI] [PMC free article] [PubMed] [Google Scholar]
- 36.Roberts B et al. Systematic gene tagging using CRISPR/Cas9 in human stem cells to illuminate cell organization. Mol. Biol. Cell 28, 2854–2874 (2017). [DOI] [PMC free article] [PubMed] [Google Scholar]
- 37.Tsankov AM et al. A qPCR ScoreCard quantifies the differentiation potential of human pluripotent stem cells. Nat. Biotechnol. 33, 1182–1192 (2015). [DOI] [PMC free article] [PubMed] [Google Scholar]
- 38.Lancaster MA et al. Cerebral organoids model human brain development and microcephaly. Nature 501, 373–379 (2013). [DOI] [PMC free article] [PubMed] [Google Scholar]
- 39.Lachmann A et al. Massive mining of publicly available RNA-seq data from human and mouse. Nat. Commun. 9, (2018). [DOI] [PMC free article] [PubMed] [Google Scholar]
- 40.Wagh V et al. Effects of Cryopreservation on the Transcriptome of Human Embryonic Stem Cells After Thawing and Culturing. Stem Cell Rev. Reports 7, 506–517 (2011). [DOI] [PubMed] [Google Scholar]
- 41.Wong KG et al. CryoPause: A New Method to Immediately Initiate Experiments after Cryopreservation of Pluripotent Stem Cells. Stem Cell Reports 9, 355–365 (2017). [DOI] [PMC free article] [PubMed] [Google Scholar]
- 42.Schlaeger TM et al. A comparison of non-integrating reprogramming methods. Nat. Biotechnol. 33, 58–63 (2014). [DOI] [PMC free article] [PubMed] [Google Scholar]
- 43.Paull D et al. Automated, high-throughput derivation, characterization and differentiation of induced pluripotent stem cells. Nat. Methods 12, 885–892 (2015). [DOI] [PMC free article] [PubMed] [Google Scholar]
- 44.Takaki T et al. Actomyosin drives cancer cell nuclear dysmorphia and threatens genome stability. Nat. Commun. 8, (2017). [DOI] [PMC free article] [PubMed] [Google Scholar]
- 45.Zannini L, Delia D & Buscemi G CHK2 kinase in the DNA damage response and beyond. J. Mol. Cell Biol. 6, 442–457 (2014). [DOI] [PMC free article] [PubMed] [Google Scholar]
- 46.Wortel IMN, van der Meer LT, Kilberg MS & van Leeuwen FN Surviving Stress: Modulation of ATF4-Mediated Stress Responses in Normal and Malignant Cells. Trends Endocrinol. Metab. 28, 794–806 (2017). [DOI] [PMC free article] [PubMed] [Google Scholar]
- 47.Schmidt EK, Clavarino G, Ceppi M & Pierre P SUnSET, a nonradioactive method to monitor protein synthesis. Nat. Methods 6, 275–277 (2009). [DOI] [PubMed] [Google Scholar]
- 48.Bigarella CL, Liang R & Ghaffari S Stem cells and the impact of ROS signaling. Development 141, 4206–4218 (2014). [DOI] [PMC free article] [PubMed] [Google Scholar]
- 49.Collins AR The comet assay for DNA damage and repair: Principles, applications, and limitations. Appl. Biochem. Biotechnol. - Part B Mol. Biotechnol. 26, 249–261 (2004). [DOI] [PubMed] [Google Scholar]
- 50.Raj D et al. Switchable CAR-T cells mediate remission in metastatic pancreatic ductal adenocarcinoma. Gut 1–13 (2018). doi: 10.1136/gutjnl-2018-316595 [DOI] [PMC free article] [PubMed] [Google Scholar]
- 51.Themeli M et al. induced pluripotent stem cells for cancer therapy. 31, 928–933 (2017). [DOI] [PMC free article] [PubMed] [Google Scholar]
- 52.Enver T et al. Cellular differentiation hierarchies in normal and culture-adapted human embryonic stem cells. Hum. Mol. Genet. 14, 3129–3140 (2005). [DOI] [PubMed] [Google Scholar]
- 53.Baker DEC et al. Adaptation to culture of human embryonic stem cells and oncogenesis in vivo. Nat. Biotechnol. 25, 207–215 (2007). [DOI] [PubMed] [Google Scholar]
- 54.Taapken SM et al. Karyotypic abnormalities in human induced pluripotent stem cells and embryonic stem cells. Nat. Biotechnol. 29, 313–4 (2011). [DOI] [PubMed] [Google Scholar]
- 55.Andrews PW et al. Assessing the Safety of Human Pluripotent Stem Cells and Their Derivatives for Clinical Applications. Stem Cell Reports 9, 1–4 (2017). [DOI] [PMC free article] [PubMed] [Google Scholar]
- 56.Rosler ES et al. Long-Term Culture of Human Embryonic Stem Cells in Feeder-Free Conditions. Dev. Dyn. 229, 259–274 (2004). [DOI] [PubMed] [Google Scholar]
- 57.Garitaonandia I et al. Increased risk of genetic and epigenetic instability in human embryonic stem cells associated with specific culture conditions. PLoS One 10, 1–25 (2015). [DOI] [PMC free article] [PubMed] [Google Scholar]
- 58.Liu L, Michowski W, Kolodziejczyk A & Sicinski P The cell cycle in stem cell proliferation, pluripotency and differentiation. Nat. Cell Biol. 21, (2019). [DOI] [PMC free article] [PubMed] [Google Scholar]
Associated Data
This section collects any data citations, data availability statements, or supplementary materials included in this article.
Supplementary Materials
Supplementary Movie 1. Cell attachment and survival strongly depend on the presence of Chroman 1
Human ESCs (WA09) were dissociated with Accutase, plated on VN-coated 6-well plates in E8 Medium, and treated with DMSO, Y-27632, Chroman 1, and C+E. Movies were recorded with a 10x objective at 10 min intervals for 24 h. Chroman 1 and C+E support cell attachment and survival, whereas Emricasan administered alone is inefficient and similar to the DMSO control condition. Scale bar, 25 μm.
Supplementary Movie 2. CEPT enables single cell cloning and monitoring of clone formation
Human ESCs (WA09) were dissociated with Accutase, filtered through a cell strainer, and loaded into the Hana microfluidic cell dispenser (Namocell). Single cells (one cell per well) were plated onto LN521-coated 96-well plates in StemFlex medium containing CEPT. Movies were recorded with a 4x objective at 6 h intervals. For quantification see also Fig. 3k.
Supplementary Fig. 1: Assay development in 1536-well format and quantitative analysis of screening results
a, Different numbers of hESCs (WA09) were dispensed into each well of 1536-well plates in the presence of 10 μM Y-27632. CellTiter-Glo (CTG) reagent was dispensed 24 h later to assess the number of live cells in each well. Data are mean ± s.d. (n = 128 wells for each group).
b, A total number of 500 cells per well was determined to provide an appropriate Z’ factor suitable for qHTS.
c, Workflow of qHTS in 1536-well plates using hPSCs. Plates were coated with VN diluted in E8 medium at 37°C for 1 h, followed by transfer of small molecule compounds (diluted in DMSO) from the compound library source plates by using a pintool. Once 1536-plates were ready, hESCs were dissociated with Accutase, re-suspended in E8 Medium, and dispensed into the plates at a density of 500 cells per well. After the plates were incubated for 24 h, CTG reagent was dispensed and the luminescence signal was determined using the ViewLux plate reader.
Supplementary Fig. 2: Overview and dose-response analysis of qHTS data
a, Scatter plot of maximum CTG values obtained for all compounds screened. Data were normalized to the CTG values obtained using 10 μM Y-27632, which was set as 100% (control). Setting a threshold of 20% resulted in 113 active compounds (red, blue and green circles).
b, Compound dose-response curves classified as class 1.1 (indicated as red circles in panel a) according to ref. 14.
c, Compound dose-response curves classified as classes 1.2, 2.1, and 2.2 (indicated as blue circles in panel a) according to ref. 14.
d, Target-based analysis of the 113 hits discovered in the primary screen. Maximum cell survival achieved by the compounds in the primary screening binned per mechanistic classes. Maximum survival was normalized to the CTG reading obtained with 10 μM Y-27632 treatment. Each point represents a compound which has the designated primary target and target class on the left panel. The bars in the scatter plot are the median of maximum survival for the given target.
Supplementary Fig. 3: Systematic analysis and comparison of CEPT across different cell lines, media, coating substrates, and cell survival-promoting reagents
a-c, A total of four hPSC lines (WA01, WA09, HUES52, LiPSC-GR.1.1) were cultured in parallel in E8 Medium, StemFlex, mTeSR, MEF-CM or StemFit and passaged using DMSO, Y-27632, CEPT, CloneR, RevitaCell or SMC4. Cells were dissociated with Accutase, counted, and plated on Vitronectin, Matrigel or Laminin 521. Consistently, CEPT improved cell survival in all conditions tested. Data are presented as mean ± s.d. (n = 4–6 biological replicates for each condition).
Supplementary Table 3: Cost analysis of CEPT
In addition to its unique cytoprotective effects, CEPT is also more cost-efficient than other reagents that are currently used to improve cell survival.
Supplementary Table 1. List of 113 hits identified in the primary single-agent screen. Included for each hit are Sample Name, PubChem SID, CAS#, Dose-response curve classification, AC50, Efficacy, Max data, primary MOA and SMILES. Trans-ISRIB is appended to demonstrate its inefficiency to promote cell survival as a single agent.
Supplementary Table 2. List of 316 hits identified in ultra-low cell density combination screens. Included for each hit are Sample Name, PubChem SID, CAS#, Dose-response curve classification, AC50, Efficacy, Max data, primary MOA and SMILES.
Data Availability Statement
Extended results of small molecule screening associated with Figs. 1, 2, 3 and Extended Data Figs. 2, 3, and Supplementary Information Figs. 1,2 are available at the following link: https://tripod.nih.gov/matrix-client/?project=2621.
Whole-exome and RNA sequencing files have been deposited to the Sequence Read Archive under BioProject PRJNA552890, https://www.ncbi.nlm.nih.gov/sra/?term=PRJNA552890. An interactive RShiny app is available to browse the RNA-Seq at https://ipsceq.ncats.io. Sequencing data analysis code is available at https://github.com/cemalley/Chen_methods. ANNOVAR and annotation databases are available for download at https://annovar.openbioinformatics.org/en/latest/user-guide/download/.