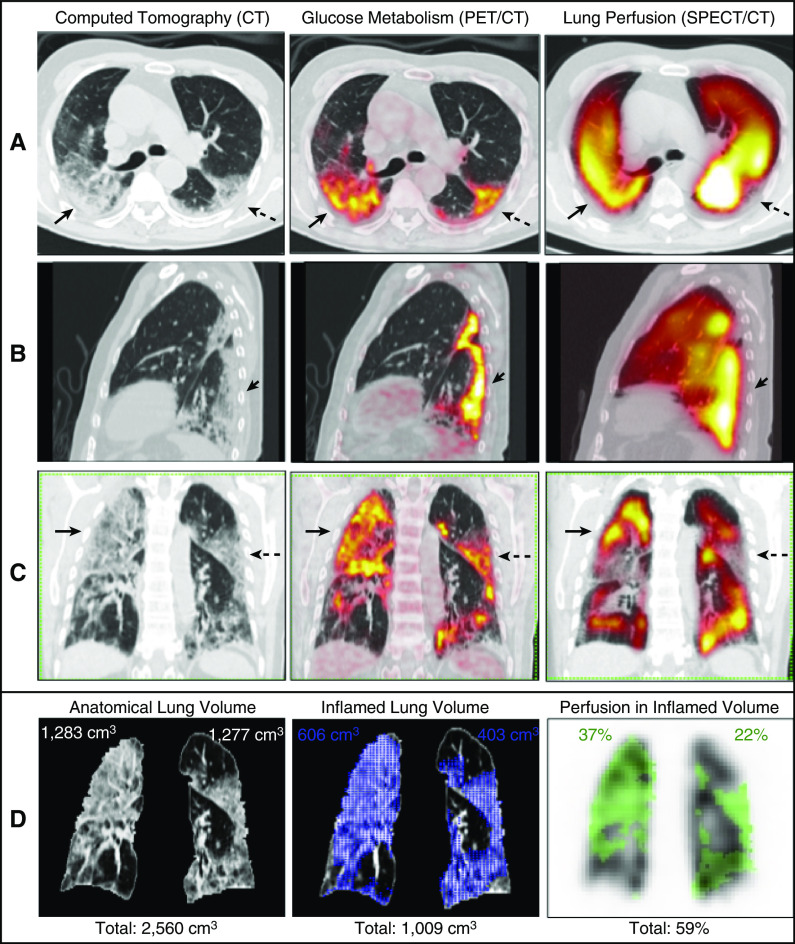
Severe hypoxemia in some patients with coronavirus disease (COVID-19) has been related to loss of hypoxic pulmonary vasoconstriction (1, 2). A 77-year-old male with 6 days of mild respiratory symptoms and no comorbidities was admitted with signs of respiratory failure (PaO2/FiO2: 61 mm Hg/0.36 mm Hg = 169.4 mm Hg; reference values [RVs] of 400–500 mm Hg). Chest computed tomography (CT) showed extensive ground-glass opacities (50–75% right-lung involvement and 25–50% left-lung involvement). Laboratory findings showed a D-dimer concentration of 652 ng/ml (RV < 500 ng/ml) and a C-reactive-protein concentration of 93.5 mg/dl (RV < 0.1 mg/dl). Nasopharyngeal swab test (RT-PCR) results confirmed COVID-19. The standard institutional protocol was initiated with a nasal oxygen catheter (4.0 L/min), antibiotics, dexamethasone, and enoxaparin. The patient required invasive ventilation on the 10th day and died on the 35th day of hospitalization. Lung-perfusion single-photon-emission CT/CT using 99mTc-labeled macroaggregated albumin (3) and positron emission tomography/CT using 18F-fluorodeoxyglucose (4) were sequentially performed on the third day of hospitalization during the same visit to the Nuclear Medicine Service to simultaneously assess pulmonary perfusion and inflammation. Normal or increased lung perfusion was detected in most of the hypermetabolic areas evidenced by positron emission tomography/CT images (Figure 1). Image quantification was conducted using free, open-source image-processing software (5, 6). Quantification results showed 59% of the total pulmonary perfusion occurring in inflamed lung tissue, which corresponded to 39% of the total anatomic lung volume (Figure 1D). This suggested a high right-to-left shunt fraction in the inflamed areas, which was probably related to loss of hypoxic vasoconstriction, as has been proposed before to occur in COVID-19 pneumopathy (1, 2). The vasoconstriction reflex seemed preserved in a few areas of 18F-fluorodeoxyglucose uptake. Inflammation and loss of hypoxic pulmonary vasoconstriction can be assessed and quantified using the described methodology. Further studies are needed to evaluate its possible clinical uses.
Figure 1.
(A–C) Axial (A), left sagittal (B), and coronal (C) slices from computed tomography (CT) (left), 18F-fluorodeoxyglucose (18F-FDG) positron emission tomography (PET)/CT (center), and lung perfusion single-photon-emission CT (SPECT)/CT (right). Note normal or increased lung perfusion in most hypermetabolic areas detected by PET/CT (solid arrows) compared with the apparently unaffected lung. The inflammatory abnormalities have a clear predominance in the posterior lung fields and included all consolidations or ground-glass opacities on CT images. In general, the denser the lung parenchyma on CT images, the greater the 18F-FDG uptake on PET images. Hypoperfusion (preserved vasoconstriction) is present in a few areas of 18F-FDG uptake (dashed arrows). (D) Corresponding segmented coronal slices, representative of the volumetric quantification, are shown. The segmented lungs obtained from CT images have a total volume of 2,560 cm3 (pulmonary contour in D; left). The maximal standardized uptake value of the 18F-FDG PET/CT images is 11.8. The volume of 18F-FDG uptake, representing total lung inflammation, was segmented using the mediastinal blood pool as the threshold (standardized uptake value = 1.8) and measures 1,009 cm3 (blue area in D; center). This corresponds to 39% of the total anatomic lung volume (right lung: 23%, left lung: 16%). The mask of the segmented volume of 18F-FDG uptake was transferred to the SPECT volume (green area in D; right). The counts within this mask were divided by the total counts of the SPECT image. This resulted in 59% of the total counts of lung perfusion occurring in inflamed lung tissue (right lung: 37%, left lung: 22%). Accordingly, 61% of the normal (noninflamed) lungs, which ideally should receive 100% of lung perfusion, receive only 41% of it. Therefore, this quantification estimates the total loss of hypoxic vasoconstriction in this patient. This right-to-left shunt could partially explain the severe hypoxemia of this patient. See the details of the image acquisition and quantification in the online supplement.
Acknowledgments
Acknowledgment
The authors thank Cyclobras Radiopharmaceuticals, São Paulo, Brazil, for kindly supplying the radiopharmaceutical 18F-fluorodeoxyglucose used in the present project.
Footnotes
Supported by National Council for Scientific and Technological Development (CNPq) research grants processes 311841/2018-0 (C.D.R.) and proc 302827/2018-8 (D.E.Z.-W.).
Author Contributions: C.D.R., P.T., and D.E.Z.-W. designed the research. A.P.F., S.P.M.S., M.F., and N.T. collected the data. C.D.R., S.S.J.D., E.S.L.G., P.T., and D.E.Z.-W. analyzed and interpreted the data. C.D.R. and D.E.Z.-W. wrote the manuscript. C.D.R. and M.E.S.T. performed the image quantifications. S.P.M.S., M.F., S.S.J.D., E.S.L.G., and P.T. reviewed the manuscript and provided comments. All authors reviewed and approved the final version to be published.
This article has an online supplement, which is accessible from this issue’s table of contents at www.atsjournals.org.
Originally Published in Press as DOI: 10.1164/rccm.202007-2944IM on February 26, 2021
Author disclosures are available with the text of this article at www.atsjournals.org.
References
- 1.Gattinoni L, Coppola S, Cressoni M, Busana M, Rossi S, Chiumello D. COVID-19 does not lead to a “typical” acute respiratory distress syndrome. Am J Respir Crit Care Med. 2020;201:1299–1300. doi: 10.1164/rccm.202003-0817LE. [DOI] [PMC free article] [PubMed] [Google Scholar]
- 2.Patel BV, Arachchillage DJ, Ridge CA, Bianchi P, Doyle JF, Garfield B, et al. Pulmonary angiopathy in severe COVID-19: physiologic, imaging and hematologic observations. Am J Respir Crit Care Med. 2020;202:690–699. doi: 10.1164/rccm.202004-1412OC. [DOI] [PMC free article] [PubMed] [Google Scholar]
- 3.Cobes N, Guernou M, Lussato D, Queneau M, Songy B, Bonardel G, et al. Ventilation/perfusion SPECT/CT findings in different lung lesions associated with COVID-19: a case series. Eur J Nucl Med Mol Imaging. 2020;47:2453–2460. doi: 10.1007/s00259-020-04920-w. [DOI] [PMC free article] [PubMed] [Google Scholar]
- 4.Albano D, Camoni L, Rinaldi R, Bertagna F, Giubbini R. 18F-FDG PET/CT metabolic behavior of COVID-19 pneumonia: a series of 4 patients with RT-PCR confirmation. Clin Nucl Med. 2020;45:e378–e380. doi: 10.1097/RLU.0000000000003150. [DOI] [PMC free article] [PubMed] [Google Scholar]
- 5.Cypess AM, Lehman S, Williams G, Tal I, Rodman D, Goldfine AB, et al. Identification and importance of brown adipose tissue in adult humans. N Engl J Med. 2009;360:1509–1517. doi: 10.1056/NEJMoa0810780. [DOI] [PMC free article] [PubMed] [Google Scholar]
- 6.Loening AM, Gambhir SS. AMIDE: a free software tool for multimodality medical image analysis. Mol Imaging. 2003;2:131–137. doi: 10.1162/15353500200303133. [DOI] [PubMed] [Google Scholar]


