Abstract
For patients with malignant brain tumors (glioblastomas), a safe maximal resection of tumor is critical for an increased survival rate. However, complete resection of the cancer is hard to achieve due to the invasive nature of these tumors, where the margins of the tumors become blurred from frank tumor to more normal brain tissue, but in which single cells or clusters of malignant cells may have invaded. Recent developments in fluorescence imaging techniques have shown great potential for improved surgical outcomes by providing surgeons intraoperative contrast-enhanced visual information of tumor in neurosurgery. The current near-infrared (NIR) fluorophores, such as indocyanine green (ICG), cyanine5.5 (Cy5.5), 5-aminolevulinic acid (5-ALA)-induced protoporphyrin IX (PpIX), are showing clinical potential to be useful in targeting and guiding resections of such tumors. Real-time tumor margin identification in NIR imaging could be helpful to both surgeons and patients by reducing the operation time and space required by other imaging modalities such as intraoperative MRI, and has the potential to integrate with robotically assisted surgery. In this paper, a segmentation method based on the Chan-Vese model was developed for identifying the tumor boundaries in an ex-vivo mouse brain from relatively noisy fluorescence images acquired by a multimodal scanning fiber endoscope (mmSFE). Tumor contours were achieved iteratively by minimizing an energy function formed by a level set function and the segmentation model. Quantitative segmentation metrics based on tumor-to-background (T/B) ratio were evaluated. Results demonstrated feasibility in detecting the brain tumor margins at quasi-real-time and has the potential to yield improved precision brain tumor resection techniques or even robotic interventions in the future.
Keywords: Fluorescence image segmentation, tumor-to-background ratio, tumor margin detection, intraoperative imaging, robotic neurosurgery
1. INTRODUCTION
1.1. Clinical background of fluorescence imaging in brain tumor resection
In resection of malignant gliomas (e.g. glioblastomas) and other brain tumors, an important aim is the near complete resection of the cancer in contrast-enhancing magnetic resonance imaging (MRI) signal without damaging the healthy tissue, because the extent of removal (EOR) is a critical factor for tumor progression and survival. However, this goal is challenging for surgeons as the tumor boundaries are often not well delineated because of the invading front of tumor cells. In cases of tumor recurrence, tumor tissue at the margin of a surgical cavity is often hard to distinguish from other treatment effects such as radiation using conventional imaging and surgical techniques. Therefore, imaging modalities such as MRI and ultrasonography are being configured for intraoperative use to locate tumor tissue or residual, recurrent tumor. However, these imaging modalities are expensive and require significantly modified instrumentation and operating room design, and therefore have not found broad acceptance. While these modalities may reveal the shift of the brain after opening the cranium, they do not provide imaging at cellular resolution.
Recently, imaging techniques based on fluorescence contrast agents for tumor visualization have been explored for neurosurgery to intraoperatively identity tumor tissue. Such imaging techniques allow the surgeon to image the fluorescent signal that correlates in most instances to the tumor tissue with capabilities of real-time, non-contact and preservation of background view. Clinical developments in imaging systems and biomarkers have made progress towards clinical application [1][2]. Tumor Paint™ (Blaze Biosciences, Seattle, WA), a molecular biomarker conjugated with ICG, has shown potential for delineating the brain tumors in real-time [3]. 5-ALA, another widely studied contrast agent which is approved by European Medicines Evaluation Agency for tumor visualization based on the accumulation of PpIX, has been used in multiple clinical trials for resection of malignant gliomas [4][5][6]. The reported results [4][6][7] indicate an improved rate of gross total resection (GTR), which may assist surgeons in near-complete brain tumor resection to increase survival and reduce neurological deficits. Fluorescence imaging of brain tumors in real time at cellular resolution (confocal laser endomicroscopy (CLE)) during surgery with comparable diagnosis results to conventional pathology techniques is of particular neurosurgical interest in that it can identify metastasizing tumor cells invading the brain at the tumor border [16]. The high resolution of confocal imaging comes with very limited real-time visual field (sub-millimeter range) which add inefficiencies and complexities that can be overcome by reducing the resolution to multi-cellular and expanding the visual field to the millimeter range.
1.2. Tumor detection in fluorescence images
Fluorescence-guided surgery has shown potential in improving the clinical outcome. Although results of surgery using 5-ALA have been generally positive, exact indentification of cells with 5-ALA signal at near cellular resolution remains elusive. A technical difficulty in tumor visualization, especially for thinner regions of residual tumors, is that the fluorescence signal becomes very weak due to the lower indicator concentration and photo-bleaching, e.g. with 405 nm laser excitation of low concentrations of PpIX from 5-ALA. Since cancer cells essentially disappear among the healthy brain tissue when photo-bleaching occurs, keeping laser power levels low will help avoid this permanent loss of signal during surgery. Therefore, longer integration time for capturing image frames is required in order to achieve an acceptable signal-to-noise (S/N) ratio for the detection of the residual or infiltrating tumors at low laser power. Many developments in design of imaging systems, such as the mmSFE [8], have been made to improve their S/N ratio and image quality with reduced the integration time, light exposure and auto-fluorescence background subtraction [9]. In addition, algorithms for medical image processing can provide reliable tumor segmentation in an automated manner despite the relatively noisy and low-contrast images.
1.3. In the context of semi-autonomous robotic neurosurgery
Another need for automated tumor detection in fluorescence images arises from the exploration of robotic neurosurgery. Since the acquisition of fluorescence images might be slowed for improved residual tumor visualization, the manual removal of residual tumors can be a slow, repetitive, and tedious procedure for surgeons. Thus, this procedure might be automatically guided by a robot that removes fluorescent cell clusters by extremely precise surgery or ablation in the debulked tumor cavity. With this background, a reliable and fast tumor detection method is required for medical planning and intervention by a surgical robot with automation. In the following sections, methods for reliable tumor detection in the presence of clinically significant levels of fluorescence will be addressed and the performance of tumor recognition and segmentation algorithms will be analyzed.
2. METHODS
Segmentation is an important procedure in medical image processing to extract useful information for medical planning, diagnostics and treatment. Many research studies on the segmentation of various image modalities e.g. MRI [10], CT [11] have been published. Because fluorescence tissue images display high noise levels at the background and various signal intensities due to the uncontrolled imaging distances, the traditional thresholding and edge detection methods show poor segmentation results of these types of images. An alternative approach for segmenting the images with low-contrast edges is to use region-based active contour models, which are known for the robustness but high computational complexity. Region-based active contour models use a certain region descriptor to guide the curves evolving towards the boundary of each region of interest, thus to detect the objects in the images. The Chan-Vese model [12] is one prominent variation of the region-based active contour models that is applied for this fluorescence image-guided robotic surgery. This algorithm can be used in a repeated automated manner during residual tumor clean up, as each time the top layer of fluorescence cells are removed, a new underlying layer is revealed and its boundary needs to be automatically demarcated to guide the robot with surgeon’s monitoring.
2.1. Segmentation Problem and Active Contour Model
The basis of the proposed segmentation method is a Mumford-Shah model [13], which approximates a general grayscale image into a piecewise smooth function. Let the domain Ω be a bounded subset of R2 and function f(x, y): Ω → R be a given grayscale image to be segmented, and u(x, y) be the piecewise approximation of the original image f(x, y), it is smooth within each connected region in the image domain Ω separated by the contour C, i.e. in region Ω\C, the problem is to find such contour C ⊂ Ω, which segments the image f(x, y) into non-overlapping regions. The Mumford-Shah energy functional is defined as follows:
| (1) |
where μ, λ > 0 are fixed weighting parameters.
A special case of the Mumford-Shah energy function is given by the Chan-Vese model [12], which assumes the image approximation u(x, y) to be a piecewise constant function allowed to have only two values with respect to the contour C.
| (2) |
The Chan-Vese energy function further adds an additional area penalizing term, and is modified as Equation 3.
| (3) |
where μ > 0, v ≥ 0, λ1, λ2 > 0, are pre-tuned weighting parameters for penalizing the length of the C, the enclosed area of C as well as the difference between the piecewise constant model u(x, y) and the input image f(x, y). Image segmentation can be obtained as the best two-phase piecewise constant approximation u of the image f by finding a minimizer of the problem (Eq. 3).
However, in practice, it is difficult to minimize both of the energy functions (1) and (3) due to the non-convexity, although theoretical existence and regularity of the optimal results were proved in [13] and [14]. Therefore, the Chan-Vese algorithm proposed a level set formulation [15] to solve the optimization problem for practical use.
2.2. Level Set Formulation of the Model
Instead by explicitly searching over all boundary sets C, the Chan-Vese algorithm uses a level set function to minimize the energy function. The boundary sets C ⊂ Ω is obtained by zero-crossing of a level set function φ(x, y): Ω → R as in Equation 4.
| (4) |
The inside and outside of the contour C are distinguished by the sign of φ(x, y).
| (5) |
| (6) |
In general, there exist multiple representations of level set function for a given C. With the assistance of the Heaviside step function H for numerical computation, which is defined as:
| (7) |
Each term of the Eq. (3) can be expressed in the level set function as below:
| (8) |
| (9) |
| (10) |
| (11) |
Combining Eq. (8), (9), (10) and (11), the level set formulation of the Chan-Vese Model can be derived as:
| (12) |
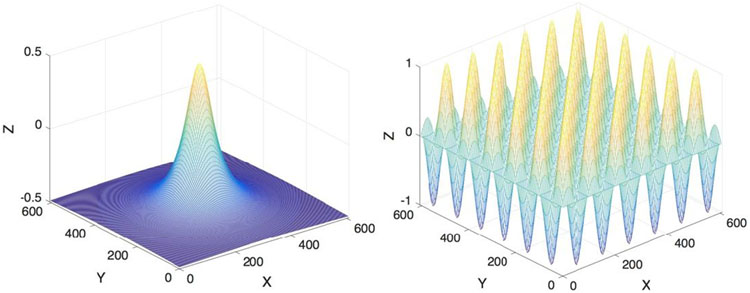
After initializing a level set function φ(x, y) which is smooth enough, we solve the minimization problem numerically by evolving the function φ in each iteration. In this study, we test with a circular function and a chessboard function as initial level set functions (shown in Fig. 1). Results showed that both types worked well for the given images as long as enough iterations were provided.
Figure 1:
Two types of initial level set function used in this study with their zero-crossing as a circle of radius 50 pixels (left) and a chessboard with square width of 50 pixels (right).
2.3. Fluorescence Image Processing Routine
The entire processing routine for each raw fluorescence image is divided into five major steps as illustrated below in Fig. 2.
Figure 2:
Fluorescence image processing routine
Smoothing:
For reducing the pixel noise, an initial image-smoothing step is performed using a median filter of a window size 3x3 pixel. Because the fluorescence image taken by the mmSFE contains a significant amount of salt and pepper noise (impulsive noise), and median filtering is less sensitive than linear techniques to extreme changes in pixel values, thus, it is relatively effective when removing such type of noise while still preserving the edge information of an image. The smoothed intensity image serves an input to the next step of the Chan-Vese segmentation.
Segmentation:
The segmentation procedure starts automatically with a predefined level set function φ0 with its zero-crossing as the initial guess of the contours. In this study, the initial contour is either a circle of radius 50 pixels at the center of the image or a chessboard with square width of 50 pixels. At each iteration step k, the algorithm updates c1(φk) and c2(φk), and solves the partial differential equation to obtain φk+1. The iteration terminates until the minimum is found (i.e. the L2 distance between φk+1 and φk is below a tolerance) or the maximum allowed loop number is reached.
Contour Extraction:
The resulting level set function φ is zero-crossed to achieve gross contours, which might still be noisy due to insufficient number of iterations. A binary image is created by the extracted contours.
Outlier Removal:
A morphological transform is applied to the generated image for outlier removal and final smoothing of the segmented area.
Evaluation:
The final contour is extracted from the segmentation image. Average intensity of the area enclosed by the final contour and average intensity of a 20 pixel-wide contour band outside the contour is computed in the original fluorescence image for T/B ratio evaluation.
3. EXPERIMENT AND RESULTS
3.1. Mouse Brain Tumor Model
Animal experiments were performed according to the protocol approved by the IACUC of the St. Joseph’s Hospital and Medical Center (Phoenix, AZ). The mouse brain tumor model was created by injecting GL261-luc2 mouse glioma cells beneath the brain surface of C57bl6 mice [16]. Animal surgeries and mmSFE tumor imaging were carried out on 15th through 18th day after implantation allowing the tumors to grow. 5-ALA hydrochloride was injected intraperitoneally 2-6 hours or 24 hours prior to surgery to induce PpIX accumulation in the tumor. Tumor imaging using the mmSFE was performed in-vivo and rapidly after brain removal.
3.2. Configuration of the mmSFE System
The mmSFE system uses a short wavelength 405 nm laser for the excitation of the 5-ALA-induced PpIX with a 2.1 mm diameter forward-viewing scope probe. The reflectance and fluorescence light is collected and isolated into three different channels (red, green, blue) of the SFE using different photomultiplier tubes (PMTs) [17]. The red channel captures the emission light of 5-ALA-induced PpIX near the main emission peak (634 nm) and out to the minor near-infrared emission. The blue and green channel mainly collects the reflectance and any auto-fluorescence of the scene. The segmentation is performed on the red/fluorescence channel of the mmSFE image. We noticed that in the collected images, the red spectral channel interfered with the overlapping auto-fluorescence and reflectance in various levels, leading to the low signal to noise ratio in most of the raw fluorescence images.
3.3. Segmentation of Tumor Region in Fluorescence Images
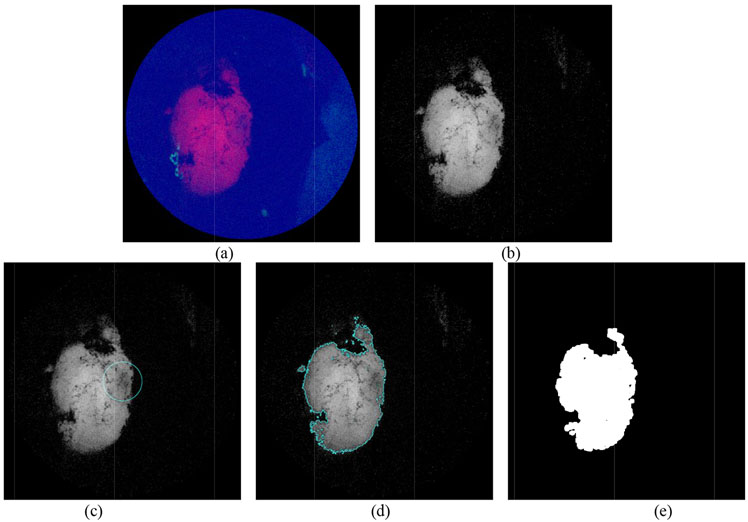
We used two types of level set function (a circle and a chessboard, see Fig. 1) as the initial guess. Both approaches worked well if enough iterations were given. The circular level set function converged slightly faster compared to the chessboard function in most of the images. The segmentation routine terminated in this experiment with a L2 error tolerance of 0.1 or the maximum iteration loop of 50 was reached. The speed of evolution mainly depended on noise level of the raw fluorescence image (i.e. the SNR in the raw gray image). More iterations are required to reach the same desired error tolerance when segmenting images with lower SNR. Figure 3 illustrates partial results starting from an initial input of a RGB mmSFE image.
Figure 3:
(a) Initial RGB image from SFE. (b) Red fluorescence channel of the image. (c) Initial guess of the boundary derived from a circular level set function (Fig.1) (d) boundary found after 4 iterations of segmentation algorithm with parameters of μ = 1, v = 125, λ1 = 2.0, λ2 = 2.1, dt = 0.1, h = 1 (e) Further smoothed contour and highlighted tumor region after a morphological transform.
As shown in Fig. 3b, the raw fluorescence image displays relatively high SNR, and thus the segmentation procedure is fast and straightforward, and the segmented region has high confidence for tumor tissue. However, most of the SFE images taken from the mouse brain model in this experiment contained different levels of background fluorescence, which could not be simply filtered by a median filter. In next section, we discuss the noise compensation method to improve the overall SNR of the image before applying the median filtering.
3.4. Rejection of Light Disturbance and Enhancement of the Signal to Noise Ratio
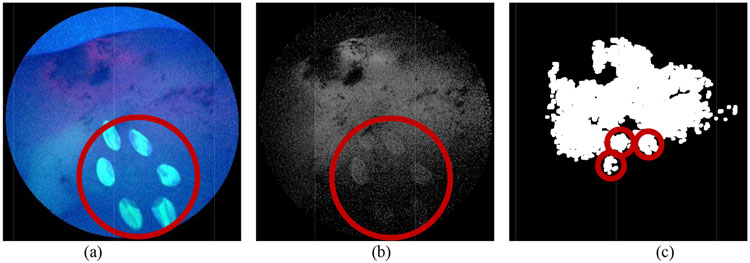
Background fluorescence in medical imaging comes from a variety of sources. The major external source is related to the imaging instrument setup and imaging parameters, such as the light from the excitation source, imaging distance, camera noise and environmental light. Another source is mainly due to the auto-fluorescence of the tissue samples or the fluorescence resulting from the fluorophores not bound to specific targets. In this experiment, we observed both types of background fluorescence in the SFE image data. An artificial source of fluorescence noise is from strong spectral fluorescence that occurs when the scanning laser illumination strikes the wet and shiny surface of the brain and reflects directly onto the six 0.5 mm diameter optical fibers. These fibers collect and return the light to the color separation system and fluorescence filters used in the green and red channels. The more intense excitation light does produce higher number of photons leaking through the laser rejection filters, resulting in an apparent fluorescence signal (Fig. 4 and Fig. 5). Below, we address the method to mitigate the background fluorescence introduced by the auto-fluorescence and the excitation source using the signals form the blue and green channel as correction references.
Figure 4:
(a) RGB SFE image with light disturbance from the excitation source (marked by the red circle). (b) Red channel fluorescence image with background fluorescence from excitation source. (c) Segmented region contains inaccurate classification of target. Red circles denote the segmentation from background fluorescence.
Figure 5:
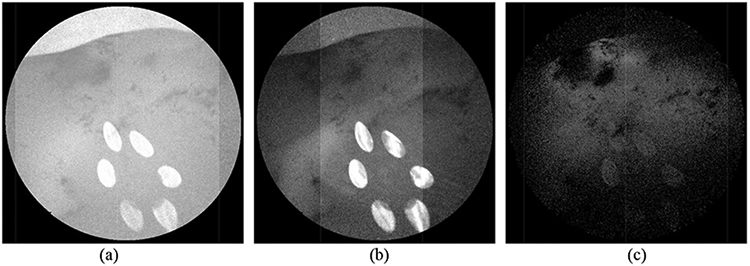
Signal intensity of Fig. 4a in each channel: (a) blue channel. (b) green channel (c) red channel
Fig. 4a and 4b show that both the original RGB SFE image and the red fluorescence image contain the reflection from the laser source, which leads to the inaccurate identification of the tumor region in the segmentation step as indicated in Fig. 4c. It is observed that both the blue (Fig. 5a) and green channel (Fig. 5b) of Fig. 4a contain the saturated reflection of the laser light, which is also partially collected by the red channel (Fig. 5c).
To mitigate the signal crosstalk between different channels, we use a correcting factor for enhancing the image contrast and mitigating the reflection and auto-fluorescence in the red channel. The correcting factor is defined as the intensity ratio between the red channel and the other channels, given as follows:
| (13) |
where b and g are weighting factors for the signal intensity in the blue and green channel, fB(x, y) and fG(x, y) respectively. In this study, we empirically pick b = 0.7 and g = 0.3. The red spectral signal is the multiplied by this correction factor, given as:
| (14) |
Fig. 6 below shows the processed fluorescence image (Fig.6a) and its segmentation (Fig.6b) of the target region indicating more confident identification compared to the previous result (Fig. 4c). A significant improvement of the SNR is resulted from 4.74 in Fig. 5c to 10.17 in Fig. 6a, which is characterized by the ratio between the average intensity of the fluorescence and background.
Figure 6:
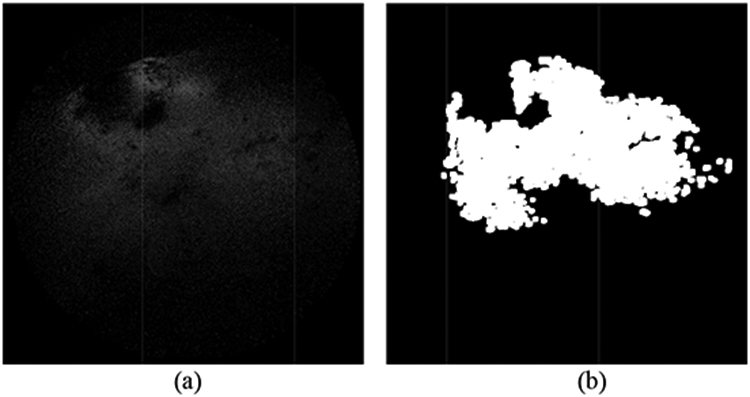
(a) Red fluorescence image after correction (b) segmentation of the improved image
3.5. Target to Background Ratio
We set the background size of 20 pixels outwards from the presumed tumor contour [19]. The ratio between the average tumor intensity and background intensity in the corrected red channel is computed as T/B ratio. Fig. 7 illustrates the mask of the target (white region) and background (gray region 20 pixel in width) from the segmentation.
Figure 7:
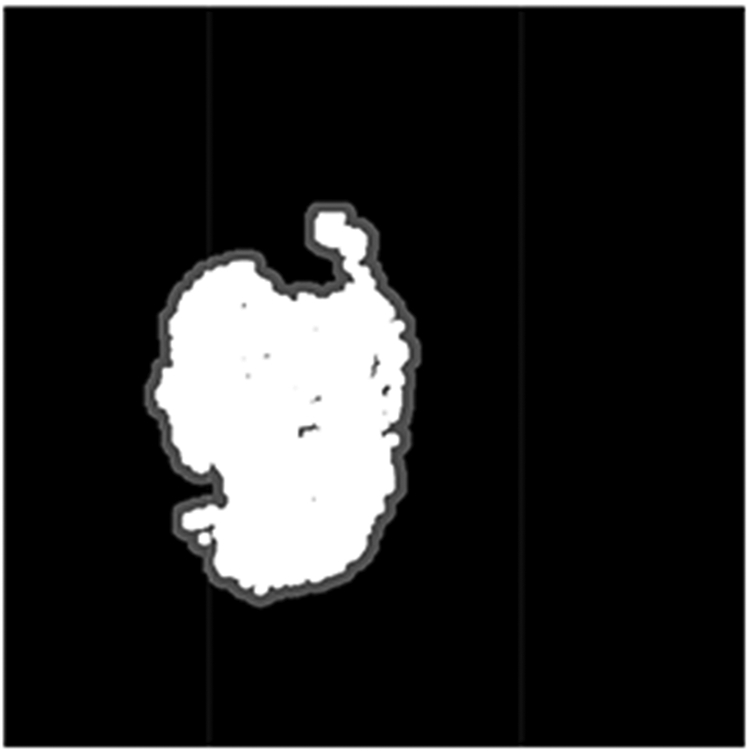
Mask of target (white) and background (gray) used for T/B ratio computation
T/B ration was analyzed in 30 images of mouse tumors taken by the SFE, the average and standard deviation were 2.87±1.08 (range of 1.95 - 6.92). This result approaches the T/B ratio observed in bench-top animal in-vivo spectral imaging instrument IVIS® (PerkinElmer, MA) for PpIX in the mouse brain tumor, average and standard deviation are 4.81±0.92 [18]. A direct comparison of the T/B ratio is difficult since the experiment setups were different, and the reported T/B ratio was calculated for the standard ROI versus contralateral brain, as opposed to the nearby brain in our study. Nonetheless, the results indicated a certain level of reliability of the segmentation.
As found in the previous section, the red fluorescence channel is often confounded with auto-fluorescence and strong reflections, which reduces the overall image quality. The compensation method proposed above not only improved the over all SNR of the image, but also improved the T/B ratio of the segmented region as the target signal was enhanced while the background noise was suppressed. The T/B ratio from 5 tumor specific fluorescence images showed an average of 17% improvement after applying the image correction.
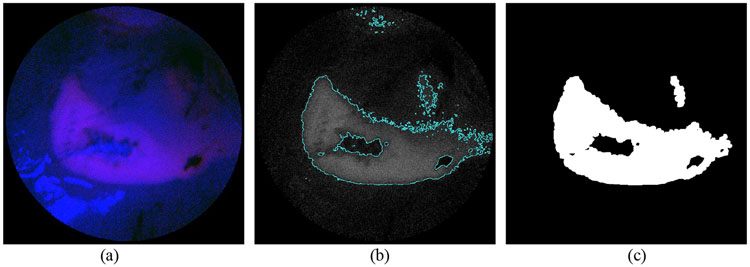
The segmentation and noise reduction methods discussed in this paper for T/B ratio classification are solely based on the captured light signal. However, in clinical settings, the T/B ratio also highly depends on the concentration level of PpIX, which correlates with histopathologic grades of malignancy in human gliomas [21]. It is found that in the mouse brain model used in this experiment, the accumulation level also varies in different regions of the brain. Some brain areas showed increased amount of non-specific accumulation of PpIX in normal brain tissue. Such areas could be detected in the SFE image as well, with a T/B ratio as high as 2.94 for the areas with highest intensity. Fig. 8 shows the detection of the non-specific accumulation of PpIX in normal brain tissue. The segmentation results in our study need to be further confirmed by surgeons and validated with histology to provide correlation with certain percentage of tumor versus normal brain cells.
Figure 8:
Detection of the non-specific accumulation of the PpIX. (a) Initial RGB SFE image indicating non-specific accumulation. (b) Segmentation of the red/fluorescence channel. (c) Finalized segmentation mask.
3.6. Processing speed
The processing algorithm is implemented in C++ using the openCV library [20] . For noisy images, a larger number of iterations are required to get reliable segmentation, whose execution time is linear with the total processing speed. The average processing time of 30 images with an image resolution of 608 x 608 pixel is ca. 0.65s/image when allowing maximal 10 iterations. The speed was measured on a Windows 10 system of 16 GB Memory and intel i7-2.8GHz-CPU. This speed can be further improved by enabling GPU computation at each numerical iteration, which is linear with the size of image pixels (608 x 608 pixels for the SFE images).
4. CONCLUSION AND FUTURE WORK
We demonstrate in this paper that the proposed algorithms can be used for tumor boundary identification in 5-ALA-induced-PpIX fluorescence images with quasi-real-time performance. Strong reflections and auto-fluorescence are mitigated in the fluorescence image to achieve robust automatic extraction of the fluorescence boundary. Both the processing speed and the robustness when dealing with low SNR images indicates the potential to integrate with automatic robotic residue brain tumor resection [22]. T/B ratio as a threshold value has reliably marked the tumor tissue boundary in both animal tumor models [18] and early stage human cancers [19] with a strong histopathological correlation. As follow-up work, our own histopathology testing will be conducted as ground truth for validating the reliability of the segmentation for the purpose of residual brain tumor clean-up. Moreover, imaging with NIR biomarkers such as Tumor Paint™ will be tested and compared.
ACKNOWLEDGEMENT
The authors thank Drs. Adrienne Scheck, Eric Woolf and Eric Miller for help with the mouse model. Appreciation goes to Dr. Leonard Nelson who optimized the mmSFE for fluorescence imaging of PpIX and brought the Arizona and Washington research groups together. Authors are also grateful for the support from the Barrow Neurological Foundation and the Newsome Family Endowment in Neurosurgery to Dr. Preul. This work is supported from NIH NIBIB R01 EB016457 “NRI-Small: Advanced biophotonics for image-guided robotic surgery”, NCI R01 CA200007 “Multiplexed imaging of biliary intra-epithelial neoplasia” and NCI BETRNet U54CA163059.
REFERENCE
- [1].Gioux S, Choi HS and Frangioni JV, “Image-guided surgery using invisible near-infrared light: fundamentals of clinical translation,” Molecular imaging, 9(5), p.237 (2010). [PMC free article] [PubMed] [Google Scholar]
- [2].Belykh E, Martirosyan NL, Yagmurlu K, Miller EJ, Eschbacher JM, Izadyyazdanabadi M, Bardonova LA, Byvaltsev VA, Nakaji P and Preul MC, “Intraoperative fluorescence imaging for personalized brain tumor resection: Current state and future directions,” Frontiers in Surgery, 3 (2016). [DOI] [PMC free article] [PubMed] [Google Scholar]
- [3].Butte PV, Mamelak A, Parrish-Novak J, Drazin D, Shweikeh F, Gangalum PR, Chesnokova A, Ljubimova JY and Black K, “Near-infrared imaging of brain tumors using the Tumor Paint BLZ-100 to achieve near-complete resection of brain tumors,” Neurosurgical focus, 36(2), p.E1 (2014). [DOI] [PubMed] [Google Scholar]
- [4].Stummer W, Pichlmeier U, Meinel T, Wiestler OD, Zanella F, Reulen HJ and ALA-Glioma Study Group, “Fluorescence-guided surgery with 5-aminolevulinic acid for resection of malignant glioma: a randomised controlled multicentre phase III trial,” The lancet oncology, 7(5), pp.392–401 (2006) [DOI] [PubMed] [Google Scholar]
- [5].Tonn JC and Stummer W, “Fluorescence-guided resection of malignant gliomas using 5-aminolevulinic acid: practical use, risks, and pitfalls,” Clinnical Neurosurgery, 55(3), pp.20–26 (2008). [PubMed] [Google Scholar]
- [6].Schucht P, Knittel S, Slotboom J, Seidel K, Murek M, Jilch A, Raabe A and Beck J, “5-ALA complete resections go beyond MR contrast enhancement: shift corrected volumetric analysis of the extent of resection in surgery for glioblastoma,” Acta neurochirurgica, 156(2), pp.305–312 (2014). [DOI] [PubMed] [Google Scholar]
- [7].Hadjipanayis CG, Widhalm G and Stummer W, “What is the surgical benefit of utilizing 5-aminolevulinic acid for fluorescence-guided surgery of malignant gliomas?,” Neurosurgery, 77(5), pp.663–673 (2015). [DOI] [PMC free article] [PubMed] [Google Scholar]
- [8].Lee CM, Engelbrecht CJ, Soper TD, Helmchen F and Seibel EJ, “Scanning fiber endoscopy with highly flexible, 1-mm catheterscopes for wide-field, full-color imaging,” Journal of biophotonics, 3(5-6), pp.385 (2010). [DOI] [PMC free article] [PubMed] [Google Scholar]
- [9].Yang C, Hou VW, Girard EJ, Nelson LY and Seibel EJ, “Target-to-background enhancement in multispectral endoscopy with background autofluorescence mitigation for quantitative molecular imaging,” Journal of Biomedical Optics, 19(7), 076014 (2014). [DOI] [PMC free article] [PubMed] [Google Scholar]
- [10].Balafar MA, Ramli AR, Saripan MI and Mashohor S, “Review of brain MRI image segmentation methods,” Artificial Intelligence Review, 33(3), pp.261–274 (2010). [Google Scholar]
- [11].Lee TH, Fauzi MFA and Komiya R, “Segmentation of CT brain images using unsupervised clusterings,” Journal of visualization, 12(2), pp.131–138 (2009). [Google Scholar]
- [12].Chan TF and Vese LA, “Active contours without edges,” IEEE Transactions on image processing, 10(2), pp.266–277 (2001). [DOI] [PubMed] [Google Scholar]
- [13].Mumford D and Shah J, “Optimal approximations by piecewise smooth functions and associated variational problems,” Communications on pure and applied mathematics, 42(5), pp.577–685 (1989). [Google Scholar]
- [14].Morel JM and Solimini S, “Variational Methods in Image Segmentation: With Seven Image Processing Experiments,” Progress in Nonlinear Differential Equations and Their Applications, Birkhauser; (1994). [Google Scholar]
- [15].Osher S and Sethian JA, “Fronts propagating with curvature-dependent speed: Algorithms based on Hamilton-Jacobi formulations,” Journal of Computational Physics, 79(1), pp. 12–49 (1988). [Google Scholar]
- [16].Martirosyan NL, Cavalcanti DD, Eschbacher JM, Delaney PM, Scheck AC, Abdelwahab MG, Nakaji P, Spetzler RF and Preul MC, “Use of in vivo near-infrared laser confocal endomicroscopy with indocyanine green to detect the boundary of infiltrative tumor: Laboratory investigation,” Journal of neurosurgery, 115(6), pp. 1131–1138 (2011). [DOI] [PubMed] [Google Scholar]
- [17].Timoshchuk MAI, Ridge JS, Rugg AL, Nelson LY, Kim AS and Seibel EJ, “Real-time porphyrin detection in plaque and caries: a case study,” Lasers in Dentistry XXI, Proc. of SPIE, Vol. 9306, 93060C (2015). [Google Scholar]
- [18].Swanson KI, Clark PA, Zhang RR, Kandela IK, Farhoud M, Weichert JP and Kuo JS, “Fluorescent cancer-selective alkylphosphocholine analogs for intraoperative glioma detection,” Neurosurgery, 76(2), p. 115 (2015). [DOI] [PMC free article] [PubMed] [Google Scholar]
- [19].Joshi BP, Duan X, Kwon RS, Piraka C, Elmunzer BJ, Lu S, Rabinsky EF, Beer DG, Appelman HD, Owens SR and Kuick R, “Multimodal endoscope can quantify wide-field fluorescence detection of Barrett’s neoplasia,” Endoscopy 48(02), pp.A1-A13 (2016). [DOI] [PMC free article] [PubMed] [Google Scholar]
- [20].Open Source Computer Vision, www.opencv.org [Google Scholar]
- [21].Valdes PA, “5-aminolevulinic-induced protoporphyrin ix fluorescence as an intraoperative biomarker for brain tumors: detection methods and biological correlates,” Dissertation, Dartmouth College; (2011). [Google Scholar]
- [22].Hu D, Gong Y, Hannaford B and Seibel EJ, “Semi-autonomous simulated brain tumor ablation with ravenii surgical robot using behavior tree,” IEEE International Conference on Robotics and Automation (ICRA), pp.3868–3875 (2015). [DOI] [PMC free article] [PubMed] [Google Scholar]


