

Abstract
Subjective measures of well-being are increasingly seen by scholars and policy makers as valuable tools to assess quality of life. Hedonic accounts focus on people’s experience of life in positive ways while eudaimonic accounts are concerned with realization of personal potential. However, to what extent do an “enjoyable” and a “flourishing” life overlap? Using an innovative clustering-and-projection technique (Self-Organized Map), the joint distributional patterns of multiple hedonic and eudaimonic well-being indicators were examined in a nationally representative longitudinal study of US adults (MIDUS). Results show that the two accounts largely converged with about 70% of the sample observations registering high/low scores in both well-being dimensions. However, the remaining 30% of respondents experienced divergent well-being levels. Association between these combined profiles and a series of socio-demographic characteristics and social stratification factors were investigated. Findings showed that chances of uniformly high well-being increase with age, while higher income, educational level, marriage, and being a female are linked to lesser probabilities of experiencing joint low well-being patterns. Experiencing a combination of high hedonic / low eudaimonic well-being was more frequent for less educated individuals, and men. Finally, the persistence over time of these combined well-being profiles was more frequent in case of convergent hedonic/eudaimonic levels. For divergent patterns we revealed substantial changes over a 10-year period with respondents registering low hedonic / high eudaimonic well-being at time t having greater chances of upward movement toward improved well-being compared to individuals who experienced high hedonic / low eudaimonic levels in the first time period.
Keywords: Well-being, Hedonic, Eudaimonic, Longitudinal
1. INTRODUCTION
Subjective measures of well-being have become valuable tools to assess the quality of human lives. They complement traditional welfare measures (e.g., income at the individual level, or GDP at the macro level) with subjective information that captures how people experience and evaluate their own lives. Such assessments can be used to shed light on factors that influence well-being and its dynamics over time as well as offering insights on how to promote human flourishing (Frey and Stutzer, 2010), which is of increasing concern among scholars and policy makers (OECD, 2013).
They are not, however, devoid of challenges, the first of which is deciding what subjective well-being means and how it should be measured. Such questions have become the focus of diverse theories and empirical investigations (Della Fave, 2016; Keyes et al., 2002; Ryff and Singer, 2008). Despite the variety of perspectives adopted by scholars, “the one thing they all have in common is the view that well-being is multi-dimensional” (Huppert and So, 2013, p.839).
Even though subjective well-being has been conceptualized in different ways, formulations normally follow two general traditions. One conceives well-being hedonically, formulated in terms of the predominance of positive over negative emotions and experiencing life satisfaction. The other focuses on well-being eudaimonically, as the attainment of full human capacities and realization of personal potential (akin to the daimon as conceived by Aristotle) (Ryan and Deci, 2001).
Attempts to jointly examine these two facets of well-being have generally concluded that their conceptualization and empirical analyses should be distinguished (Huta and Ryan, 2010). While growing evidence documents positive associations between different subjective indicators, it is increasingly acknowledged that they cannot be reduced to a single measure without losing information important for overall comprehension of well-being (Huppert and So, 2013). Nevertheless, it is still common practice to employ separate, single indicators (both hedonic and eudaimonic), which gives an incomplete view of the quality of human life and how it can best be fostered (OECD, 2013). This trend is particularly evident in the field of economics where most subjective well-being research has employed a single-item indicator of overall life satisfaction (Veenhoven, 2015).
Furthermore, even studies that have adopted a broader view and included larger numbers of items (Keyes et al., 2002; Diener et al., 2010; Huta and Ryan, 2010; Huppert and So, 2013; Su et al. 2014; Seligman, 2011), have relied on analytic methods to combine them that bring insufficient granularity to the question of integration – that is how specific underlying dimensions of hedonic and eudaimonic well-being come together across the population For instance, synthetic indices that collapse separate items into a single composite measure give insight on the extent to which they overlap, but convey little about the way they are combined, perhaps differently for distinct subgroups of individuals. The same is true as far as aggregates that sum up several different scales without exploring their specific contribution to the overall well-being levels are concerned (Keyes et al, 2002; Huppert and So, 2013). Such strategies give insight on the extent to which hedonic and eudaimonic composites are distinct or coincide, but not on how they relate as combinations of individual well-being subcomponents.
The increasing availability of data on a wide range of indicators in population-based samples allows for new advances built on reliable techniques of aggregating different well-being measures (Crivelli et al., 2016). The present study moves in this direction by bringing an innovative “aggregation” approach, namely the self-organized map, derived from a sophisticated clustering technique traditionally used in natural sciences (Kohonen, 2001). It allows for capturing the multidimensionality of the underlying latent concept of well-being and, so doing, enhances our comprehension of the ways in which different well-being indicators relate to each other, and importantly, how they come together. More precisely, the technique identifies distinct combinations of well-being at the level of single well-being items and, thus, allows us to identify well-being profiles that remain uncovered in prior approaches to integration. We then enrich understanding of these combinations with further analyses that examine the sociodemographic correlates of distinct combinations of hedonic and eudaimonic well-being as well as their cross-time dynamics.
To pursue these objectives, we include nine well-being indicators reflecting two different perspectives (hedonic and eudaimonic) on human well-being. More precisely, we examine their (joint) distributional patterns, and degrees of con/divergence, thereby, shedding light on the underlying structure of well-being. The longer-term objective is to analyze and reflect on whether such “agglomerative” approaches contribute to understanding of both the causes and consequences of people’s experience of their life quality.
The paper is structured as follows: section 2 below details the theoretical background of the study. Section 3 explicates the analytical approach adopted for joint analysis of hedonia and eudaimonia. Section 4 describes the data and variables used in the analysis. We then present the empirical results obtained in Section 5, and discuss them in Section 6.
2. THEORETICAL BACKGROUND
Research on subjective well-being grew exponentially in the second half of the last century as part of a broader movement seeking to identify effective ways of quantifying people’s quality of life and thereby improve public policies and social accountability (Bruni and Porta, 2016). Scholars in the field of psychology generally chose to treat well-being as an umbrella term composed of different dimensions which empirical research could help disentangle (Della Fave, 2016). In doing so, they followed two main traditions grounded on somewhat different views of the human nature: hedonism and eudaimonism- both inspired by ancient Greek philosophies regarding what constitutes a good human life (Ryan and Deci, 2001).
Hedonic well-being theories are primarily concerned with people’s experience of their lives in positive way (Diener, 1984). This implies a concern with the pursuit of pleasure and avoidance of pain, thus equating well-being to the predominance of positive over negative affective experience (Bradburn, 1969; Kahneman, 1999). Generally associated with these emotional components is a third, more cognitive element reflecting the evaluative judgement of (satisfaction with) one’s life as a whole (Andrew and Withey, 1976; Diener, 1984; Diener et al., 1999).
The positive and negative affective elements tend to capture the experience of pleasant and unpleasant emotions, such as joy, happiness, and contentment, or alternatively, sadness, anxiety, and anger. Although their correlation with personality traits such as extraversion and neuroticism suggests a certain level of stable heritable predisposition (Schimmack et al., 2008), normally they are measured with reference to a particular point in time (last week or month). There is now a general agreement among scholars that positive and negative affective states should not be simply conceived as opposites (Bradburn, 1969; Arthaud-Day et al., 2005) as they appear to be the product of different biological processes and motivational systems, and can occur independently, or even simultaneously (Watson et al., 1988). In contrast, overall assessment of quality of life aims to capture a longer-term perspective as well, hence, the personal evaluation of satisfaction with one’s life circumstances, (Pavot and Diener, 1991). This tripartite conceptualization is generally referred to as subjective well-being (HWB) and has been confirmed in various studies (Diener, 1984; Diener et al. 1999; Diener et al., 2000; Arthaud-Day et al., 2005).
The second, eudaimonic approach, goes in different directions, as it conceives well-being not to be reducible to the subjective experiences of pleasure and contentment but rather emphasizes the full development of human capacities and potential (Ryff, 2018). From this perspective, a “good life” implies realization of a person’s true nature (in Aristotelian terms, one’s daimon) in a process of “flourishing” that is not confined to the pursuit of positive emotional states but rather concerned with the achievement of excellence (Ryan and Deci, 2001; Ryff and Singer, 2008).
In the present study, we adopt a view of eudaimonia based on a model of psychological well-being (EWB) that aims to assess the degree to which a person is fully functioning, including in contexts of challenges or adversity (Ryff, 1989; Ryff, 2014; Ryff, 2018). Integrating elements from developmental, clinical, existential, and humanistic psychology theories (e.g., Allport, 1961; Buhler, 1935; Erikson, 1959; Frankl, 1959; Jahoda, 1958; Jung, 1933; Maslow, 1968), this formulation focuses on six main dimensions of well-being: autonomy, environmental mastery, personal growth, positive relations with others, purpose in life, and self-acceptance (Ryff, 1989). This view of human well-being accords with the Aristotelian idea of eudaimonia as the “highest human good”. It goes beyond the satisfaction of appetites and experience of pleasure. Happiness, in this perspective, rather is concerned with the realization of one’s true nature and full potential (Ryff and Singer, 2008).
Several studies using population-based samples have confirmed empirically the distinctiveness of these two traditions of well-being. Applying exploratory factor analysis to data collected during the third wave of the European Social Survey (ESS) for a representative sample of 23 European countries, Huppert and So (2013) found evidence of the existence of distinct eudaimonic and hedonic latent well-being factors. However, it is worth noting that attributes of flourishing including both HWB and EWB dimensions did not meet rigorous psychometric standards as of data availability issues that only allowed operationalization through single items available in the ESS.
High quality measures of both HWB and EWB informed another research that examined combinations of hedonia and eudaimonia at the level of overall composites of the two types of well-being (Keyes et al., 2002). Employing confirmatory factor analysis with nationally representative U.S. sample, Keyes and colleagues found that eudaimonic and hedonic indicators loaded on two distinct latent factors which correlated 0.45.
Similar results were obtained by Gallagher and colleagues who also used confirmatory factor analysis and found that the best fitting model was the one keeping these two dimensions of well-being separate (Gallagher et al., 2009). This higher-order factor structure of HWB and EWB has been further confirmed in a series of UK samples (Linley et al., 2009). Implementing a bi-factorial model that allows analyzing both the shared variance between the two types of well-being measures, and their unique contributions, Chen and colleagues confirmed the predictive power of the independent hedonic and eudaimonic factors (Chen et al., 2012).
The distinctiveness of hedonic and eudaimonic well-being dimensions found in this prior literature confirms the need to examine them jointly as overall facets of the quality of human life. Attempts of combined analyses have been done, for instance, in investigations on how positive and negative aspects of mental health come together. The Mental Health Continuum approach (Keyes, 2002; 2007) categorizes individuals as “flourishing”, “languishing” or experiencing “moderate mental health” based on whether they score in the upper, medium or low tertiles of a number of hedonic, eudaimonic, and social well-being items. The typology of mental well-being and ill-being it proposes does not, however, address underlying components and their specific combinations within the major categories of mental health. Keyes et al. (2002) investigated combinations of HWB and EWB based on the tertile standing in their respective summed scales. Although giving some valuable insights such aggregation approach provides no information on the specific contribution of the single subcomponents to the overall scores, and thus on how they come together in a more fine-grained picture of human well-being.
To this prior literature, we therefore bring an alternative set of questions: namely, how do these differing components of well-being come together? That is, our overarching questions are: (1) what are commonly occurring combinations of hedonic and eduaimonic well-being and what the specific contribution of their subcomponents, and (2) how are these well-being profiles distributed in the general population? To examine the latter, we focus on how different varieties of well-being are evident in population subgroups defined by sociodemographic characteristics, such as age, gender, marital status, and educational and employment status. Because the data employed are longitudinal, we also examine cross-time dynamics in these various combinations of well-being.
3. DATA AND VARIABLES
We use data from the Midlife in the U.S. (known as MIDUS) a national longitudinal sample of adults. More precisely, we analyze data collected during the second (2004/2005), and third (2012–2013) waves of the study. Respondents were first administered a phone interview and then asked to complete a self-administered questionnaire. For present analyses, we selected a sample of 2,393 respondents aged 30 to 93, who completed both the phone interview and self-assessed questionnaire at wave 2 and wave 3. We do not include the baseline data because the assessment of well-being was notably limited at wave 1.
For the construction of the self-organized map, we used a total of 9 well-being scales: three hedonic or HWB ones, and six eudaimonic or EWB ones. Detailed summary statistics are reported in Table 4 in the Appendix.
Hedonic Well-Being included three distinct measures: a single-item indicator of overall satisfaction with life measured on a 10-point Likert scale ranging from 0 (not at all) to 10 (completely satisfied); a 6-item positive affect scale assessing the frequency with which the respondent has felt: cheerful, in good spirits, extremely happy, calm and peaceful, satisfied, and full of life, during the past 30 days; a 6-item negative affect scale reporting the frequency with which in the past 30 days the respondent felt: so sad nothing could cheer you up; nervous; restless or fidgety; hopeless; that everything was an effort; worthless (Bradburn, 1969). All PA and NA items were reported on a 5-point Likert scale ranging from 1 (all the time) to 5 (none of the time). Items were then recoded so that higher scores reflect high levels of positive emotions / low levels of negative emotions. Alpha coefficients for positive and negative affect are 0.91 and 0.83, respectively.
Eudaimonic Well-Being is composed of six distinct dimensions: autonomy, environmental mastery, personal growth, positive relations with others, purpose in life, self-acceptance (Ryff, 1989; Ryff, 2014). Each of these components is operationalized through 7 self-reported items assessed on a seven-point Likert scale ranging from 1 (agree strongly) to 7 (disagree strongly). The separate dimensions refer to the degree to which respondents are: self-determined and live according to their personal convictions (autonomy); able to shape and manage their surrounding reality and, thus, meet personal needs and desires (environmental mastery); use and develop their specific potential and talents (personal growth); manage to build and maintain solid and trusting relationships with significant others (positive relations with others); find meaning, direction and purpose in their lives (purpose in life); feel good about themselves, with awareness of both their strengths and weaknesses (self-acceptance). All six EWB scales present good psychometric properties (alpha coefficients range from 0.71 for the autonomy scale, up to 0.85 for the self-acceptance one).
4. ANALYTICAL STRATEGY
We implemented the Self-Organized Map (SOM) clustering technique that allows for display of complex data on a planar grid preserving its multidimensionality. Based on an artificial neural network algorithm developed by Teuvo Kohonen (Kohonen, 1982, 2001), the objective is to extract meaningful patterns from high dimensional input data and project them in an orderly fashion in a lower dimensional output space. The resulting self-organized map provides a compact visualization of the combined distributional patterns of a wide range of indicators (in our case, nine variables reflecting hedonic and eudaimonic aspects of human well-being) that can facilitate the identification of their underlying structure, and thus comprehension of the latent phenomenon.
This low-dimensional projection of the high-dimensional input data, is one of the appealing features of the SOM technique. It normally takes the form of a two-dimensional grid composed of a number of units or nodes (which we will also call micro clusters) that attract observations characterized by similar combinations of attributes. Their extraction from the input data is obtained through an iterative learning process. In its end, each node in the map is assigned a specific weight vector with respect to which the input units are assigned to their, so called, best matching unit (BMU). The weight vectors are continuously updated according to a set of rules aimed at maximizing both the discriminatory power of the SOM, and its degree of topology preservation1. The latter characteristic of the map guarantees that observations close in the input space (thus, presenting similar levels in the nine analyzed well-being indicators) are located in a spatially contiguous micro clusters. Therefore, adjacent nodes in the final self-organized map have more similar well-being attributes than more distant ones.
In summary, the SOM technique allows for partitioning of the input data with minimal set of assumptions required, and visualization of the combined patterns of a wide range of indicators of interest. This distinguishes it both from the bivariate analysis of numerous correlations between pairs of single well-being indicators, and correlations between scales summing up several different attributes. It differs from synthetic indexes in its ability to preserve the multidimensional nature of the data examined, and project it into two-dimensional space.
The implementation of such analytic strategy allows us to distill different varieties of combined well-being profiles at the level of individual components of hedonic and eudaimonic well-being, and thereby obtain a finer-grained picture of how they come together across the population. Thus, the SOM can give a further empirical confirmation of the multidimensionality of well-being in a way that is more nuanced than any prior effort to combine hedonia and eudaimonia. It is fundamentally a move away from formulating combinations of well-being as blends of aggregate categories and toward blends of well-being as fine-grained combinations of underlying components.
5. EMPIRICAL RESULTS
For the training of our well-being self-organized map, we used as input vectors the nine EWB and HWB indicators described above for a balanced panel sample of 2,393 individuals and a total of 4,786 observations. By applying the SOM clustering algorithm we reduced the multidimensional space of the original data to a two-dimensional (5 × 13) lattice, organized in a total of 65 micro clusters or nodes. The goodness of fit of the final map was evaluated through its quantization and topographic errors2.
Our analysis of the final SOM starts with an inspection of its component planes that give insight about the underlying structure and meaning of the map. These specialized graphs illustrate the value taken by every element of the final weight vectors obtained through the SOM training algorithm, thus providing a sort of “sliced” version of the final map that offers a visual representation of the distributional patterns of all input indicators across the output grid.
As such, the component planes show how the nine well-being variables we examine are combined in each of the SOM’s micro clusters. In this sense, they differ from both the single scales’ distributions, and the joint distributions of pairs of well-being indicators. At the same time, unlike the case of bivariate analysis of overall aggregates, they afford a clearer idea of the contribution of every single well-being dimension to the joint distributional patterns of hedonia and eudaminia.
Figure 1 reports the single planes for all nine well-being variables used for the construction of the SOM. Via use of scale colors, we identify areas in the map characterized by different levels taken by each of the EWB and HWB indicators ranging from minimum ones depicted in blue to maximum depicted in red. The values of the single components are de-normalized and presented in their original value range.
Fig. 1.
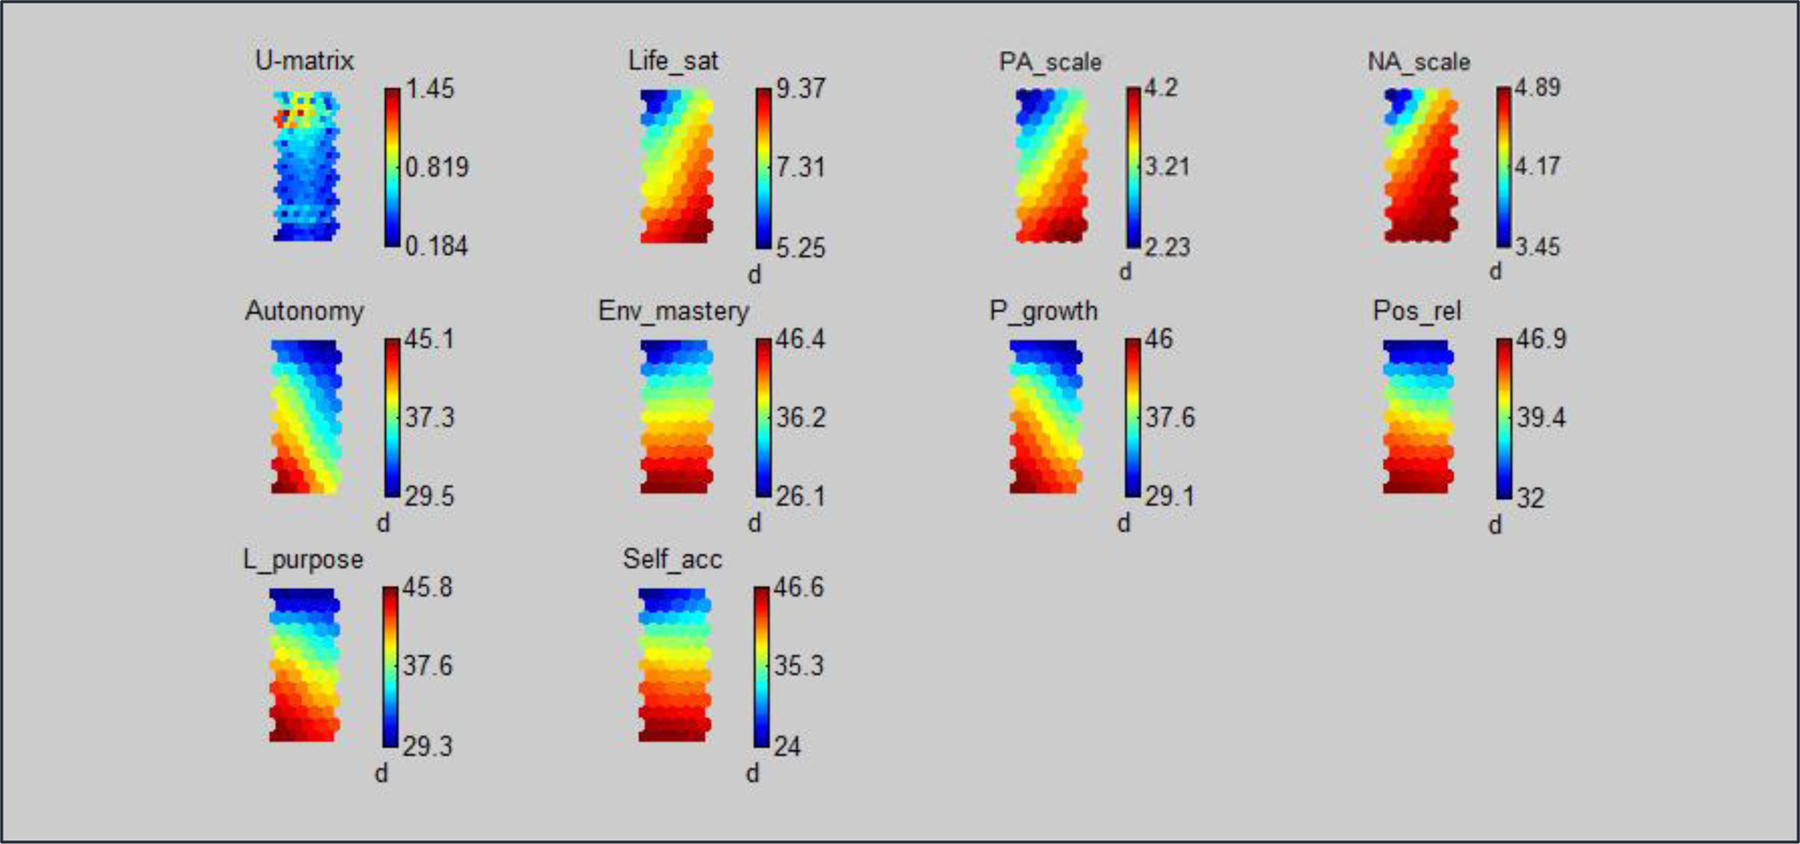
Component planes for the nine well-being (hedonic and eudaimonic) items
Hedonia and Eudaimonia joint distributional patterns
Reading from left to right by row, what is evident is that the three HWB variables follow very similar patterns with highest scores concentrated in the entire lower right part of the map, and progressively decreasing moving on the diagonal towards the upper left hand-side where we find the lowest HWB levels. Life satisfaction and positive affect present almost perfectly overlapping distributional patterns, while the negative affect scale occupies more extensive areas with high average scores (and, thus, low frequency of experience of negative emotions).
Regarding the EWB dimensions, for two of them – personal growth and life purpose – we find highest values concentrated in the micro clusters allocated in the lower left hand-side of the map and progressively decreasing moving on the diagonal towards the upper right hand-side (thus, in the opposite direction with respect to the three HWB indicators described above). For the autonomy scale, such horizontal discrimination pattern is even more pronounced, with only a few micro clusters presenting high autonomy scores and concentrated in the lower left hand of the map.
The remaining three EWB indicators - environmental mastery, positive relations with others, and self-acceptance - follow overlapping, somewhat intermediate distributional patterns. Specifically, they change monotonically over the vertical axis from high levels concentrated in the lower half of the map and medium to low ones- occupying the upper half.
This fine-grained and nuanced profiling of how the nine dimensions we examine come together, gives an initial (visual) confirmation of the multidimensionality of the latent well-being phenomenon confirming the need to distinguish profiles that combine different hedonic and eudaimonic levels.
We then proceed with combining the 65 micro clusters in a lower number of macro areas characterized by similar well-being trends. In this way, based on the initial aggregation offered by the SOM technique, we are able to identify some overall blended profiles of hedonia and eudaimonia that collect observations with similar levels of all nine well-being scales under investigation. Although such aggregation leads to a reduction in terms of multidimensionality, it allows for a simplified view of the general well-being forms and patterns present in the data.
To aggregate the micro nodes, we implemented a hierarchical clustering technique (average-linkage method) that conducts a progressive merging of the single map cells in larger clusters. A noticeable gap between adjacent coefficients in the agglomeration schedule was registered when the number of groupings was equal to 4. These macro clusters corresponded to areas in the SOM with increasing overall levels of well-being, starting from the zone in the upper part of the map with lowest well-being levels, down to the nodes situated in its lower part characterized by high well-being scores. However, for our analysis, consideration was given to a further split in the “intermediate” well-being macro cluster so as to explore in greater detail the areas in the map characterized by divergent EWB and HWB levels which we already briefly discussed above. A visual representation of the SOM split is displayed in Figure 2 where the 5 macro clusters indexed with numbers ranging from 1 (for the macro cluster aggregating the cells located in the upper part of the map) to 5 (for the macro clusters occupying the bottom part of the map)3.
Fig. 2. Aggregation of the 65 micro clusters into five macro clusters or prototypical area.
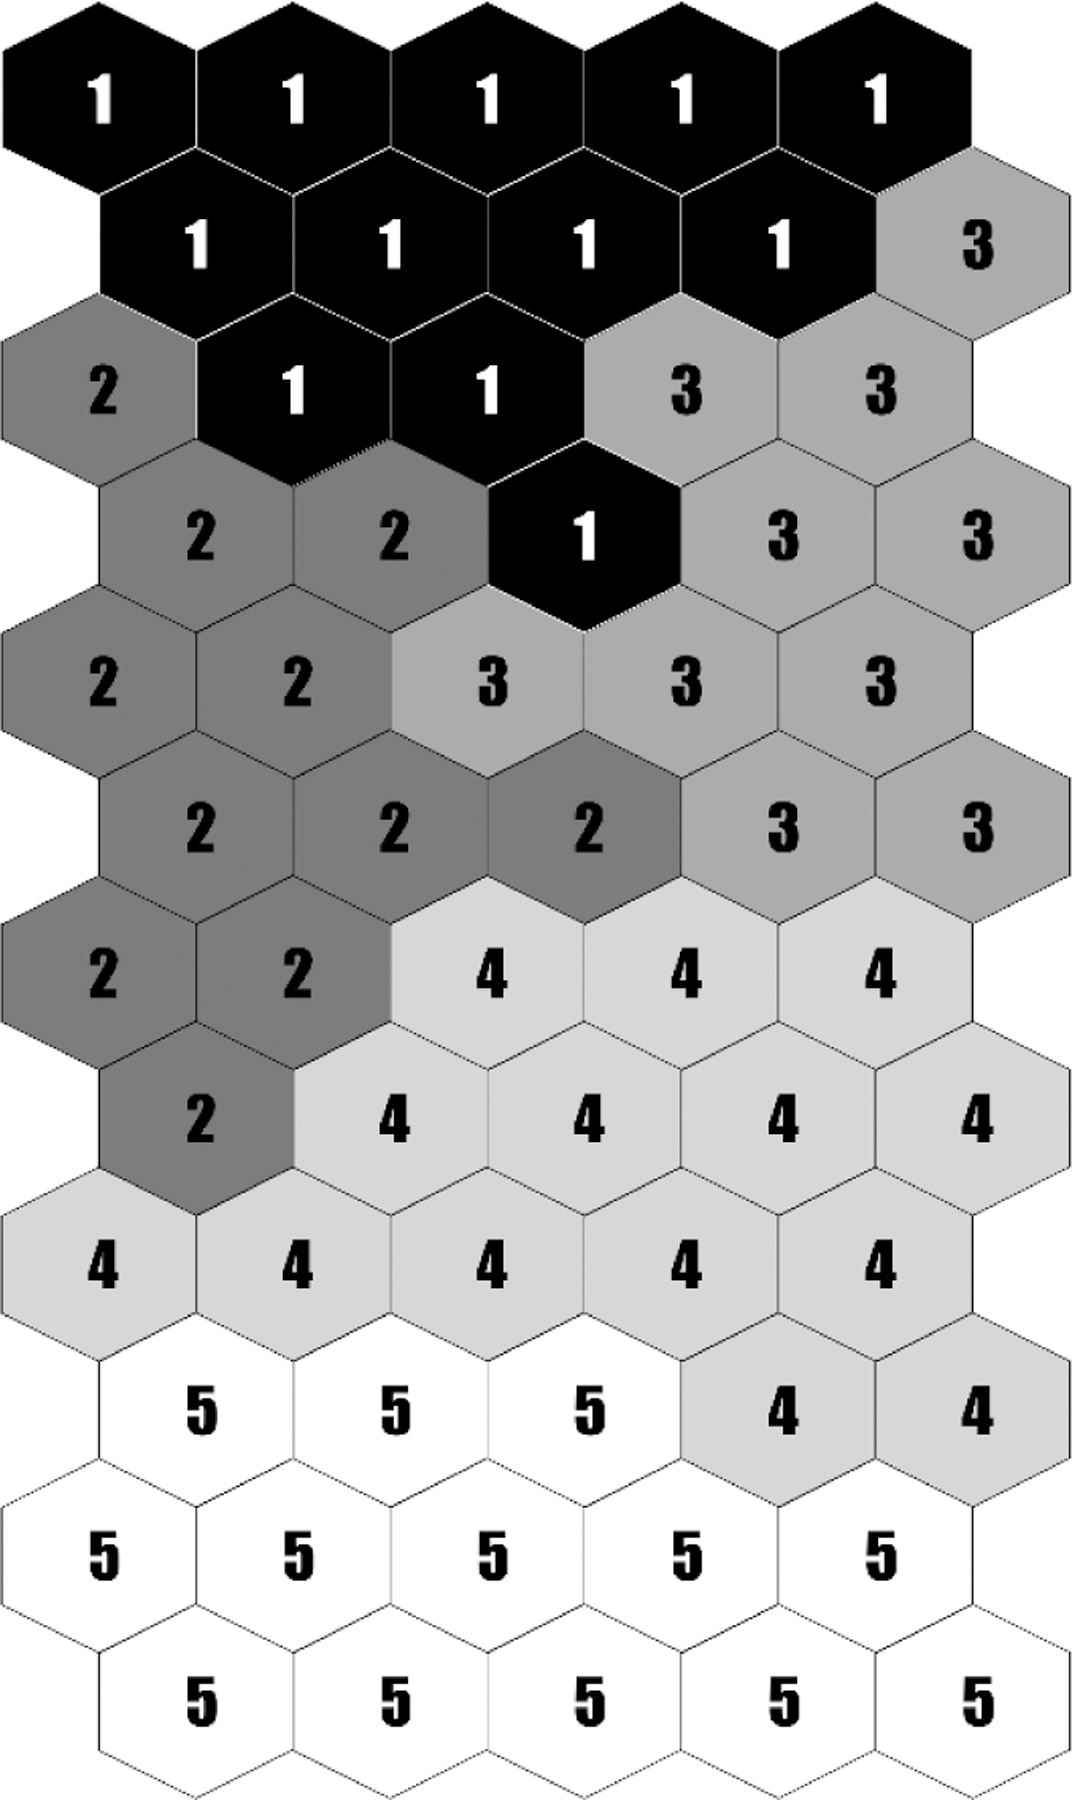
Cluster 1: Uniformly Low Well-Being Cluster (ULWB);
Cluster 2: Mixed High EWB/Low HWB (PWB>SWB);
Cluster 3: Mixed High HWB/Low EWB (SWB>PWB);
Cluster 4: Somewhat High Well-Being Cluster (SHWB);
Cluster 5: Mostly High Well-Being Cluster (MHWB);
To validate the choice taking separately into account the two intermediate well-being clusters showing divergent hedonic and eudaimonic well-being levels, we performed independent t-tests for each of the nine well-being indicators, confirming that all of them differ significantly between the high-EWB/low-HWB and low-EWB/high-HWB macro clusters. Moreover, we projected the five macro clusters onto a two-dimensional space by using the multidimensional scaling algorithm (Torgerson, 1952) which further confirmed the contrast existing between the two mixed (high EWB/low HWB; high HWB/low EWB) well-being clusters (2 and 3), and thus the choice to examine them separately. Table 1 reports the average levels of all nine well-being indicators per single macro cluster, the sample means for every well-being dimension, as well as the frequency distributions of these macro clusters.
Table 1.
Average scores of well-being indicators within each macro cluster
| Well-Being Indicator | CLUSTER 1: ULWB | CLUSTER 2: EWB>HWB | CLUSTER 3: HWB>EWB | CLUSTER 4: SHWB | CLUSTER 5: MHWB | Sample Mean |
|---|---|---|---|---|---|---|
| Life Satisfaction | 6.52 | 7.39 | 8.30 | 8.66 | 8.90 | 7.9 |
| Positive Affect | 2.71 | 3.10 | 3.65 | 3.86 | 3.95 | 3.5 |
| Negative Affect | 4.02 | 4.36 | 4.69 | 4.80 | 4.84 | 4.5 |
| Autonomy | 32.16 | 39.56 | 33.44 | 38.44 | 42.91 | 37.3 |
| Environmental Mastery | 29.86 | 37.54 | 36.88 | 42.77 | 45.99 | 38.7 |
| Personal Growth | 31.80 | 41.29 | 34.64 | 41.09 | 45.07 | 38.8 |
| Positive Relations | 33.51 | 41.56 | 38.31 | 44.34 | 46.50 | 40.9 |
| Purpose in Life | 31.07 | 40.45 | 35.19 | 41.83 | 45.03 | 38.7 |
| Self-acceptance | 27.97 | 38.98 | 35.98 | 42.80 | 46.28 | 38.4 |
| Observations | 1,130 | 752 | 693 | 1,299 | 912 | 4,786 |
| % | 23,61 | 15,71 | 14,48 | 27,14 | 19,06 | 100.00 |
Cluster 1, referred to as Uniformly Low Well-Being (ULWB), incorporates the nodes situated in the upper part of the self-organized map. It contains 23.6% of all sample observations, and is characterized by the lowest scores registered on all nine well-being dimensions. Examining the distribution of the single well-being scales that compose this macro cluster, the pattern is most pronounced for three of the EWB dimensions: purpose in life, environmental mastery, and self-acceptance, in which about 90–95% of the respondents score below the sample mean. Among the HWB indicators, the same is true for the positive affect scale. For the other well-being indicators, this percentage is slightly lower, but for all of them at least 75% of the cluster observations fall below the sample average. In sum, these are individuals with notably low well-being across all dimensions.
-
Cluster 2 and Cluster 3 aggregate the micro nodes characterized by divergent EWB/HWB patterns. They occupy the left and the right central hand-sides of the self-organized map, respectively. Cluster 2 incorporates 15.7%, and Cluster 3 – 14.5% of all sample observations.
In Cluster 2, referred to as Mixed High EWB/Low HWB (EWB>HWB), the average scores of all EWB dimensions, except environmental mastery, are higher than the sample means, while the opposite is true for the three HWB indicators. Examining the single scales’ distributions, we see that this trend is particularly pronounced for the autonomy, personal growth, and purpose in life scales where at least 75% of the observations incorporated in this macro cluster are higher than the sample mean. At the same time, the median levels on both life satisfaction and negative affect scales are lower than average, while for the positive affect one the percentage is even higher (75%). In other words, these are individuals whose eudaimonic well-being tends to be higher than their hedonic well-being.
In contrast, Cluster 3, referred to as Mixed High HWB/Low EWB (HWB>EWB), is characterized by higher than average scores on all three HWB indicators. More than 75% of the life satisfaction and negative affect observations incorporated in this macro cluster are above average, and more than half of them in the case of the positive emotions registered by the respondents. At the same time, the cluster’s average scores on all six EWB dimensions fall below the sample mean. As in the case of Cluster 2, this trend is particularly evident for three of them, namely, autonomy, personal growth, and purpose in life for which ¾ of the cluster observations are lower than the sample mean. Thus, these individuals are characterized by relatively high hedonia and low eudaimonia.
Cluster 4 (Somewhat High Well-Being: SHWB) and Cluster 5 (Mostly High Well-Being: MHWB) together account for almost half of the sample observations, and are characterized by above average scores on all nine well-being indicators (both EWB and HWB ones). Cluster 5 is the “best” in terms of well-being across all dimensions, where at least 90% of the cluster observations in all, except autonomy, are higher than the sample mean. For Cluster 4 such percentage is somewhat lower for some of the EWB dimensions such as autonomy, personal growth and purpose in life, but is still as high as 75% of all observations being above average. In sum, these two clusters characterize individuals who have largely positive profiles of well-being overall, albeit at somewhat different levels.
To sum up, the combined well-being patterns identified through this simplified version of the SOM show that one out of four respondents in our nationally representative sample experiences uniformly low hedonic and eudaimonic well-being (cluster 1), while one in three individuals register either uniformly high (clusters 4 and 5) or mixed well-being levels (clusters 2 and 3).
To better characterize the well-being clusters and examine their relationships with a range of observable heterogeneity factors, we run a multinomial logit regression using as a base category the macro cluster containing the greatest number of observations: SHWB cluster (4). More precisely, we explore the extent to which the different well-being patterns identified through the application of the SOM technique are shaped by a series of socio-demographic characteristics (such as age, gender, marital status, and number of children), and social stratification variables (such as educational level, employment status, and position in the income distribution). For greater accuracy of results, two control variables, namely, self-rated physical health and personality traits are included in the regression analyses, which were run on a balanced panel subsample of 1,778 individuals for a total of 3,556 observations. Results are reported in Table 2.
Table 2.
Multinomial Logit Regression Well-Being Macro-clusters (ref.cat. Cluster 4)
| Variables | CLUSTER 1: ULWB | CLUSTER 2: EWB>HWB | CLUSTER 3: HWB>EWB | CLUSTER 5: MHWB |
|---|---|---|---|---|
| Age Group | ||||
| 30–50 years (ref.cat.) | ||||
| 51–59 years | −0.25 | −0.19 | −0.16 | 0.17 |
| (0.16) | (0.15) | (0.17) | (0.16) | |
| 60–67 years | −0.80** | −0.56** | −0.29 | 0.21 |
| (0.21) | (0.18) | (0.20) | (0.18) | |
| >68 years | −1.13** | −0.82** | −0.61* | −0.00 |
| (0.27) | (0.23) | (0.27) | (0.22) | |
| Gender | ||||
| Male (ref.cat.) | ||||
| Female | −0.56** | −0.22 | −0.48** | −0.04 |
| (0.16) | (0.14) | (0.15) | (0.13) | |
| Marital status | ||||
| Married (ref.cat.) | ||||
| Separated | 0.19 | 0.81 | 0.59 | −0.48 |
| (0.51) | (0.45) | (0.50) | (0.63) | |
| Divorced | 0.78** | 0.62** | 0.43* | −0.30 |
| (0.21) | (0.19) | (0.21) | (0.20) | |
| Widowed | 1.16** | 0.90** | 0.42 | 0.17 |
| (0.31) | (0.26) | (0.31) | (0.26) | |
| Never married | 1.09** | 0.34 | 0.64* | −0.24 |
| (0.29) | (0.26) | (0.28) | (0.28) | |
| Number of children | −0.02 | −0.07 | 0.02 | 0.01 |
| (0.05) | (0.04) | (0.04) | (0.04) | |
| Level of Education | ||||
| High school or less (ref.cat.) | ||||
| Undergraduate degree | −0.28 | −0.00 | −0.30* | 0.05 |
| (0.16) | (0.14) | (0.15) | (0.14) | |
| Postgraduate degree | −0.46* | 0.13 | −0.57** | 0.00 |
| (0.22) | (0.17) | (0.19) | (0.16) | |
| Employment status | ||||
| Employed (ref.cat.) | ||||
| Self-employed | −0.26 | −0.10 | −0.20 | 0.18 |
| (0.21) | (0.17) | (0.21) | (0.16) | |
| Unemployed | 1.61** | 1.26** | 0.90 | 0.11 |
| (0.50) | (0.46) | (0.57) | (0.60) | |
| Retired | −0.29 | −0.09 | 0.37 | 0.23 |
| (0.22) | (0.18) | (0.20) | (0.17) | |
| Disabled | 1.19 | 0.82 | 1.11 | 0.65 |
| (0.91) | (1.00) | (0.98) | (1.00) | |
| Out of labor force | 0.22 | −0.07 | 0.54* | 0.14 |
| (0.27) | (0.26) | (0.27) | (0.23) | |
| Income quantiles | ||||
| Quantile 1 (ref.cat.) | ||||
| Quantile 2 | −0.59** | −0.33 | −0.27 | −0.03 |
| (0.20) | (0.18) | (0.20) | (0.20) | |
| Quantile 3 | −0.65** | −0.16 | −0.05 | 0.37 |
| (0.21) | (0.20) | (0.21) | (0.20) | |
| Quantile 4 | −0.68** | −0.29 | −0.03 | 0.11 |
| (0.23) | (0.20) | (0.21) | (0.21) | |
| Quantile 5 | −0.81** | −0.34 | −0.14 | 0.33 |
| (0.24) | (0.22) | (0.23) | (0.21) | |
| Observations | 1787 | 1590 | 1464 | 1661 |
| Individuals | 1268 | 1119 | 1045 | 1045 |
Robust standard errors in parentheses; significance levels:
p<0.01;
p<0.05.
Control variables included (but not reported): self-assessed health; Big Five Personality traits4; wave dummies.
Pseudo R2 = 0.231
Socio-demographic characteristics
Regarding socio-demographic characteristics, results suggest that the probability of registering higher both hedonic, and edudaimonic well-being scores increases with age. With respect to the reference category (30–50 years old), chances of membership in the ULWB cluster (1), as well as the mixed EWB>HWB cluster (2) are significantly lower for respondents 60 years and older. For the mixed HWB>EWB cluster (3) such probability is significantly lower only for respondents in the oldest age category (>68 years old). We find no evidence of age having discriminatory power between the two high well-being clusters (4 and 5).
Regarding gender, membership in the lowest well-being cluster (1) is less probable for women. Moreover, females have lower chances of being located in the mixed HWB>EWB cluster (3) compared to males.
Marital status appears also to be an important predictor of membership in the various well-being clusters. With respect to the reference category of married individuals, we find a positive relationship, thus greater chances of membership, of divorced and widowed respondents in the ULWB cluster (1). Such association is found also with respect to the mixed EWB>HWB cluster (2), while for the opposite, mixed HWB>EWB one it holds only with respect to divorced respondents. Never married respondents also register greater chances of experiencing uniformly low (cluster 1) or mixed HWB>EWB (cluster 3) profiles if compared to married ones. No significant relationship is found with respect to the number of children of the respondent.
Socio stratification variables
Among the social stratification variables included as covariates in our regression analysis, level of education is significantly associated with membership in the ULWB cluster (1) and the mixed HWB>EWB cluster (3). Respondents with postgraduate degree are less likely than ones with only high school diploma or less, to score low in both HWB and EWB dimensions. At the same time, both undergraduate and postgraduate degrees appear to lower the chances of membership in cluster (3) characterized by high hedonic but low eudaimonic well-being levels.
Almost no statistically significant association is found with respect to the employment status of the respondent, except for the unemployed having higher probability of membership in the mixed EWB>HWB cluster (2)5, and retired and out of the labor force individuals being slightly more likely, with respect to the reference category of employed ones, to be located in the mixed HWB>EWB cluster (3).
Finally, income seems to have “protective role” as far as membership in the ULWB cluster (1) is concerned, with respondents located in higher income quintiles being less likely to register both low HWB, and low EWB.
Stability of Well-Being Clusters Over Time
Given the availability of longitudinal data, we explore the dynamic of persistence and movement of people over time across the multidimensional space of well-being. Table 3 reports the transition matrix from time t to time t+1 showing the probabilities (pij) of moving to state j conditional on starting in state i.
Table 3.
Unconditional transition probabilities from t to t+1 (Balanced sample of 1,778 id and 3,556 obs.)
| (t) | (t+1) | |||||
|---|---|---|---|---|---|---|
| Cluster 1 | Cluster 2 | Cluster 3 | Cluster 4 | Cluster 5 | Total | |
| Cluster 1: ULWB | 66.02 | 10.04 | 18.34 | 4.83 | 0.77 | 100.00 |
| Cluster 2: Mixed EWB>HWB | 23.42 | 31.62 | 8.20 | 25.29 | 11.48 | 100.00 |
| Cluster 3: Mixed HWB>EWB | 27.78 | 8.19 | 34.80 | 25.44 | 3.80 | 100.00 |
| Cluster 4: SHWB | 10.33 | 10.64 | 13.77 | 44.29 | 20.97 | 100.00 |
| Cluster 5: MHWB | 1.93 | 8.99 | 3.00 | 33.62 | 52.46 | 100.00 |
| Total | 25.57 | 13.58 | 14.67 | 27.58 | 18.60 | 100.00 |
The cells situated on the main diagonal present the so called “stability rates” over the 10-year period of the study, which appear to be greater for those clusters attracting respondents with either uniformly high or uniformly low hedonic and eudaimonic well-being levels. In particular, very high stability is present in the area of ULWB (cluster 1) where the probability of not moving to a higher well-being cluster over a 10-year period is 66%. At the other end of the well-being distribution, we see that more than 2/3 of individuals who register somewhat high or mostly high HWB and EWB in time t (clusters 4 and 5) are likely to be located in one of these high well-being areas in time t+1 as well.
That said, combinations of divergent levels of hedonia and eudaimonia appear to be more transitory. Two out of three respondents located in the mixed well-being clusters (2 and 3) in time t moved to areas of either uniformly high or uniformly low HWB and EWB levels in time t+1. For both macro clusters downward movement probabilities amount at more than 20%, with a somewhat higher percentage registered for the mixed HWB>EWB cluster (3). On the other hand, upward transitions were also frequent. More than 25% of individuals registering either of the two types of disparate combinations of hedonic and eudaimonic well-being in time t moved to the second-highest cluster (4) at time t+1. Transitions to the highest well-being cluster (5) were more frequent for respondents located in the mixed EWB>HWB macro cluster (11.5%) than ones scoring HWB>EWB levels (3.8%).
Upward movements from uniformly low to uniformly high EWB/HWB levels over a 10-year period are rare. Less than 6% of respondents transitioned from the ULWB (1) to the top well-being clusters (4 and 5), while about 12% register transitioned in the opposite direction. Our evidence show that, among those moving from a cluster with uniformly low well-being to ones with divergent hedonic / eudaimonic profiles, there were greater chances of upward movements towards the mixed HWB>EWB macro cluster in our SOM. At the same time, downward movements from the MHWB (5) towards clusters characterized by greater well-being “vulnerability” (2 and 3), were more frequent in direction towards the mixed EWB>HWB one.
6. DISCUSSION
Well-being research has gained momentum in past decades with a growing body of literature trying to conceptualize its main domains and identify appropriate measures. Two major traditions have emerged, one adopting a hedonic view to human well-being mainly concerned with people’s experience of their lives in positive way (Diener, 1984, Kahneman et al., 1999); and the other- a eudaimonic one focusing on the development of one’s talents and potential, thus flourishing (Ryff, 1989, Waterman, 1993).
The central purpose of this inquiry was to examine a question rarely considered in past research – namely how these two different domains (each measured with a series of distinct indicators) come together in the lives of individual adults? In marked contrast to much previous work seeking to establish the separateness of these domains, our study provides an account of how they are integrated in a nationally representative sample of U.S. adults containing measures of both eudaimonic and hedonic well-being. More precisely, the core aim of our investigation was to identify what are the frequently occurring combinations of these eudaimonic and hedonic dimensions, their major sociodemographic and socioeconomic correlates, as well as cross-time dynamics.
To this end, we applied an innovative analytical tool, namely the self-organized map (SOM) neural algorithm (Kohonen, 1981, 2001) that allows the identification and inspection of patterns underlying complex multidimensional phenomena as, in our case, human well-being. In particular, we implemented this clustering-and-projection technique to a set of hedonic and eudaimonic well-being indicators in order to examine their joint distributional patterns. In so doing, we obtained a notably more granular picture of how these distinct well-being aspects come together for different subgroups of the population – a step forward in the direction of capturing “whole persons” whose overall well-being profiles are richly nuanced and differentiated.
We analyzed data from a nationally representative sample of American adults who participated in a longitudinal study of human health, known as MIDUS (wave 2 and wave 3 of the survey, for a total of 2,393 individuals and 4,786 observations). For the extrapolation of the self-organized map we used nine well-being indicators capturing both hedonic (life satisfaction, positive, and negative affect), and eudaimonic (autonomy, environmental mastery, personal growth, positive relations with others, purpose in life, and self-acceptance) well-being aspects (Diener et al., 1999; Ryff, 1989).
As far as the overall combination of hedonia and eudaimonia is concerned, our results extend previous findings, mostly based on factor analytical approaches (Keyes et al., 2002; Gallagher et al., 2009; Linley et al., 2009; Chen et al., 2012; Huppert and So, 2013), showing that the two well-being aspects, when examined in terms of their underlying components, are related for many individuals. In particular, about 70% of all sample observations presented convergent EWB and HWB scores (24% registering low, and the remaining 46% - above-average and high levels in both these dimensions). This substantial overlap between the levels of our nine indicators suggests that hedonic and eudaimonic well-being can complement and perhaps even mutually reinforce each other on both ends of the “well-being distribution”.
However, and more importantly, new insights showed that the match between our hedonic and eudaimonic indicators is far from perfect. More precisely, 30% of the respondents registered divergent well-being profiles (high EWB/ low HWB; low EWB / high HWB), both accounting for about 15% of the sample observations6. This evidence confirms results from Keyes et al. (2002) that emphasized the existence of “off-diagonal” combinations of hedonic and eudaimonic well-being. However, our evidence is a step forward with respect to such prior analysis based on a cross tabulation of the tertiles of the overall composites of HWB and EWB. The SOM technique allowed for detection with much greater precision of the contribution of every well-being indicator to such divergent combinations of hedonia and eudaimonia. The empirical evidence it generated reveals that these blended well-being profiles are characterized by a more marked separation between some of the nine HWB and EWB, whereas with regards to others they are more blended.
Specifically, we found evidence that such contrasting patterns were more pronounced when comparing the three hedonic indicators (life satisfaction, positive affect, and negative affect), and three of the eudaimonic ones (namely, autonomy, personal growth, and purpose in life). In line with previous findings from exploratory factor analysis that showed the other three EWB variables (environmental mastery, positive relations with other and self-acceptance) loading on both EWB and HWB factors (Keyes et al., 2002), we find their distributional patterns discriminating along the vertical axis of the map, thus, lying in a somewhat intermediate position with respect to these divergent combinations of hedonia and eudaimonia.
These findings suggest that, although in many cases hedonic and eudaimonic well-being converge, albeit at notably different levels, there is a substantial part of the population (about one third of all observations) for which one aspect of well-being is at odds with another aspect of well-being. It might be the case that eudaimonic flourishing and high personal growth orientation sometimes come at the cost of the positive emotional states experienced, and life satisfaction (HWB) perhaps tied to the high demands that striving and realization of one’s potential can pose to the individual. The opposite case may also occur wherein a high focus on hedonia might get in the way of aspects of eudaimonic well-being, such as highly purposeful living, acceptance of one’s personality and achievements, and autonomy to voice own opinion. Alternatively, for those whose self-realization pursuits are stymied by limited life opportunities, capacities for being satisfied with life, could afford compensation.
Of particular value in understanding varieties of human well-being is how they are distributed in the general population. While previous studies have mainly focused on sociodemographic and socioeconomic correlates or determinants of hedonia and eudaimonia examined separately, we were interested in understanding whether and how their joint patterns (which exist in different varieties) are tied with sociodemographic and socioeconomic factors.
Our findings confirm previous evidence on associations with age, such that older adults are more likely to experience a balanced high levels in both hedonic and eudaimonic well-being (Keyes et al., 2002). In particular, young and middle-aged adults (our reference age category) have greater chance of being located in the uniformly low well-being cluster (1), as well as in one of the divergent well-being clusters (2 and 3). As far as the hedonic well-being dimension examined in this study is concerned, such findings are in line with evidence of HWB following a U-shaped curve across the lifespan (Blanchflower and Oswald, 2004; Stone et al., 2010). Moreover, our results suggest that young and middle-aged adults are more likely than older respondents to experience challenged thriving reflected in higher EWB levels (in particular, purpose in life, personal growth, and autonomy) combined with lower levels of positive emotional experiences, and perceived quality of life (cluster 2).
Contrary to previous findings (Keyes et al., 2002), we find no evidence that such mixed EWB>HWB pattern is shaped by the educational level of the respondent. Our analysis does not, therefore, provide support for what has been suggested by some authors, namely, that rising in aspirations associated with higher education can come at the expense of overall satisfaction with life (Becchetti and Pelloni, 2013). Nevertheless, educational attainment seems to play important role in lowering chances of the inverse high HWB but low EWB combination. One possible explanation might be what has been suggested by some that hedonically gratifying experiences may reflect short-time horizons and low expectations about the future whereas opportunities for long-term investments (e.g.,education) in the future are lacking and human flourishing may thus be hampered (Graham, 2017). Moreover, respondents with higher educational standing (in particular, postgraduate degree) are less likely to score low on both hedonic and eudaimonic dimensions (cluster 1) giving support to its beneficial effects in terms of well-being even when we control for income, employment status, health, and personality traits.
An important predictor of well-being profiles is marital status. In particular, our results show that married respondents (our reference category) have significantly lower chances than divorced, widowed, and never married individuals to experience combined low well-being levels– findings that converge with prior literature examining the beneficial effects of marriage both in terms of HWB (Di Tella et al., 2003; Blanchflower and Oswald, 2004; Frey and Stutzer, 2002), and EWB (Shapiro and Keyes, 2008). Interestingly, our results suggest that the disrupting effects of divorce and widowhood not necessarily affect the eudaimonic dimension of well-being with a portion of respondents maintaining high EWB profiles, although combined with low hedonic levels. Moreover and similar to previous literature, marriage is associated with well-being benefits when compared to individuals who have never been married (Easterlin, 2003). Our results suggest, however, that such benefits are more pronounced for the eudaimonic than hedonic well-being dimension.
A higher standing in the income distribution is significantly associated with decreased chances of scoring low both hedonically and eudaimonically but does not discriminate between the other joint well-being profiles we observe. This finding may reflect the Easterlin paradox (Easterlin, 1974) suggesting that although playing a significant positive role at the bottom end of the well-being distribution, other factors beyond income might have a major influence in determining the other well-being patterns present.
Finally, the use of longitudinal data allowed us to enlarge what is known about people’s well-being profiles and how they evolve over time, and thereby to extend the prior well-being literature that has mostly used cross-sectional data. We examined to what extent these combined well-being patterns identified in our data tend to remain stable over the 10-year period of the study via empirical transition probabilities. Results showed that it is the three “convergent”, low and high, well-being clusters (1,4, and 5) that revealed the greatest stability rates suggesting that these persisting patterns of low / high hedonic and eudaimonic well-being perhaps reinforce each other through time. Such findings are in line with set point theories stating that well-being remains stable over the life course as people continuously bounce back to a level that might be even genetically predetermined (Helson, 1964; Brickman and Campbell, 1971; Lykken and Tellegen, 1996).
Nonetheless, our evidence shows that substantial changes in well-being can occur, especially when hedonic and eudaimonic aspects diverge. In particular, the two mixed (high EWB/low HWB; low EWB/high HWB) macro areas in our SOM appear to be more transient and unstable with only about 1 in 3 respondents maintaining similar well-being levels 10 years later. As discussed above, such divergent hedonic and eudaimonic levels probably reflect specific combinations of strengths and vulnerabilities, which might be either compensating, or alternatively, undermining each other making longitudinal assessments that allow us to see how they co-evolve over time particularly valuable. Movements out of these intermediate well-being states are registered both upward, and downward. In the former case, chances are higher for respondents who during the first period of the study were located in the mixed EWB>HWB cluster (2), while, in the latter - for respondents who have registered mixed HWB>EWB levels (cluster 3).
The reported findings do not invoke any kind of moral superiority (Kashdan et al., 2008) of eudaimonic well-being over hedonic well-being. Rather, we suggest that future research should pay particular attention to empirical combinations of well-being and their cross-time dynamics in hopes of shedding light on the factors that determine these patterns. We speculate, for example, that investing energy in challenging activities might foster personal growth, perhaps at the expense of immediate positive emotional experiences, but note a substantial portion of respondents (37% approximately) who started with high EWB/low HWB levels subsequently moved to one of the uniformly high well-being clusters over the 10-year period. Such upward transition from the mirror low EWB/high HWB cluster was less frequent (29% approximately).
Clearly, the mechanisms underlying such transition are not understood and may reflect wide ranging factors that influence well-being over time and are perhaps influenced by it, in turn. Despite use of longitudinal data, these analyses do not disentangle causal relationships between the combined well-being profiles and the series of sociodemographic and socioeconomic variables examined. Those questions represent important directions for future investigation.
Also important is possible health consequences of these differing combinations of well-being. While extensive research has focused on single well-being dimensions (hedonic and eudaimonic) in assessing risks of subsequent morbidity, mortality, and physiological dysregulation (Pressman and Cohen, 2005; Ryff, 2017), the joint effects of convergent or divergent EWB and HWB levels have largely been neglected. They may offer valuable insight into overall relationships between well-being and health, possibly with policy implications. Moreover, beyond sociodemographic correlates, future research needs to examine other possible drivers (e.g., healthy social bonds, religiosity and pro-social behavior, use of time and new technologies) of these different hedonic and eudaimonic well-being profiles.
Finally, the combination of hedonic and eudaimonic indicators speaks, in part, to criticism of subjective well-being measures as reliable enough indicators of the quality of human life (Sen, 1999; Nussbaum, 2000). While assessing people’s life evaluation and experience is important in its own right, it is nevertheless crucial to verify how they relate to a person’s flourishing and realization of full potential. The significant degree of divergence that we found between these hedonic and eudaimonic dimensions shows that analysis based on a single one of them, provides an inevitably partial and incomplete view of this complex phenomenon. By allowing for a more detailed picture, the self-organized map technique adopted in this study represents an innovative and valuable analytic tool to advance overall knowledge about human well-being and thereby, and offer insights on how it can be fostered.
Fig. 3.
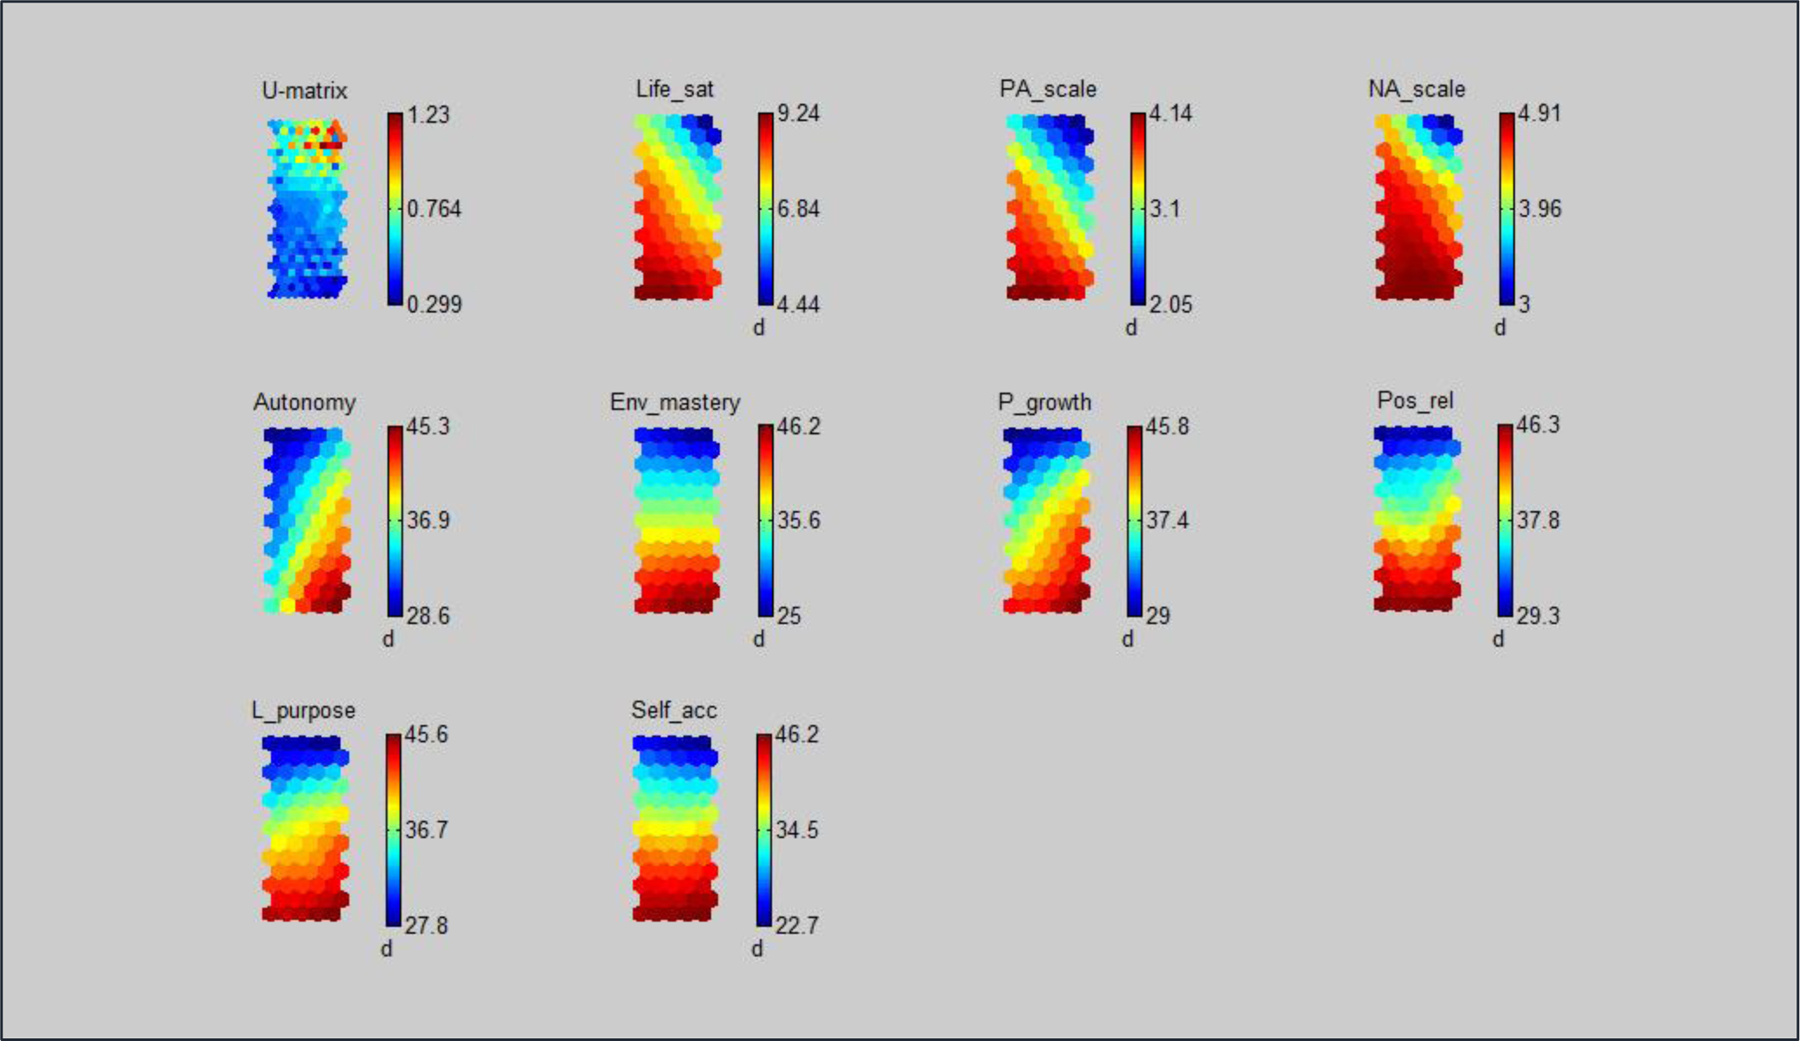
Component planes for the nine well-being (eudaimonic and hedonic) items: MIDUS Refresher
APPENDIX
Table 4.
Summary statistics
| Variable | Mean | Std. Dev. | Min | Max | Observations | |
|---|---|---|---|---|---|---|
| Autonomy | overall | 37.25955 | 6.852278 | 10 | 49 | N = 4786 |
| between | 6.266317 | 11.5 | 49 | n = 2393 | ||
| within | 2.774021 | 26.25955 | 48.25955 | T = 2 | ||
| Environmental Mastery | overall | 38.66341 | 7.371222 | 10 | 49 | N = 4786 |
| between | 6.609233 | 10.5 | 49 | n = 2393 | ||
| within | 3.265286 | 26.16341 | 51.16341 | T = 2 | ||
| Personal Growth | overall | 38.75126 | 6.749748 | 14 | 49 | N = 4786 |
| between | 6.146756 | 16.5 | 49 | n = 2393 | ||
| within | 2.79005 | 27.75126 | 49.75126 | T = 2 | ||
| Positive Relations with Others | overall | 40.88679 | 6.757382 | 14 | 49 | N = 4786 |
| between | 6.159625 | 16 | 49 | n = 2393 | ||
| within | 2.780138 | 29.88679 | 51.88679 | T = 2 | ||
| Purpose in Life | overall | 38.72272 | 6.86408 | 8 | 49 | N = 4786 |
| between | 6.207523 | 15 | 49 | n = 2393 | ||
| within | 2.930923 | 23.72272 | 53.72272 | T = 2 | ||
| Self-Acceptance | overall | 38.37515 | 8.164295 | 7 | 49 | N = 4786 |
| between | 7.534959 | 9 | 49 | n = 2393 | ||
| within | 3.145151 | 24.87515 | 51.87515 | T = 2 | ||
| Life Satisfaction | overall | 7.946929 | 1.501829 | 0 | 10 | N = 4786 |
| between | 1.309657 | 0 | 10 | n = 2393 | ||
| within | .7352876 | 4.446929 | 11.44693 | T = 2 | ||
| Positive Affect | overall | 3.454868 | .69516 | 1 | 5 | N = 4786 |
| between | .6193808 | 1.166667 | 5 | n = 2393 | ||
| within | .3157452 | 1.454868 | 5.454868 | T = 2 | ||
| Negative Affect | overall | 4.541778 | .5341905 | 1 | 5 | N = 4786 |
| between | .4724743 | 2 | 5 | n = 2393 | ||
| within | .2493474 | 3.125111 | 5.958445 | T = 2 |
Footnotes
Formally, in the first step of the learning process each observation is assigned to its BMU or node with closest weight vector mi according to the following equation: || x – mc || = mini {|| x – mi ||}. The learning process then continues with the weight vectors of the BMU and its closest neighbors in the map being updated over T iterations, called learning epochs. Such adjustments aim at ensuring a better match with the input vectors and are done as follows: mi (t+1) = mi (t) + hci(t) [x(t) - mi (t)] where mi is the weight vector; x is the input vector; and hci is the neighborhood function around the winner unit indexed c, monotonically decreasing over time and normally taken to be Gaussian around the BMU.
The quantization error, normalized so as to take values in the interval (0–1), is a measure of the SOM resolution and corresponds to the average distance between each input vector and its best matching unit (BMU). Our self-organized map exhibited a normalized quantization error equal to 0.016. This means that, on average, each element of the input vector differed from its corresponding BMU weight vector by 1.6 percentage points. The topographic error, on the other hand, is a measure of the SOM’s degree of topology preservation and corresponds to the proportion of all input vectors for which the best matching unit and the second-best matching unit are not adjacent on the two-dimensional grid; our SOM exhibited a topographic error equal to 0.009, meaning that only 43 out of 4786 observations are affected by some degree of ’topological misplacement’.
Note, every single node composing the five macro clusters combines all nine well-being indicators at the levels presented in the component planes above.
More precisely: the self-rated health of the respondent is assessed on a five-point Likert scale ranging from 1 (Excellent) to 5 (Poor); the personality traits of the respondent are assessed using the Big Five personality traits model composed of 25 self-descriptive adjectives capturing the degree of agreeableness, extraversion, neuroticism, conscientiousness, and openness of the respondent.
However, such evidence should be regarded with caution as there are only 68 cases of unemployment present in our subsample.
These well-being profiles were additionally confirmed through the implementation of the SOM technique on the same set of PWB and SWB variables collected for a different nationally representative sample of 2,353 American adults (MIDUS Refresher, 2013) replicating the MIDUS baseline study (1995/96). Figure 3 reports the component planes of the single well-being indicators which, clearly, follow the same distributional patterns as in the MIDUS II/MIDUS III sample discussed in this inquiry.
Contributor Information
Marta G. Pancheva, Department of Economics and Management, University Institute Siphia, Via San Vito, 28, 50064 Figline e Incisa Valdarno, Italy
Carol D. Ryff, Institute on Aging, University of Wisconsin - Madison, 2245 MSC, 1300 University Ave, Madison, WI 53706, USA
Mario Lucchini, Department of Sociology and Social Research, Università degli Studi di Milano Bicocca, piazza dell’Ateneo nuovo 1, 20126 Milan, Italy.
REFERENCES
- Allport GW (1961). Pattern and Growth in Personality, Holt, Rinehart, and Winston: New York. [Google Scholar]
- Andrews FM, & Withey SB (1976), Social Indicators of Well-being: Americans’ Perceptions of Life Quality. New York: Plenum Press. [Google Scholar]
- Arthaud-Day M, Rode JC, Mooney CH, Near JP (2005), The Subjective Well-Being construct: a test of its convergent, discriminant, and factorial validity, Social Indicators Research, vol.74, pp.445–476. [Google Scholar]
- Becchetti L, and Pelloni A (2013), What are we learning from the life satisfaction literature?, International Review of Economics, vol.60, pp.113–155. [Google Scholar]
- Blanchflower DG, and Oswald AJ (2004), Well-being over time in Britain and the USA, Journal of Public Economics, vol.88, pp.1359–1386. [Google Scholar]
- Bradburn NM (1969). The Structure of Psychological Well-Being, Chicago: Aldine. [Google Scholar]
- Brickman P, and Campbell DT (1971). Hedonic relativism and planning the good society. In Appley MH (Ed.), Adaptation level theory: A symposium (pp. 287–302). Academic Press: New York. [Google Scholar]
- Bruni L, and Porta PL (Eds.). (2016). Happiness and quality of life reconclided, in Handbook of Research Methods and Applications in Happiness and Quality of Life, Edward Elgar Publishing. [Google Scholar]
- Buhler C (1935). The curve of life as studied in biographies, Journal of Applied Psychology, vol.43, pp.653–673. [Google Scholar]
- Chen FF, Jing Y, Hayes A, and Lee JM (2013), Two concepts or two approaches? A bifactor analysis of psychological and subjective well-being, Journal of Happiness Studies: An Interdisciplinary Forum on Subjective Well-Being, vol.14,pp.1033–1068. [Google Scholar]
- Crivelli L, Della Bella S, and Lucchini M (2016), Multidimensional well-being in contemporary Europe: An analysis of the use of self-organizing map applied to SHARE data, in World Happiness Report 2016, Special Rome Edition, Sachs J, Becchetti L, Annett A (Eds.), vol. 2, pp.104–127. [Google Scholar]
- Della Fave A (2016). Subjective indicators of well-being: conceptual background and applications in social sciences, in Bruni L Porta PL (Eds.), Handbook of Research Methods and Applications in Happiness and Quality of Life, Edward Elgar Publishing. [Google Scholar]
- Di Tella R, MacCulloch R, and Oswald A (2003), The macroeconomics of happiness, Review of Economics and Statistics, vol.85, pp.809–827. [Google Scholar]
- Diener E (1984). Subjective Well-Being, Psychological Bulletin, vol.95, pp.542–575. [PubMed] [Google Scholar]
- Diener E, Suh EM, Lucas RE, and Smith HL (1999). Subjective Well-Being: three decades of progress, Psychological Bulletin, vol.125, pp.276–302. [Google Scholar]
- Diener E, Napa Scollon CK, Oishi S, Dzokoto V, and Suh EM (2000), Positivity and the construction of life satisfaction judgments: Global happiness is not the sum of its parts, Journal of Happiness Studies, vol.1, pp.159–176. [Google Scholar]
- Diener E, Wirtz D, Tov W, Kim-Prieto C, Choi DW, Oishi S, and Biswas-Diener R (2010), New well-being measures: Short scales to assess flourishing and positive and negative feelings, Social Indicators Research, vol.97, pp.143–156. [Google Scholar]
- Easterlin RA (1974), Does economic growth improve the human lot?: Some empirical evidence, in David P and Reder M (Eds.) Nations and Households in Economic Growth, Academic Press. [Google Scholar]
- Easterlin RA (2003), Explaining happiness, Proceedings of the National Academy of Sciences, vol.100, pp.11176–11183. [DOI] [PMC free article] [PubMed] [Google Scholar]
- Erikson EH (1959). Identity and the life cycle: selected papers, Psychological Issues, vol.1, pp.1–171. [Google Scholar]
- Frankl VE (1959). The spiritual dimension in existential analysis and logotherapy, Journal of Individual Psychology, vol.15, pp.157–165. [Google Scholar]
- Frey BS, and Stutzer A (2002). What can economists learn from happiness research?, Journal of Economic Literature, vol.40, pp.402–435. [Google Scholar]
- Frey BS, and Stutzer A (2010), Happiness and Economics: How the Economy and Institutions Affect Human Well-Being, Princeton University Press Princeton. [Google Scholar]
- Gallagher MW, Lopez SJ, S. J., and Preacher KJ (2009), The hierarchical structure of well-being. Journal of Personality, vol.77, pp.1025–1050. [DOI] [PMC free article] [PubMed] [Google Scholar]
- Graham C (2017), Happiness for All? Unequal Hopes and Lives in Pursuit of the American Dream, Princeton University PressL Princeton. [Google Scholar]
- Helson H (1964), Current trends and issues in adaptation-level theory, American Psychologist, vol.19, pp.26–38. [Google Scholar]
- Huppert FA, and So TTC (2013). Flourishing across Europe: Application of a new conceptual framework for defining well-being, Social Indicators Research, vol.110, pp.837–861. [DOI] [PMC free article] [PubMed] [Google Scholar]
- Huta V, and Ryan RM (2010). Pursuing pleasure or virtue. The differential and overlapping well-being benefits of hedonic and eudaimonic motives, Journal of Happiness Studies, vol.11, pp.735–762. [Google Scholar]
- Jahoda M (1958). Current Concepts of Positive Mental Health, Basic Books: New York. [Google Scholar]
- Jung CG (1933), Modern Man in Search of a Soul, Harcourt, Brace and World: New York. [Google Scholar]
- Kahneman D, Diener E, and Schwarz N (Eds.). (1999). Well-being: The foundations of hedonic psychology, Russell Sage Foundation: New York. [Google Scholar]
- Kashdan TB, Biswas-Diener R, and King LA (2008), Reconsidering happiness: The costs of distinguishing between hedonics and eudaimonia, The Journal of Positive Psychology, vol.3, pp.219–233. [Google Scholar]
- Keyes CLM, (2002), The mental health continuum: From languishing to flourishing in life, Journal of Health and Social Behavior, vol.43, pp.207–222. [PubMed] [Google Scholar]
- Keyes CLM, (2007), Promoting and protecting mental health as flourishing: A complementary strategy for improving national mental health, American Psychologist, vol.62, pp.95–108. [DOI] [PubMed] [Google Scholar]
- Keyes CLM, Shmotkin D, and Ryff CD (2002), Optimizing well-being: The empirical encounter of two traditions, Journal of Personality and Social Psychology, vol.82, pp.1007–1022. [PubMed] [Google Scholar]
- Kohonen T (1982), Self-organized formation of topologically correct feature maps, Biological Cybernetics, vol.43, pp.59–69. [Google Scholar]
- Kohonen T (2001), Self-Organizing Maps, third ed. Springer, Berlin. [Google Scholar]
- Linley PA, Maltby J, Wood AM, Osborne G, and Hurling R (2009). Measuring happiness: The higher order factor structure of subjective and psychological well-being measures. Personality and Individual Differences, vol.47, pp.878–884. [Google Scholar]
- Lykken D, and Tellegen A (1996), Happiness is a stochastic phenomenon. Psychological Science, vol.7, pp.186–189. [Google Scholar]
- Maslow AH (1968), Toward a Psychology of Being (ed 2.), Van Nostrand: New York. [Google Scholar]
- Nussbaum M (2000), Women and Human Development, Cambridge University Press: Cambridge. [Google Scholar]
- OECD (2013), OECD Guidelines on Measuring Subjective Well-being, OECD Publishing: Paris. 10.1787/9789264191655-en. [DOI] [PubMed] [Google Scholar]
- Pavot W, Diener E, Colvin CR and Sandvik E (1991), Further validation of the satisfaction with life scale: Evidence for the cross-method convergence of well-being measures, Journal of Personality Assessment, vol. 57, pp. 149–161. [DOI] [PubMed] [Google Scholar]
- Pressman SD, and Cohen S (2005), Does positive affect influence health?, Psychological Bulletin, vol.131, pp.925–971. [DOI] [PubMed] [Google Scholar]
- Ryan RM, and Deci EL (2001), On happiness and human potentials: A review of research on hedonic and eudaimonic well-being, Annual Review of Psychology, vol.52, pp.141–166. [DOI] [PubMed] [Google Scholar]
- Ryff CD (1989), Happiness is everything, or is it? Explorations on the meaning of psychological wellbeing, Journal of Personality and Social Psychology, vol.57, pp.1069–1081. [Google Scholar]
- Ryff CD (2014). Psychological well-being revisted: Advances in the science and practice of eudaimonia, Psychotherapy and Psychosomatics, vol.83, pp.10–28. [DOI] [PMC free article] [PubMed] [Google Scholar]
- Ryff CD (2017), Eudaimonic well-being, inequality, and health: Recent findings and future directions, International Review of Economics, vol.64, pp.158–178. [DOI] [PMC free article] [PubMed] [Google Scholar]
- Ryff CD (2018), Eudaimonic well-being: Highlights from 25 years of inquiry. In Shigemasu K, Kuwano S, Sato T, and Matsuzawa T (Eds.), Diversity in harmony- insights from psychology: Proceedings of the 31st international congress of psychology, Wiley: Hoboken, NJ. [Google Scholar]
- Ryff CD, and Singer B (2008). Know thyself and become what you are: A eudaimonic approach to psychological well-being, Journal of Happiness Studies, vol.9, pp.13–39. [Google Scholar]
- Schimmack U, Schupp J, and Wagner GG (2008), The influence of environment and personality on the affective and cognitive component of subjective well-being, Social Indicators Research, vol.89, pp.41–60. [Google Scholar]
- Seligman MEP (2011), Flourish: A visionary new understanding of happiness and well-being, Free Press: New York. [Google Scholar]
- Sen A (1999), Development as Freedom, Oxford University Press: Oxford. [Google Scholar]
- Shapiro A, and Keyes C (2008), Marital status and social well-being: are the married always better off?, Social Indicators Research, vol.88, pp. 329–346. [Google Scholar]
- Stone AA, Schwartz JE, Broderick JE, and Deaton A (2010), A snapshot of the age distribution of psychological well-being in the United States, Proceedings of the National Academy of Sciences, vol.107, pp.9985–9990. [DOI] [PMC free article] [PubMed] [Google Scholar]
- Su R, Tay L, and Diener E (2014), The Development and Validation of the Comprehensive Inventory of Thriving (CIT) and the Brief Inventory of Thriving (BIT), Applied Psychology: Health and Well-Being, vol.6, pp.251–279. [DOI] [PubMed] [Google Scholar]
- Torgerson WS (1952), Multidimensional scaling: I. Theory and method, Psychometrika, vol.17, pp.401–419. [Google Scholar]
- Veenhoven R (2015), Informed pursuit of happiness: What we should know, do know and can get to know, Journal of Happiness Studies, vol.16, pp.1035–1071. [Google Scholar]
- Waterman AS (1993). Two conceptions of happiness: Contrasts of personal expressiveness (eudaimonia) and hedonic enjoyment, Journal of Personality and Social Psychology, vol. 64, pp.678–691. [Google Scholar]
- Waterman AS, Schwartz SJ, and Conti R (2008), The implications of two conceptions of happiness (hedonic enjoyment and eudaimonia) for the understanding of intrinsic motivation. Journal of Happiness Studies, vol.9, pp.41–79. [Google Scholar]
- Watson D, Clark LA, L and Tellegen A (1988), Development and validation of brief measures of positive and negative affect: The PANAS Scales, Journal of Personality and Social Psychology, vol.54, pp.1063–1070. [DOI] [PubMed] [Google Scholar]