

Abstract
This outcomes assessment was implemented to evaluate a web-based alcohol use recovery program, Tempest Sobriety School (TSS), and to provide a model for outcome evaluation. Adults (N=541) enrolled in TSS were assessed at pre-program start and Month 2, 6, and 12. Participants reported decreased alcohol use, drug use, craving for alcohol, and alcohol use disorder symptoms over the course of the program; changes were maintained at Month 6 and 12. Participants reported sustained increases in overall physical and mental health and quality of life. Findings will inform TSS students and stakeholders and provide a model for others conducting similar evaluations.
Keywords: alcohol use, e-health, web-based, peer support, outcome evaluation
Problematic drinking and alcohol use disorder (AUD) are associated with numerous economic and societal problems, potential years of life lost, and death (Esser, 2020; Rehm et al., 2009; Sacks et al., 2015). Recent national data indicate that 70% of people have drunk alcohol within the past year and that more than 25% of adults engaged in binge drinking (four or more drinks for women/five or more drinks for men within ~ 2 hrs) in the past month (Substance Abuse and Mental Health Services Administration, 2018a). More than 14 million (5.8%) of these individuals had an AUD, with rates higher among men than among women (7.6% compared to 4.1%; Substance Abuse and Mental Health Services Administration, 2018b, 2018c).
Despite the U.S. national survey data on alcohol use and associated problems, many people in need of services do not receive them (Cohen et al., 2007; Degenhardt et al., 2017). A 2018 national report indicated that less than eight percent of adults who had AUD in the past year reported receiving treatment (National Institute on Alcohol Abuse and Alcoholism, 2020). This service gap is especially evident among women (Chen et al., 2020; Mellinger et al., 2019; National Institute on Alcohol Abuse and Alcoholism, 2020). Fewer women with AUD report seeking care within the last year and over their lifetime (Cohen et al., 2007; Greenfield et al., 2007). Women who do seek AUD treatment report greater social, family, and medical impairments than their male counterparts (Hernandez-Avila et al., 2004) and experience longer wait times for treatment (Downey et al., 2003).
Conventional service delivery methods are characterized by systemic barriers to care. They present several challenges that may explain why some individuals in need of AUD or alcohol use treatment do not receive the care they require. Substance use treatment systems have been overwhelmed and often have long waitlists and limited access to appointments at preferred times (Downey et al., 2003; Redko et al., 2006). Traditionally, treatment delivery methods for alcohol use problems and AUD involve attending in-person appointments, with one provider or in a group of others who are also receiving treatment. In either case, individuals seeking treatment are often burdened by arranging transportation and finding availability during business hours which may include requesting time away from work. Individuals seeking in-person treatment may confront discomfort (e.g., fear, embarrassment) associated with attending health care visits at substance use treatment facilities, including perceived stigma related to having an AUD, or needing help to manage alcohol use (Chartier et al., 2016; Grant, 1997). Potentially influenced by traditional gender roles, a male-centric approach to AUD treatment (White & Chaney, 1992), and male-dominated treatment services, some of these internal and external barriers to alcohol use treatment are more enhanced for women (McCrady et al., 2020; Sayer, 2016).
Given the barriers associated with traditional substance use services, alternative approaches have been developed, including web-based programs. Such services may offer suitable alternatives to conventional substance use treatment given that they may enhance access to care. Indeed, a global report by the International Telecommunication Union shows a steady increase in the number of Internet users from 2015 to 2019 when 4.1 billion people were using the Internet (International Telecommunication Union, 2019). A recent U.S. national survey found that 89% of households owned a computer or smartphone and more than 80% had a broadband Internet subscription (Camille, 2018).
The Internet has become an integral part of society and is quickly becoming a part of health care as well. There has been an “explosion of e-health” approaches within the past two decades. According to a Web of Science search (conducted September 7, 2020) on the topic of e-health containing more than 6,800 records, there was a rapid increase in e-health publication records from 2000 (23 records) to 2015 (666 records), the magnitude of which has stayed relatively steady since (682–736 from 2016–2019 and already 416 in 2020). E-health has proven even more relevant and important in the face of the recent global coronavirus epidemic, COVID-19 (Rio & Malani, 2020). Given that COVID-19 is primarily transmitted from person to person through respiratory droplets, the pandemic has forced a rapid shift away from traditional in-person care.
Web-based recovery programs address some of the barriers associated with conventional, in-person treatment with greater convenience and availability. There is decreased perceived stigma because individuals can receive care without leaving their homes, and some web-based programs provide a level of anonymity. There is increased access because services are not confined to a physical location, and often Internet programs are not restricted to business hours. This means that individuals may not need to take time off work and do not have to arrange transportation.
One web-based program is Tempest Sobriety School (formerly Hip Sobriety School; https://www.jointempest.com/). Tempest Sobriety School is an eight-week intensive program, delivered online, designed to assist individuals in their recovery from alcohol use and related problems. The program takes a holistic approach and addresses not just alcohol use but also other aspects of health and well-being, with the ultimate goal of addressing the causes and cycle of addiction. Tempest Sobriety School is advertised as taking a feminine-centric approach to recovery and being tailored to the unique needs of women and other historically underrepresented individuals. Although the program’s approach is feminine-centric, its services are also available to men.
Tempest Sobriety School is designed for individuals of all drinking goals and current levels of substance use. It consists of psychosocial education, peer support, and peer community, and it is founded on evidence-based treatments, including cognitive behavioral therapy, dialectical behavioral therapy, mindfulness, positive psychology, and peer interventions. All instruction and support are provided by trained peer coaches.
Although Tempest Sobriety School is founded in evidence-based treatments, the outcomes associated with this unique combination of approaches in a structured online format had not previously been evaluated. Outcome evaluation is a systematic approach used to determine whether a given program can achieve its intended effects (e.g., Are participants better off than before the program? Did they reduce substance use?). Findings from outcome evaluations can be used to inform both stakeholders, funders, and end-users (Newcomer et al., 2015). For instance, results can inform efforts to enhance the program, determine where to dedicate funds, and evaluate service options.
The purpose of this study was to conduct a systematic outcome evaluation of Tempest Sobriety School. Following an evaluation model used in the outcome assessment of an independent, traditionally-delivered addictions treatment program (Connors et al., 2017), we examined multiple domain short and long-term outcomes. Specific objectives included (1) characterizing/describing the Tempest Sobriety School participant population (e.g., demographics, alcohol and other substance use, general life-functioning, quality of life), (2) assessing changes in alcohol and other substance use variables, and other dimensions of functioning following their involvement in the course, and (3) assessing whether changes observed are maintained at Month 6 and Month 12 follow-up contacts. Findings from the current study will both inform participants and stakeholders of Tempest Sobriety School and may offer methods for others conducting similar evaluations.
Method
Participants
A total of 541 adults (Mage = 42.9, SD = 9.5) across three program sessions were recruited into the project. There were no specified exclusion or inclusion criteria. Any individual signing up for the Tempest Sobriety School program was eligible to participate. Tempest is advertised online through social media (Instagram, Facebook), media outlets (news, podcasts, etc.), and Google searches (for Tempest and Hip Sobriety).
Measures
Outcome Evaluation Planning
Tempest Sobriety School executives initiated the outcome evaluation to determine whether program enrollees were experiencing changes in substance use and life functioning while involved in the eight-week program and whether these changes were maintained over time. They initiated a partnership with a team of experienced program outcome researchers at two universities to collaborate in conducting the evaluation. The initial stages of the project included the consultants learning about the program, collaborating with the executives to develop specific program outcome goals, and selecting the outcome assessment battery. The battery included measures of demographic characteristics, substance use, and other aspects of overall functioning (e.g., depression and anxiety symptoms). These secondary non-substance use indicators were identified to provide a more complete understanding of patient functioning. This decision was influenced by published recommendations (Tiffany et al., 2012) and by practices used in addiction program evaluation studies (Flynn et al., 1997). With the exception of basic demographic questions included in the baseline assessment, the content of the baseline assessment battery and the follow-up assessments generally were consistent across timepoints. This decision to use identical assessment instruments was made so that changes in specific domains could be compared over time.
Demographic
Basic demographics were obtained at baseline to describe the participants. This measure included questions regarding age, gender, race, education, employment status, marital status, and partner drinking status. In addition, information was collected about the nature and extent of the individual’s use of alcohol: years alcohol has been a problem and alcohol consumption past 90 days and 365 days (binary yes/no variables).
Alcohol and Other Substance Use
The foundation of the assessment battery for this evaluation was the Brief Addiction Monitor (BAM; Cacciola et al., 2013). The BAM is a validated, psychometrically sound measure that was developed to monitor participants’ progress of recovery from substance use. Items from the BAM were used to measure alcohol craving, alcohol consumption, and other substance use frequency over the last 30 days at baseline, and at months 2, 6, and 12. Past 30-day alcohol craving was recorded on a five-point scale: Not at all, Slightly, Moderately, Considerably, Extremely (coded as 0–4). Participants were provided with the definition of a standard drink and asked to report alcohol consumption over the past 30 days, including the number of days having any alcohol, number of drinks consumed on a typical drinking day1, and number of binge drinking days (consuming five or more [men] or four or more [women, no gender, or another gender] drinks on a given day). Participants reported separately the number of days using marijuana, sedatives, cocaine, stimulants, opioids, inhalants, and cigarettes (including vaping). Use of substances was recorded only if they were used out of accordance with a prescription.
Symptoms of Alcohol Use Disorder
DSM-5 AUD symptoms (American Psychiatric Association, 2013) were assessed at baseline, Month 6, and Month 12 follow-ups. Endorsement of symptoms (assessed as binary yes/no response options) are categorized into mild (2–3 symptoms), moderate (4–5 symptoms), or severe (≥6 symptoms) dimensions based on the number of diagnostic criteria endorsed. At least two of the 11 criteria are required for an AUD diagnosis. At baseline, participants were queried about the experience of each criterion over the past year. The timeframe assessed at Month 6 and Month 12 was past 3 months. Symptoms of AUD were not assessed during the program (at the Month 2 follow-up).
Mental Health
Past 30-day depression and anxiety symptoms were assessed using the Patient Health Questionnaire-8 (PHQ-8; Kroenke et al., 2009) and Generalized Anxiety Disorder-7 (GAD-7; Spitzer et al., 2006), respectively. These questionnaires were administered at all timepoints (intake and months 2, 6, and 12). PHQ-8 total scores are categorized into levels of depressive symptoms as follows: 5–9 mild, 10–14 moderate, 15–19 moderately severe, 20–24 severe (Kroenke et al., 2001). GAD-7 total scores are similarly categorized into anxiety symptom severity levels as follows: 5–9 mild, 10–14 moderate, 15–21 severe (Spitzer et al., 2006). Coefficient alphas for the PHQ-8 (α = .862 – .898) and GAD-7 (α = .895 – .921) reflected good to excellent internal consistency across timepoints.
Physical Health and Quality of Life
A single item from the BAM was used to assess physical health over the past 30 days (Cacciola et al., 2013). Participants responded by selecting one of five categorical descriptors: Excellent, Very good, Good, Fair, Poor (coded as 4 to 0, respectively). Using this same scale, participants responded to a one-item measure inquiring about their current quality of life. The physical health and quality of life items were assessed at each timepoint.
Health Behaviors
Engagement in meditation and physical exercise were each assessed with a single-item questionnaire. At each timepoint, participants were asked to report on their engagement in meditation and physical exercise over the past 30 days. Response options included: Not at all (0), 1–3 times during the month (1), Once a week (2), More than once per week (3), or Daily (4).
Design
The present study employed a naturalistic, pretest-posttest design. Although observational research cannot discern causality, the aims of the current evaluation primarily include progress toward achieving program goals. Therefore, an observational design was determined to be most suitable.
Procedures
For purposes of presentation of the present data, Institutional Review Board approval was granted (Syracuse University IRB# 20–145) to use the confidential, anonymous data gathered as part of this outcome assessment.
The baseline assessment generally covered the 30 days before course participation. The next three assessments were at the end of the course (Month 2) and 6 and 12 months following the start of the course (Month 6; Month 12). These assessments also generally covered the 30 days before these respective follow-up survey points. The initial outcome assessment timepoint was selected to coincide with the end of the program; Month 6 and Month 12 were selected to provide an assessment of the trajectory and durability of changes over time.
Tempest Services
The psychosocial educational element of Tempest Sobriety School included two components. First, enrollees were provided with daily emails containing an affirmation, an essay supporting the message of the affirmation, and instructions for building a habitual morning and evening mindfulness practice. Second, participants were invited to attend weekly pre-recorded video lectures of 1–1.5 hrs, available on a password-protected, hosted website. Each video was accompanied by a workbook (downloadable PDF) reinforcing the content and behaviors included in the lecture. Lecture topics included creating a personal map of what is needed for recovery, addiction and the brain, behavior change and habit creation, mindfulness, yoga and meditation, developing community in sobriety, nutrition in sobriety, therapy and trauma, and continuing recovery post-intervention.
The peer support element included weekly live video sessions, led by subject matter experts, and facilitated by peer coaches, that allowed attendees to ask questions about their experience in early recovery. Enrollees were also invited to attend daily small group (8–15 participants) processing sessions via video conferencing led by peer coaches. Finally, the peer community element included community cohorts that were moderated by peer coaches. Participants were grouped into cohorts of 50–60, based on their respective time zones.
Implementation of the Measure
Individuals enrolling in one of three consecutive Tempest Sobriety School courses were invited to participate in a study designed to evaluate the program. The invitation to participate was sent via email and highlighted compensation as well as the confidential and voluntary nature of the study. Those opting to participate completed online informed consent and were directed to the online assessment immediately before the start of the two-month course (Baseline). Comparable online assessments were administered on three additional occasions: at the end of the course (Month 2), 6 months following the start of the course (Month 6), and 12 months following the start of the course (Month 12).
The online consent and surveys were completed by the participants on their home computers or laptops. Participants were sent a self-care recovery package for completing the baseline assessment. Upon completion of the Month 2, Month 6, and Month 12 follow-ups, participants received a $15 gift card.
Data Analytic Strategy
Statistical analyses were conducted using SPSS, v23 (IBM, Armonk, New York). Baseline descriptive statistics were calculated to characterize the sample participating in Tempest Sobriety School. T-tests (ratio scale variables), chi-square tests (categorical variables), and Mann Whitney tests (ordinal variables) were conducted to examine baseline differences according to study retention status. We performed one-way repeated measures analysis of variance (ANOVA) tests with Greenhouse-Geisser corrections for violations of sphericity (for ratio scale outcome variables) and Friedman tests (for ordinal outcome variables) to compare outcomes at baseline, Month 2, Month 6, and Month 12. Significant ANOVA within-subjects effects of time were followed up with Bonferroni-adjusted pairwise comparisons. Significant Friedman tests were followed up with Wilcoxon signed-rank tests using a Bonferroni correction. To retain as many participants in the analyses as possible, additional comparisons between baseline and each respective follow-up were examined individually using t-tests (ratio data) and Wilcoxon tests (ordinal data). Significance testing was conducted with alpha at p = .05. Significantly skewed dependent variables were analyzed with and without log transformation. Transformations did not change the interpretation or significance of any result, and therefore, the non-transformed data are presented for ease of interpretation.
Results
Participant Characteristics
Demographic and baseline clinical characteristics are displayed in Table 1. The vast majority of participants were female (n = 513, 94.8%) and described their ethnicity as White (n = 510, 94.3%). Eighty-one percent had a bachelor’s degree or higher. Fifty-seven percent were employed full-time, 12.8% were employed part-time, and 14.2% were self-employed.
Table 1.
Sociodemographic and Clinical Characteristics of the Full Sample
| Participant Characteristics |
N=533–541 |
|
|---|---|---|
| M (SD) | N (%) | |
| Age (years) | 42.9 (9.5) | |
| Gender | ||
| Female | 513 (94.8%) | |
| Male | 24 (4.4%) | |
| Other | 4 (0.8%) | |
| Highest Level of Education | ||
| Less than a high school diploma | 1 (0.2%) | |
| High school degree or equivalent (e.g. GED) | 11 (2.0%) | |
| Some college, no degree | 56 (10.4%) | |
| Associate degree | 31 (5.7%) | |
| Bachelor’s degree | 242 (44.7%) | |
| Master’s degree | 147 (27.2%) | |
| Professional degree/doctorate | 53 (9.8%) | |
| Employment Status | ||
| Unemployed | 32 (5.9%) | |
| Student | 10 (1.8%) | |
| Employed | 379 (70.1%) | |
| Self-employed | 77 (14.2%) | |
| Retired | 15 (2.8%) | |
| Homemaker | 28 (5.2%) | |
| Race | ||
| Hispanic/Latino | 9 (1.7%) | |
| Asian | 3 (0.6%) | |
| American Indian/Alaska Native | 4 (0.7%) | |
| Black or African American | 7 (1.3%) | |
| White | 510 (94.3%) | |
| Native Hawaiian | 1 (0.2%) | |
| Other | 7 (1.3%) | |
| Marital Status | ||
| Single/never married | 104 (19.2%) | |
| Married | 291 (53.8%) | |
| Cohabitating/living together | 41 (7.6%) | |
| Divorced/separated/widowed | 105 (19.4%) | |
| Meets Criteria for AUD | 524 (96.9%) | |
| Mild AUD | 18 (3.3%) | |
| Moderate AUD | 49 (9.1%) | |
| Severe AUD | 457 (84.5%) | |
| Drug Use | 201 (37.2%) | |
| Tobacco Use | 150 (27.7%) | |
| Years Alcohol Has Been Problem | 14.5 (9.2) | |
| Number of AUD Symptoms | 8.2 (2.6) | |
| Percentage of Drinking Days | 48.9 (35.2) | |
| Percentage of Binge Drinking Days | 36.9 (33.8) | |
| Drinks per Typical Drinking Day | 4.0 (3.4) | |
| Alcohol Craving | 2.2 (1.0) | |
| PHQ-8 | 9.6 (5.2) | |
| GAD-7 | 8.0 (5.0) | |
Note. AUD = Alcohol use disorder. PHQ-8 = Patient Health Questionniare-8. GAD-7= Generalized Anxiety Disorder-7. Drug use coded as yes/no past 30 days and includes: marijuana, sedatives, cocaine, stimulants, opioids, and inhalants. Craving coded as 0–4 representing: not at all, slightly, moderately, considerably, extremely, respectively. Criteria for AUD is the presence of at least 2 of these symptoms. Mild = the presence of 2 to 3 symptoms. Moderate = the presence of 4 to 5 symptoms. Severe = the presence of 6 or more symptoms.
At baseline, participants reported consuming alcohol on approximately half of the days in the past month (48.9%, SD = 35.2), consuming an estimated four (SD = 3.4) standard drinks on a typical drinking day. Binge drinking days in the past month was 36.9% (SD = 33.9), or approximately 11 days per month.
Tobacco use (including vaping) was reported by 29.3% of the sample, with a mean of 60.9% (SD = 39.4) of days over the past 30 days at baseline. Other drug use (excluding tobacco use) was relatively infrequent. Of the entire sample, 37.2% (n = 201) reported past 30-day drug use at baseline. The most commonly used drug was marijuana (n = 123, 22.7%), followed by sedatives (n = 85, 15.7%), stimulants (n = 25, 4.6%), opioids (n = 22, 4.1%), cocaine (n = 12, 2.2%) and inhalants (n = 3, 0.6%). Average drug use frequency at baseline of those reporting use of each respective drug was as follows: marijuana on 36.2% (SD = 3.7) of days, sedatives on 31.2% (SD = 33.3) of days, cocaine on 20.3% (SD = 30.0) of days, stimulants on 39.3% (SD = 40.8) of days, opioids on 26.8% (SD = 29.5) of days, and inhalants on 20% (SD = 5.8) of days.
Study Retention
Follow-up rates for the Month 2, Month 6, and Month 12 assessments were 59.7% (n = 323), 47.9% (n = 259), and 24.6% (n = 134), respectively. A total of 72 (13.3%) participants completed all assessment points. Individuals completing all follow-ups compared to those missing at least one follow-up were more likely to be White (98.6% vs. 91.3%; p = .031), endorse drug use in the last 30 days (39% vs. 25%; p = .026), report consuming fewer drinks per typical drinking day (3.3 vs. 4.1, p = .045), and report less alcohol craving (1.9 vs. 2.2, p = .041). Individuals completing the Month 2 follow-up compared to those missing the same tended to have higher levels of education (college degree: 91.3% vs. 81.7%, p = .001) and reported drinking more heavily (percentage of binge drinking days: 34.5 vs. 40.5, p =.047; drinks per typical drinking day: 3.7 vs. 4.5, p = .015). Individuals completing the Month 6 follow-up compared to those missing the same reported drinking more frequently (percentage of drinking days: 43.3 vs. 54.0, p < .001) and more heavily (percentage of binge drinking days: 30.7 vs. 42.6, p < .001; drinks per typical drinking day: 3.5 vs. 4.5, p < .001) and reported greater alcohol craving (2.1 vs. 2.3, p = .014). There were no significant differences across baseline characteristics according to Month 12 follow-up completion status.
Alcohol and Other Drug Use
Changes in outcome variables across time are reported in Table 2. Additionally, the percentage of drinking days and heavy drinking days are illustrated in Figure 1. Alcohol craving and three specific alcohol consumption outcomes were evaluated: percentage of drinking days, percentage of binge drinking days, and drinks per drinking day. Across all alcohol outcomes, statistically significant gains were made from baseline to Month 2, and these changes were maintained at Month 6 and Month 12, both according to repeated measures tests with pairwise comparisons of the sample who completed all follow-ups and with separate analyses of baseline and each respective follow-up (all ps < .001). Alcohol craving levels significantly reduced from an average rating of moderately to an average rating of slightly at the end of the program (Month 2), and this change was maintained at Month 6 and Month 12. Percentage of drinking days decreased by more than half at Month 2 (41.9 to 21.6), and change was sustained at Month 6 (21.7) and Month 12 (18.5). A similar pattern was revealed for the percentage of binge drinking days. The amount of alcohol consumed on a typical drinking day also showed a marked decrease, from 3.5 to 1.5 standard drinks, a decrease maintained through the Month 6 and Month 12 assessment. The percentage of drug use days did not significantly change for individuals who completed all follow-ups (F(2.40, 170.54) = 1.66, p = .176). However, when examining a larger subset of the participants at each follow-up, significant reductions in drug use frequency were revealed at each follow-up (ps ≤ .009).
Table 2.
Change in outcome variables across time.
| Baseline | Month 2 | Month 6 | Month 12 | Statistics | |
|---|---|---|---|---|---|
| Outcomes | M (SD) | ||||
| Alcohol Craving | |||||
| A (n = 72) | 1.9 (1.2) | 1.3 (1.0) | 1.0 (0.9) | 0.9 (1.0) | X2(3) = 58.22, p < .001 |
| B (n = 323) | 2.2 (1.1) | 1.6 (1.0) | - | - | Z = −8.18, p < .001 |
| C (n = 259) | 2.1 (1.1) | - | 1.2 (1.0) | - | Z = −9.35, p < .001 |
| D (n = 134) | 2.0 (1.1) | - | - | 1.1 (1.1) | Z = −7.58, p < .001 |
| Percentage of Drinking Days | |||||
| A (n = 66) | 41.9 (35.8) | 21.6 (31.9) | 21.7 (33.6) | 18.5 (30.7) | F(2.20,142.82) = 17.03, p < .001 |
| B (n = 312) | 45.6 (35.0) | 23.7 (30.8) | - | - | t(311) = 12.12, p < .001 |
| C (n = 252) | 42.9 (35.1) | - | 22.5 (31.1) | - | t(251) = 8.88, p < .001 |
| D (n = 132) | 43.9 (35.5) | - | - | 20.7 (31.9) | t(131) = 8.17, p < .001 |
| Percentage of Binge Drinking Days | |||||
| A (n = 71) | 32.4 (33.9) | 9.7 (19.3) | 14.5 (27.8) | 10.0 (21.8) | F(1.93,135.05) = 27.07 p < .001 |
| B (n = 312) | 34.1 (33.2) | 13.5 (23.8) | - | - | t(311) = 12.90, p < .001 |
| C (n = 252) | 30.4 (32.3) | - | 13.8 (25.4) | - | t(251) = 8.28, p < .001 |
| D (n = 134) | 33.3 (34.1) | - | - | 13.1 (25.3) | t(133) = 7.97, p < .001 |
| Drinks per Typical Drinking Day (N=70) | |||||
| A (n = 70) | 3.1 (2.8) | 1.4 (2.0) | 1.4 (2.2) | 1.3 (2.5) | F(2.35,162.12) = 19.75 p < .001 |
| B (n = 321) | 3.7 (3.5) | 1.9 (2.8) | - | - | t(320) = 9.78, p < .001 |
| C (n = 255) | 3.4 (3.4) | - | 1.6 (2.3) | - | t(254) = 9.46, p < .001 |
| D (n = 131) | 3.8 (3.5) | - | - | 2.1 (3.3) | t(133)=7.97, p < .001 |
| Percentage of Drug Use Days | |||||
| A (n = 72) | 9.3 (24.0) | 5.9 (18.6) | 9.4 (28.4) | 4.3 (13.0) | F(2.40, 170.54) = 1.66, p = .176 |
| B (n = 323) | 14.8 (33.4) | 7.2 (19.8) | - | - | t(322) = 5.45, p < .001 |
| C (n = 259) | 16.2 (34.9) | - | 9.1 (24.6) | - | t(258) = 3.84, p < .001 |
| D (n = 132) | 12.4 (28.3) | - | - | 6.4 (17.7) | t(131) = 2.63, p = .009 |
| Number of AUD Symptoms | |||||
| A (n = 88) | 8.1 (2.9) | n/a | 2.7 (3.5) | 2.1 (3.2) | F(1.53,133.30) = 159.85, p < .001 |
| B | - | - | - | - | - |
| C (n = 259) | 8.0 (2.7) | - | 2.8 (3.4) | t(258) = 21.72, p < .001 | |
| D (n = 134) | 8.3 (2.9) | - | - | 2.8 (3.6) | t(133) = 15.79, p < .001 |
| PHQ-8 | |||||
| A (n = 72) | 9.0 (5.6) | 6.2 (5.3) | 5.9 (5.3) | 5.7 (5.0) | F(2.62,185.89) = 15.07, p < .001 |
| B (n = 323) | 9.5 (5.3) | 6.7 (4.5) | - | - | t(322) = 10.77, p < .001 |
| C (n = 259) | 9.2 (5.3) | - | 6.3 (5.0) | - | t(258) = 9.14, p < .001 |
| D (n = 134) | 9.6 (5.7) | - | - | 6.4 (5.1) | t(133) = 7.21, p < .001 |
| GAD-7 | |||||
| A (n = 72) | 7.4 (4.8) | 5.3 (4.4) | 4.8 (4.4) | 4.5 (4.3) | F(3, 213) = 13.03, p < .001 |
| B (n = 323) | 8.0 (5.0) | 5.7 (4.3) | - | - | t(322) = 9.33, p < .001 |
| C (n = 259) | 7.6 (4.9) | - | 5.4 (4.6) | - | t(258) = 8.08, p < .001 |
| D (n = 134) | 8.3 (5.0) | - | - | 5.3 (4.6) | t(133) = 7.00, p < .001 |
| Physical Health | |||||
| A (n = 72) | 1.7 (1.0) | 2.3 (1.0) | 2.4 (1.0) | 2.5 (1.0) | X2(3) = 44.64, p < .001 |
| B (n = 323) | 1.8 (1.0) | 2.2 (1.0) | - | - | Z = −8.11, p < .001 |
| C (n = 259) | 1.7 (1.0) | - | 2.3 (1.0) | - | Z = −7.19, p < .001 |
| D (n = 134) | 1.7 (1.0) | - | - | 2.2 (1.1) | Z = −5.74, p < .001 |
| Quality of Life | |||||
| A (n = 72) | 2.0 (0.9) | 2.4 (1.0) | 2.5 (0.9) | 2.6 (0.9) | X2(3) = 38.93, p < .001 |
| B (n = 323) | 1.9 (0.9) | 2.4 (1.0) | - | - | Z = −7.55, p < .001 |
| C (n = 259) | 1.9 (0.9) | - | 2.4 (1.0) | - | Z = −7.13, p < .001 |
| D (n = 134) | 2.0 (0.9) | - | - | 2.5 (1.0) | Z = −6.19, p < .001 |
| Meditate | |||||
| A (n = 72) | 1.3 (1.3) | 2.3 (1.4) | 1.9 (1.4) | 1.9 (1.4) | X2(3) = 41.59, p < .001 |
| B (n = 323) | 1.2 (1.3) | 2.3 (1.4) | - | - | Z = −11.58, p < .001 |
| C (n = 259) | 1.3 (1.3) | - | 1.7 (1.4) | - | Z = −4.30, p < .001 |
| D (n = 134) | 1.1 (1.2) | - | - | 1.7 (1.4) | Z = −4.94, p < .001 |
| Exercise | |||||
| A (n = 72) | 2.5 (1.3) | 2.6 (1.3) | 2.7 (1.1) | 2.6 (1.1) | X2(3)=3.40, p = .265 |
| B (n = 323) | 2.5 (1.3) | 2.6 (1.2) | - | - | Z= −2.66, p = .008 |
| C (n = 259) | 2.5 (1.2) | - | 2.6 (1.1) | - | Z=−1.86, p < .001 |
| D (n = 134) | 2.3 (1.3) | - | - | 2.5 (1.2) | Z=−2.82, p = .005 |
Note.
AUD = Alcohol use disorder. A = comparing all timepoints; B = baseline and Month 2; C = baseline and Month 6; D = baseline and Month 12.
Figure 1.
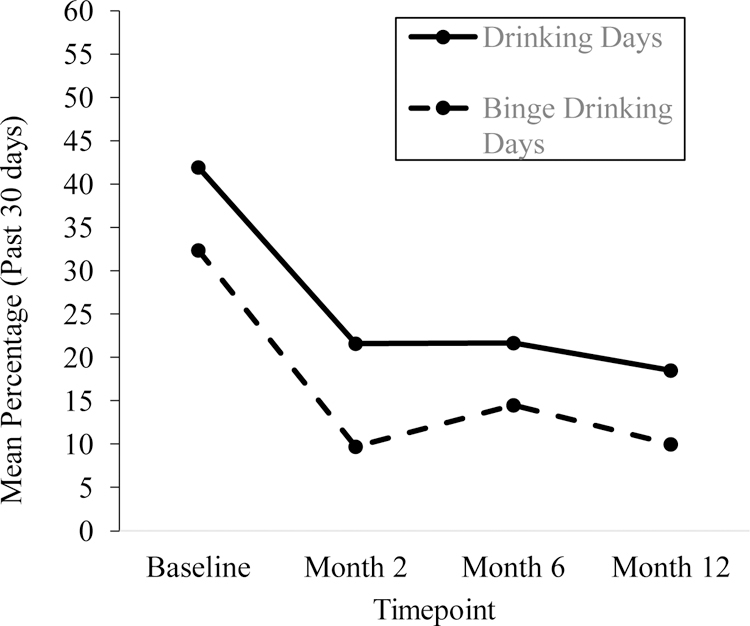
Percentage of drinking days and percentage of binge drinking days at baseline and at Month 2, 6, and 12 follow-up assessments (N=72).
Alcohol Use Disorder Symptomology
Alcohol use symptomatology was assessed at Baseline, Month 6, and Month 12. There was a significant decrease in the average number of symptoms reported at Baseline (8.1, representative of severe AUD) to Month 6 (2.7, mild AUD); change was sustained at Month 12 (2.1, mild AUD) (F(1.53,133.30) = 159.85 p < .001). At baseline, 95.8% (69/72) of the sample met the criteria for AUD; less than half of the sample (32/72, 44.4%) met this threshold at Month 6 and 36.1% (26/72) at Month 12.
Mental Health
Both anxiety and depressive symptom scores declined in severity throughout the program. For depressive symptoms, average PHQ-8 Score went from 9.0 to 6.2 at Month 2 and maintained at Month 6 (5.9) and Month 12 (5.7). For anxiety, average GAD-7 score decreased from 7.4 to 5.3 at baseline and maintained at Month 6 (4.8) and Month 12 (4.5). At baseline, 27.8% (n = 20/72) of the sample who completed all follow-ups reported a score of 10 or more suggestive of a diagnosis of GAD. This rate decreased at Month 2 (15.3%) and maintained at Month 6 and 12 (11.1% and 12.5%, respectively). At baseline, 41.7% (n = 30/72) of the sample reported a 10 or greater, indicative of moderate depressive symptoms. This rate decreased to 22.2% at Month 2 and maintained at Month 6 and 12 (22.2% and 16.7%, respectively).
Physical Health and Quality of Life
Physical health and quality of life improved from baseline to Month 2, and the change was maintained at Month 6 and Month 12 (ps <.001). Physical health increased from a score of 1.7 (Fair-Poor) at baseline to 2.3–2.5 (Good-Very good) at follow-ups. Quality of life increased from a score of 2.0 at baseline, reflecting a rating of Good, to 2.4–2.6, reflecting a rating in the Good-Very Good range, at follow-ups.
Health-Related Behaviors
Meditation frequency (categories coded as 0–4, see measures section) significantly increased from an average frequency of one to three times per month (M = 1.1–1.3, SD = 1.2–1.3) at baseline to once per week (M = 1.9–2.3, SD = 1.4) at follow-ups (ps <.001). Exercise frequency also increased, but this change was not significant when examining change across time among participants completing all timepoints. However, examination of baseline and each respective follow-up revealed statistically significant increases (ps ≤.008). Of the 72 participants completing all follow-ups, 43 (59.7%) reported exercising at least once per week at baseline, 46 (63.9%) at Month 2, 51 (70.8%) at Month 6, and 46 (63.9%) at Month 12.
Discussion
This systematic outcome evaluation study aimed to characterize individuals participating in Tempest Sobriety School and examine short and long-term outcomes for those enrolled in the program. Enrollees tended to be highly educated, employed, White women in their early 40s who met criteria for AUD and had a long-standing history of problematic alcohol use. Approximately 27% of the sample used tobacco and 37% used drugs other than alcohol.
Although women generally seek alcohol use treatment less frequently than men (Chen et al., 2020; Mellinger et al., 2019; National Institute on Alcohol Abuse and Alcoholism, 2020), the current sample was comprised of primarily women. The percentage of women in the current study (94.8%) is also higher than that of other Internet-based recovery related programs, which range from 51 to 71% (Linke et al., 2007; Pennay et al., 2018). This is not entirely surprising, as Tempest Sobriety School advertises their program as feminine-centric which may be particularly appealing to women.
This study examined changes in alcohol and other drug use, mental health symptoms, and other health-related outcomes for individuals participating in Tempest Sobriety School. Results of this study support self-reported positive change from baseline to the end of the program across all measured domains of functioning. Particularly noteworthy is that these positive changes were durably maintained over time among follow-up survey respondents, with limited, if any, reduction evident at the Month 6 and Month 12 assessments. Specifically, program participants reported experiencing significant reductions in their alcohol and other drug use (marked decreases in percentage of drinking days, percentage of binge drinking days, drinks per drinking day, and other drug use days). Similarly, participants noted marked decrease in alcohol use disorder symptomatology and alcohol use craving. Participants reported improvements in mental health (evidenced by PHQ-9 and GAD-7), physical health (increased engagement in meditation and exercise), and overall quality of life.
The results of this evaluation were consistent at multiple levels of investigation (comparison across all timepoints and individual comparison of baseline and each follow-up). The only exceptions to this were in the percentage of drug use days and in exercise frequency, which did not reach statistical significance when examining change across all timepoints. There was however a significant reduction in percentage of drug use days and a significant increase in engagement in exercise when examining change from baseline to each follow-up. One potential explanation for this discrepancy is that there may be limited power to detect an effect in the comparisons across all timepoints given that only 72 people completed all assessments.
Findings from this outcome evaluation have several implications and provide important data for Tempest Sobriety School stakeholders, potential participants, and funders. Descriptive data about the individuals seeking services from Tempest Sobriety School help to not only contextualize the study results but also provide valuable information to stakeholders regarding who is using their services. Such information about the population served can inform service delivery approaches, marketing efforts, and allocation of resources. In terms of outcome data, results confirm that program participants who completed research assessments are experiencing the intended outcomes, and these outcomes are present in the short- and long-term. These results provide promising support for Tempest Sobriety School. Also of note is that the methods used in the present study might serve as a guide and be transferrable to the evaluation of other web-based interventions.
The interpretation of our findings should be viewed in the context of the study’s limitations. First, a fraction of participants (13.3%) completed all follow-ups, and completion rates of baseline assessment and each respective follow-up ranged from 24.6–59.7%. Participant retention could bias the data in unknown ways to the degree that responders were not representative of the population of Tempest students. Sample comparisons indicated that there were, in fact, some baseline differences between responders and non-responders. For instance, participants who completed all follow-ups tended to report overall greater health at baseline and less alcohol and drug use. Therefore, it is possible that outcomes could be less favorable for those who missed follow-ups. To reduce potential for bias, future studies could benefit from additional efforts to increase assessment completion rates. Second, this study relied on self-report data and did not have biochemical verification of alcohol or drug use. Although self-report data may be unreliable, recent research suggests that self-report of substance use is highly consistent with biochemical data (Del Boca & Darkes, 2003; Linas et al., 2016; Simons et al., 2015). Lastly, study measures generally assessed behavior over the past 30 days rather than covering the entire span of follow-up. The reporting window was restricted to reduce participant burden, but it is possible that a 30-day window may be a biased sample of the full-time interval covered in a follow-up of, say, 6 months.
There are several areas for future research. Future research and evaluation efforts could extend the current study to include a wait-list control group, which would lend itself to making causal inferences about the program’s effects. Such a study design will likely present challenges, however, given ethical and logistical considerations present with a private program such as Tempest Sobriety School. Alternative or supplemental service delivery approaches could be considered (e.g., provision of individual therapy in addition to online recovery services) and even compared to the stand-alone online services. A quasi-experimental research evaluation is currently underway that includes a control group (email newsletter only), as well as additional service delivery designs. Another area of interest is in examining the active ingredients of Tempest Sobriety Services, which can inform program efforts (Magill et al., 2015). Indeed, data collection is ongoing for another cohort of individuals enrolling in Tempest Sobriety School with a focus on starting to understand its mechanisms of action. Finally, the present outcome evaluation model, which has now been successfully applied to two private freestanding addiction programs (i.e. current study and Connors et al., 2017), can be applied to evaluate other similar programs.
Conclusion
Tempest Sobriety School provides evidence-informed online alcohol recovery services. In light of the barriers to traditional alcohol use recovery services and recent restrictions to in-person care due to the COVID-19 pandemic, services such as this are particularly relevant. This study provides data that support positive changes across time for individuals enrolled in Tempest Sobriety School. Participants reported improvements in their alcohol and other substance use, overall physical and mental health, and quality of life. The positive changes observed in this study provide promising support for Tempest Sobriety School. The results of this study also support the applicability and utility of the current outcome evaluation model. Continued application of such outcome evaluations can provide important information for stakeholders (e.g., treatment providers, treatment program managers), funders, prospective enrollees, and the general public.
Acknowledgments
Declaration of interest statement
This work was supported by Tempest Sobriety School and the National Institute on Alcohol Abuse and Alcoholism under Grant number 2K05 AA16928 awarded to Stephen A. Maisto.
Footnotes
Disclosure statement
The authors of this article have no conflicts of interest.
The item assessing typical drinking day was added to supplement items on the BAM.
References
- Cacciola JS, Alterman AI, DePhilippis D, Drapkin ML, Valadez C Jr., Fala NC, Oslin D, & McKay JR (2013). Development and initial evaluation of the Brief Addiction Monitor (BAM). Journal of Substance Abuse Treatment, 44(3), 256–263. 10.1016/j.jsat.2012.07.013 [DOI] [PMC free article] [PubMed] [Google Scholar]
- Camille R (2018). Computer and Internet Use in the United States: 2016. (American Community Survey Reports, ACS-39). U.S. Census Bureau. [Google Scholar]
- Chartier KG, Miller K, Harris TR, & Caetano R (2016). A 10-year study of factors associated with alcohol treatment use and non-use in a U.S. population sample. Drug and Alcohol Dependence, 160, 205–211. 10.1016/j.drugalcdep.2016.01.005 [DOI] [PMC free article] [PubMed] [Google Scholar]
- Chen JA, Glass JE, Bensley KM, Goldberg SB, Lehavot K, & Williams EC (2020). Racial/ethnic and gender differences in receipt of brief intervention among patients with unhealthy alcohol use in the U.S. Veterans Health Administration. Journal of Substance Abuse Treatment, 119, 108078. 10.1016/j.jsat.2020.108078 [DOI] [PMC free article] [PubMed] [Google Scholar]
- Cohen E, Feinn R, Arias A, & Kranzler HR (2007). Alcohol treatment utilization: Findings from the National Epidemiologic Survey on Alcohol and Related Conditions. Drug and Alcohol Dependence, 86(2–3), 214–221. 10.1016/j.drugalcdep.2006.06.008 [DOI] [PubMed] [Google Scholar]
- Connors GJ, Maisto SA, Campbell CE, To B, & Sack D (2017). Conducting systematic outcome assessment in private addictions treatment settings. Substance Abuse: Research and Treatment, 11, 1–9. 10.1177/1178221817719239 [DOI] [PMC free article] [PubMed] [Google Scholar]
- Degenhardt L, Glantz M, Evans-Lacko S, Sadikova E, Sampson N, Thornicroft G, Aguilar-Gaxiola S, Al-Hamzawi A, Alonso J, Helena Andrade L, Bruffaerts R, Bunting B, Bromet EJ, Miguel Caldas de Almeida J, de Girolamo G, Florescu S, Gureje O, Maria Haro J, Huang Y, … World Health Organization’s World Mental Health Surveys collaborators. (2017). Estimating treatment coverage for people with substance use disorders: An analysis of data from the World Mental Health Surveys. World Psychiatry, 16(3), 299–307. 10.1002/wps.20457 [DOI] [PMC free article] [PubMed] [Google Scholar]
- Del Boca FK, & Darkes J (2003). The validity of self-reports of alcohol consumption: State of the science and challenges for research. Addiction, 98(Suppl. 2), 1–12. 10.1046/j.1359-6357.2003.00586.x [DOI] [PubMed] [Google Scholar]
- Downey L, Rosengren DB, & Donovan DM (2003). Gender, waitlists, and outcomes for public-sector drug treatment. Journal of Substance Abuse Treatment, 25(1), 19–28. 10.1016/s0740-5472(03)00046-1 [DOI] [PubMed] [Google Scholar]
- Esser MB (2020). Deaths and years of potential life lost from excessive alcohol use—United States, 2011–2015. Morbidity and Mortality Weekly Report, 69(30), 981–987. 10.15585/mmwr.mm6930a1 [DOI] [PMC free article] [PubMed] [Google Scholar]
- Flynn PM, Craddock SG, Hubbard RL, Anderson J, & Etheridge RM (1997). Methodological overview and research design for the Drug Abuse Treatment Outcome Study (DATOS). Psychology of Addictive Behaviors, 11(4), 230–243. 10.1037/0893-164X.11.4.230 [DOI] [Google Scholar]
- Grant BF (1997). Barriers to alcoholism treatment: Reasons for not seeking treatment in a general population sample. Journal of Studies on Alcohol, 58(4), 365–371. 10.15288/jsa.1997.58.365 [DOI] [PubMed] [Google Scholar]
- Greenfield SF, Brooks AJ, Gordon SM, Green CA, Kropp F, McHugh RK, Lincoln M, Hien D, & Miele GM (2007). Substance abuse treatment entry, retention, and outcome in women: A review of the literature. Drug and Alcohol Dependence, 86(1), 1–21. 10.1016/j.drugalcdep.2006.05.012 [DOI] [PMC free article] [PubMed] [Google Scholar]
- Hernandez-Avila CA, Rounsaville BJ, & Kranzler HR (2004). Opioid-, cannabis- and alcohol-dependent women show more rapid progression to substance abuse treatment. Drug and Alcohol Dependence, 74(3), 265–272. 10.1016/j.drugalcdep.2004.02.001 [DOI] [PubMed] [Google Scholar]
- International Telecommunication Union. (2019). Measuring digital development: Facts and figures 2019. International Telecommunication Union, Geneva. https://www.itu.int/en/ITU-D/Statistics/Documents/facts/FactsFigures2019.pdf [Google Scholar]
- Kroenke K, Spitzer RL, & Williams JB (2001). The PHQ-9: Validity of a brief depression severity measure. Journal of General Internal Medicine, 16(9), 606–613. 10.1046/j.1525-1497.2001.016009606.x [DOI] [PMC free article] [PubMed] [Google Scholar]
- Kroenke K, Strine TW, Spitzer RL, Williams JB, Berry JT, & Mokdad AH (2009). The PHQ-8 as a measure of current depression in the general population. Journal of Affective Disorders, 114(1–3), 163–173. 10.1016/j.jad.2008.06.026 [DOI] [PubMed] [Google Scholar]
- Linas BS, Genz A, Westergaard RP, Chang LW, Bollinger RC, Latkin C, & Kirk GD (2016). Ecological momentary assessment of illicit drug use compared to biological and self-reported methods. Journal of Medical Internet Research mHealth uHealth, 4(1), e27. 10.2196/mhealth.4470 [DOI] [PMC free article] [PubMed] [Google Scholar]
- Linke S, Murray E, Butler C, & Wallace P (2007). Internet-based interactive health intervention for the promotion of sensible drinking: Patterns of use and potential impact on members of the general public. Journal of Medical Internet Research, 9(2), e10. [DOI] [PMC free article] [PubMed] [Google Scholar]
- Magill M, Kiluk BD, McCrady BS, Tonigan S, & Longabaugh R (2015). Active ingredients of treatment and client mechanisms of change in behavioral treatments for alcohol use disorders: Progress 10 years later. Alcoholism, Clinical and Experimental Research, 39(10), 1852–1862. 10.1111/acer.12848 [DOI] [PMC free article] [PubMed] [Google Scholar]
- McCrady BS, Epstein EE, & Fokas KF (2020). Treatment interventions for women with alcohol use disorder. Alcohol Research: Current Reviews, 40(2), 8. 10.35946/arcr.v40.2.08 [DOI] [PMC free article] [PubMed] [Google Scholar]
- Mellinger JL, Fernandez A, Shedden K, Winder GS, Fontana RJ, Volk ML, Blow FC, & Lok ASF (2019). Gender disparities in alcohol use disorder treatment among privately insured patients with alcohol-associated cirrhosis. Alcoholism, Clinical and Experimental Research, 43(2), 334–341. 10.1111/acer.13944 [DOI] [PMC free article] [PubMed] [Google Scholar]
- National Institute on Alcohol Abuse and Alcoholism. (2020). Alcohol Facts and Statistics. https://www.niaaa.nih.gov/publications/brochures-and-fact-sheets/alcohol-facts-and-statistics
- Newcomer KE, Hatry HP, & Wholey JS (2015). Planning and designing useful evaluations. In Newcomer KE, Hatry HP, & Wholey JS (Eds.), Handbook of practical program evaluation (3rd ed., pp. 5–29). Jossey-Bass. 10.1002/9781119171386.ch1 [DOI] [Google Scholar]
- Pennay A, MacLean S, Rankin G, & O’Rourke S (2018). Hello Sunday Morning: Strategies used to support temporary alcohol abstinence through participation in an online health promotion program. Health Promotion Journal of Australia, 29(3), 321–327. 10.1002/hpja.22 [DOI] [PubMed] [Google Scholar]
- Redko C, Rapp RC, & Carlson RG (2006). Waiting time as a barrier to treatment entry: Perceptions of substance users. Journal of Drug Issues, 36(4), 831–852. 10.1177/002204260603600404 [DOI] [PMC free article] [PubMed] [Google Scholar]
- Rehm J, Svetlana C, & Popova M (2009). Global burden of disease and injury and economic cost attributable to alcohol use and alcohol-use disorders. Lancet, 373(9682), 2223–2233. 10.1016/S0140-6736(09)60746-7 [DOI] [PubMed] [Google Scholar]
- Rio C. del, & Malani PN (2020). COVID-19—New insights on a rapidly changing epidemic. JAMA, 323(14), 1339–1340. 10.1001/jama.2020.3072 [DOI] [PubMed] [Google Scholar]
- Sacks JJ, Gonzales KR, Bouchery EE, Tomedi LE, & Brewer RD (2015). 2010 National and state costs of excessive alcohol consumption. American Journal of Preventive Medicine, 49(5), e73–e79. 10.1016/j.amepre.2015.05.031 [DOI] [PubMed] [Google Scholar]
- Sayer LC (2016). Trends in women’s and men’s time use, 1965–2012: Back to the future? In McHale SM, King V, Van Hook J, & Booth A (Eds.), Gender and couple relationships (pp. 43–77). Springer International Publishing. 10.1007/978-3-319-21635-5_2 [DOI] [Google Scholar]
- Simons JS, Wills TA, Emery NN, & Marks RM (2015). Quantifying alcohol consumption: Self-report, transdermal assessment, and prediction of dependence symptoms. Addictive Behaviors, 50, 205–212. 10.1016/j.addbeh.2015.06.042 [DOI] [PMC free article] [PubMed] [Google Scholar]
- Spitzer RL, Kroenke K, Williams JB, & Löwe B (2006). A brief measure for assessing generalized anxiety disorder: The GAD-7. Archives of Internal Medicine, 166(10), 1092– 10.1001/archinte.166.10.1092 [DOI] [PubMed] [Google Scholar]
- Substance Abuse and Mental Health Services Administration. (2018a). 2018 National Survey on Drug Use and Health (NSDUH). Table 2.1B—Tobacco Product and Alcohol Use in Lifetime, Past Year, and Past Month among Persons Aged 12 or Older, by Age Group: Percentages, 2017 and 2018. https://www.Samhsa.Gov/Data/Sites/Default/Files/Cbhsq-Reports/NSDUHDetailedTabs2018R2/NSDUHDetTabsSect2pe2018.Htm#tab2-1b.
- Substance Abuse and Mental Health Services Administration. (2018b). 2018 National Survey on Drug Use and Health (NSDUH). Table 5.4A—Alcohol Use Disorder in Past Year among Persons Aged 12 or Older, by Age Group and Demographic Characteristics: Numbers in Thousands, 2017 and 2018. https://www.Samhsa.Gov/Data/Sites/Default/Files/Cbhsq-Reports/NSDUHDetailedTabs2018R2/NSDUHDetTabsSect5pe2018.Htm#tab5-4a.
- Substance Abuse and Mental Health Services Administration. (2018c). 2018 National Survey on Drug Use and Health (NSDUH). Table 5.4B—Alcohol Use Disorder in Past Year among Persons Aged 12 or Older, by Age Group and Demographic Characteristics: Percentages, 2017 and 2018. https://www.Samhsa.Gov/Data/Sites/Default/Files/Cbhsq-Reports/NSDUHDetailedTabs2018R2/NSDUHDetTabsSect5pe2018.Htm#tab5-4b.
- Tiffany ST, Friedman L, Greenfield SF, Hasin DS, & Jackson R (2012). Beyond drug use: A systematic consideration of other outcomes in evaluations of treatments for substance use disorders. Addiction (Abingdon, England), 107(4), 709–718. 10.1111/j.1360-0443.2011.03581.x [DOI] [PMC free article] [PubMed] [Google Scholar]
- White WL, & Chaney R (1992). Metaphors of transformation: Feminine and masculine. Bloomington, IL: Chestnut Health System. [Google Scholar]