

Abstract
A deep understanding of how discrimination impacts psychological health and well-being of students could allow us to better protect individuals at risk and support those who encounter discrimination. While the link between discrimination and diminished psychological and physical well-being is well established, existing research largely focuses on chronic discrimination and long-term outcomes. A better understanding of the short-term behavioral correlates of discrimination events could help us to concretely quantify such experiences, which in turn could support policy and intervention design. In this paper we specifically examine, for the first time, what behaviors change and in what ways in relation to discrimination. We use actively-reported and passively-measured markers of health and well-being in a sample of 209 first-year college students over the course of two academic quarters. We examine changes in indicators of psychological state in relation to reports of unfair treatment in terms of five categories of behaviors: physical activity, phone usage, social interaction, mobility, and sleep. We find that students who encounter unfair treatment become more physically active, interact more with their phone in the morning, make more calls in the evening, and spend more time in bed on the day of the event. Some of these patterns continue the next day. Our results further our understanding of the impact of discrimination and can inform intervention work.
Keywords: Mobile Sensing, Mobile Health, Discrimination, Microaggression
1. INTRODUCTION
Discrimination is a familiar experience for many groups in our society, with between one in three [30] and one in four [2] adults reporting the experience as stressful. Discrimination is defined as differential treatment individuals or groups of people or the disparate impact of institutionalized processes on them [45]. It is different from but can be caused by prejudice, stereotypes, and ideologies such as racism or sexism. Discriminatory encounters are ubiquitous, occurring in varied contexts, from social interactions with peers, to workplace environments, to stores, to encounters with law enforcement, to educational settings [17]. Experiences of discrimination are undeniably consequential for the life trajectory of young people, particularly students. For example, discrimination, bias, micro-aggressions, and other forms of “othering” discourage many minorities from pursuing education in fields that are dominated by the privileged majority (e.g., [56]), such as STEM (Science, Technology, Engineering, and Mathematics). Sadly, discrimination is real and goes beyond the perceptions of the individual facing it and may directly impact success in the field as well as career prospects. For example, Moss-Racusin et al. [41] show that students’ resumes with randomly assigned male names are rated as more competent, hireable, and worthy of more mentoring and pay than those same resumes when they are randomly assigned a female name. Williams et al. [78] present empirical evidence for salary estimation bias that can lead to employers offering lower pay to women workers who themselves are less likely to negotiate for equal pay. There are also long-term negative health consequences of exposure to discrimination and the stress it produces. For instance, heightened blood pressure, heart rate, and cortisol secretions, markers of heart disease [11, 37], have been reported in relation to perceived racism [6, 65, 69]. There is also considerable evidence for the harmful effects of discrimination on mental health [47]. For example, Kessler et al. [30] report major depression, generalized anxiety disorders, and psychological distress associated with lifetime discrimination that are comparable in magnitude to those of major life events such as sexual assault. Day-to-day experiences of micro-aggressions (subtle forms of discrimination) are similarly deleterious to health as expressed by [67] and empirically supported by [44]:
In and of itself a micro-aggression may seem harmless, but the cumulative burden of a lifetime of micro-aggressions can theoretically contribute to diminished mortality, augmented morbidity, and flattened confidence ([49], p. 281)
Thus, there is unique potential for significant societal impact if we better understand how young adults experience discrimination.
If we can concretely quantify discrimination not only in terms of its prevalence but also in terms of its short-term impact on health and behavior, then we can better reason about pathways that connect short-term impact to long-term outcome disparities.
However, it has been difficult to effectively measure the day-to-day impact of discrimination.
Past research examining short-term influence of exposure to discrimination is mostly qualitative in nature (e.g., [72] and [67]), and includes only a small number of self-reported measures, in the context of diary studies that last only a few weeks (e.g., [44]). These self-reported accounts are usually retrospective and therefore limited in their accuracy and comprehensiveness. Moreover, they lack details about changes at the behavioral level, which are sometimes subconscious and thus impossible to report. Knowledge about behavioral changes is critical in identifying mechanisms that explain the impact of discrimination encounters.
What is needed is comprehensive data that supports the empirical assessment of discrimination’s short-term impact.
To address this, we collect rich data about discrimination, specifically as represented by 454 unfair treatment events, due to a variety of individual factors such as gender and ancestry/national origin. These events come from 209 first year college students and took place over six months. More specifically, we continuously collect passively-sensed data from phones and behavior tracking wearable devices (Fitbit Flex 2) and combine this with frequent self-reports about unfair treatment and psychological and emotional state. Our contributions include:
We provide additional evidence for the conditions that can buffer or intensify the impact of unfair treatment by analyzing the associations between unfair treatment and indicators of mental health while accounting for risk and protective factors.
We quantify the short-term relationship between unfair treatment and behavior through the application of regression analysis to rich, passive behavior data, collected on the day of the unfair treatment report. Our approach allows us to estimate the expected magnitude of change in behavior.
We map the trajectory of behavioral correlates of the experience by analyzing short-term self-reported affect and behavior patterns on the day of unfair treatment and the following days. We demonstrate that most behavior changes resolve after one or two days.
We discuss implications of our work including (1) the need for interactional studies of discrimination that takes multiple stakeholders into account; (2) the importance of therapeutic interventions supporting individuals and social technologies that work to address discrimination in context; and (3) the need for tools that can better support computational social science of the sort presented in this paper.
This paper is structured as follows. In Section 2 we review what is known of the association between unfair treatment and well-being and justify the relevance of passive sensing as a way to study discrimination. We then identify the research questions we would like to address using passive sensing, both long-term (over the entire study) and short-term (immediately following each instance of unfair treatment) in Section 3. Next, we describe the data to address our research questions in Section 4 and Section 5. Section 6 lays out our approach to analyzing the data. Our goal in these three sections is to justify our choices in data collection and in operationalizing the variables of interest found in our literature survey. Further, we justify our analysis approach and explain how we handle issues such as outliers and feature selection using a hierarchical combination of machine learning and statistical modeling. This is followed by the findings in Section 7, broken down by research question, and emphasizing both confidence (significance) and magnitude of the results. Finally, we discuss the significance of our findings for future computational social science work, and for the creation of therapeutic as well as context-aware interventions, in Section 8.
2. BACKGROUND AND RELATED WORK
We describe a stress process model for the study of health outcomes associated with discrimination and review some of the evidence regarding the deleterious impact of unfair treatment on physical and mental health [73]. We establish the feasibility of our proposed approach for using passively-sensed phone and wearable data to study discrimination, by reviewing research on applications of mobile sensing in mental health. We also highlight that phone and wearable data can capture behavioral correlates of various psychological states related to discrimination.
2.1. Discrimination and Well-being
Discrimination, defined as differential treatment towards, or disparate impact on a person [45], is an uncontrollable and unpredictable stressor. Many researchers (e.g., [50]) have thus argued that its impact, in terms of the response it elicits and its consequences for physical and mental health, can be studied within the general framework of the stress process model. This framework describes a process model for the impact of stressors on psychological well-being and how social and personal resources shape the response. According to this framework, not only are some people more likely to experience discrimination (differential exposure), but also they may react to the experience more strongly (differential reactivity). Moreover, stressors often cascade and generate other stressors (stress proliferation [32]) that are part of a cumulative stress load [48]. Within this framework, we expect variability in different people’s responses based on the previous and current contexts of their life [44]. For example, risk and protective factors, such as other stressors and resources, can explain why similar experiences impact people differently (e.g., [68]).
Below, we describe the existing research on the impact of discrimination on physical and mental health within a stress process framework. We highlight the paucity of knowledge explaining the long term mental health disparities associated with discrimination, particularly in terms of short-term differences in behaviors.
2.1.1. Physical Well-being.
Acting as a stressor, discrimination triggers physiological stress responses (e.g., heightened blood pressure, heart rate, and cortisol secretions [6, 65, 69]) that can lead to serious conditions such as heart disease [11, 37]. Should it happen repeatedly, discrimination increases reactivity to stressful situations [23] (differential reactivity) and weakens body’s protective resources, thus increasing the risk of illness similar to other forms of cumulative stress [19] (stress proliferation). Additionally, discrimination is directly correlated with more unhealthy behavior (e.g., smoking, drinking, substance use) [31, 38].
2.1.2. Psychological Well-being.
The association between exposure to discrimination and mental health is supported by both empirical evidence [47] and large scale population studies [30]. Not only is discrimination directly associated with higher levels of depression, anxiety, and psychological distress in general, it is negatively correlated with identifiers of healthy psyche such as positive affect [60]. The magnitude of the associations is larger for negative health outcomes (e.g., depression) [60] and is comparable to major stressors such as sexual assault or combat experience [30]. Consistent with the stress process framework, there are differences in exposure and reactivity to discrimination [30]. Ong et al. [44] also provide evidence for stress proliferation, e.g., in that people who experience discrimination are more likely to report other daily stressors, both concurrently and subsequently. However, it is not yet clear what form the differential reactivity takes or what pathways lead to stress proliferation. More generally, what about exposure to discrimination leads to higher depression, anxiety, and distress in the long run? While studies such as [44] do show a relationship between daily experience of discrimination and health outcomes, they do not examine what short-term behaviors and affect are most directly associated with discrimination exposure and how these relate to larger disparities over time. The present work is specifically addressing this gap.
2.2. Passive Sensing of Mental and Physical Well-being
Because discrimination is associated with anxiety and depression, we turn to literature on the impacts of these conditions on behavior for evidence of behavior types likely to change in relation to discrimination. Our review of the literature identified five primary categories of behaviors, described below; also see [12] for a recent and comprehensive review of behavior signals indicative of psychopathology conditions and [21] for the argued applicability of phone and wearable data in the context of mental health.
2.2.1. Physical Activity.
Higher levels of physical activity are correlated with fewer symptoms of anxiety and depression [70] as well as lower levels of emotional distress [71]. Moreover, past work on mobile health sensing has successfully used features based on the inferred activity to predict depression in students [77] or relapse in schizophrenic patients [75]. We anticipate that exposure to discrimination leads to more depressed and anxious moods and it is thus negatively correlated with levels of activity. We expect that following a discrimination encounter people become more sedentary.
2.2.2. Phone Usage.
Distraction, an emotion-regulation strategy to reduce distress and negative feelings [64], can manifest itself in the from of excessive or purposeless phone use. In fact, phone overuse is linked to depression and anxiety in college students [13]. Additionally, patterns of phone use, particularly in relation to location of use, have been previously used as depression symptoms [77]. We therefore expect that exposure to discrimination is positively correlated with higher levels of phone use as people try lowering their distress through distraction.
2.2.3. Social Interactions.
Social support and interaction are key to psychological health and well-being [29]. Unsurprisingly, mental health problems, such as depression, are inversely related to quality and quantity of social interactions [43]. Moreover, social support seeking is a common strategy people use to cope with distress [8]. Operationalized in the form of phone calls, social interactions have been used as indicators of mental health [75]. Discriminatory encounters can initially lead to increased calls as people seek support. However, when the depressive symptoms (e.g., withdrawal [20]) increase, social participation might drop. Records of phone calls can provide signals to this effect.
2.2.4. Mobility.
Mental health conditions, such as depression or anxiety, that are characterized by avoidance behaviors, can potentially impact mobility patterns. There is evidence connecting people’s mobility to the severity of depressive symptoms [58, 59] and anxiety [25]. We anticipate that following discrimination experiences, people’s mobility patterns may change, as their behavior is impacted by higher levels of depression and anxiety.
2.2.5. Sleep.
There is significant comorbidity between sleep problems and a number of mental health complications including depression [74], anxiety [40], and malconduct [46]. Sleep detection using wearable and phone sensors has been a topic of mobile health research [39]. In relation to mobile sensing of mental health, Wang et al. [76, 77] have used measures of sleep to model academic performance and levels of depression in college students. We expect sleep disruption to follow discrimination encounters.
To summarize, the behaviors that we might expect based on the literature include reduced physical activity, increased phone screen time, reduced phone calls, reduced mobility, and increased sleep disruptions. However, the distance between passively-sensed behaviors and psychological conditions reported in studies of discrimination cited above is large. Our work will help to answer the question of whether the predicted differences are visible in long-term and/or short-term behaviors.
3. RESEARCH QUESTIONS
Passive sensing through mobile phones and behavior tracking wearable devices is a promising approach to capturing behaviors that are indicative of mental states. This approach would allow us to investigate the understudied topic of short-term behavior changes associated with discrimination. Without reporting specifics, the little existing work suggests psychological distress shortly follows discrimination. We anticipate detecting meaningful changes in behavior associated with such distress. Our focus in this work is thus on understanding and quantifying such changes based on objective unobtrusive measures of phone and wearable data to document, for the first time, what behaviors change and in what ways after discrimination events (i.e., short-term relations). We also examine and possibly reproduce earlier reports regarding long-term relations between discrimination experiences and mental health. Figure 1 depicts our application of the stress process model to the study of discrimination in both short- and long-term. In the present work, we are specifically focusing on the dashed links marked with the research questions below.
Fig. 1.

Stress process model of the short- and long-term impact of discrimination. The links with research questions next to them are specifically examined in the present work. Thick blue arrows have been studied in the past. We are reproducing the ones with double lines. Dashed arrows have not been fully examined to the best of our knowledge, particularly in relation to behavior markers. We examine a subset of these, labeled by the relevant research question. When a moderating impact is applicable to multiple arrows, we have enclosed the arrows in a gray box to minimize clutter.
In terms of long-term differences we specifically ask:
RQ1 What are the differences in mental health (e.g., anxiety, depression, or loneliness) between people who experience discrimination and people who do not, accounting for contributions of cumulative discrimination and resources?
RQ2 Do these differences also exist at the level of global behavior patterns (i.e., behaviors aggregated for the duration of the study)?
Answers to these questions would allow us to establish differences in mental health based on cumulative discriminatory experiences. The duration of our study is likely too short for substantial changes in health, due to the events happening during the study, to fully develop. Nonetheless, we expect to observe differences, because it is likely that people who report being unfairly treated in our study have had other experiences in the past that have adversely changed their mental health status with identifiable behavior signals.
Turning to short-term impact, our questions are:
RQ3 What are the differences in self-reported daily affect in the presence and absence of reports of discrimination?
RQ4 Are there differences at the level of local behavior patterns (i.e., passively sensed behaviors on the day of or days just after an event) as a function of discrimination exposure?
Responses to RQ3 and RQ4 would provide much needed insights into psychological and behavioral changes that follow unfair treatment, which would justify the need for a future study of the mediating impact of short-term distress on long-term mental health and other outcomes.
For each observed relationship, we consider several important aspects. First, it is important to know whether we have confidence in the observations. This can be expressed in terms of p-values while accounting for multiple comparisons. Second, it is important to quantify the magnitude of the relationship. This can be expressed in terms of effect sizes or model parameters (e.g., regression coefficients). Finally, it is important to quantify the length of time over which the impact is visible (short-term analysis only). This can be captured by looking at the decay in confidence over time.
4. STUDY DESIGN
The data analyzed in this paper comes from a study designed to explore a broad range of topics relevant to the student experience. The guiding principle in the design of our study in terms of measurements and collection procedure was to obtain a rich representation of our participants’ well-being as well as their behaviors and context. Our approach was inspired by Wang et al. [76]’s successful collection of student data (which used a similar protocol but did not include unfair treatment). We focused our data collection on first-year students in a large public university, as it allowed us to study students’ experience in a challenging and critical period of life. The first year of college can significantly influence where students end up in their career and adult life. It is also a time of substantial change from adolescence to adulthood, when many students face new challenges they may not know how to cope with. Understanding the prevalence and impact of unfair treatment experiences in this context provides much needed information for designing policy and support for students when they most need it and would benefit from it.
We used a single question, asked twice-weekly (daily on four separate weeks) to measure unfair treatment: “Did you experience unfair treatment for any of the following reasons?” This was followed by a list of possible reasons for unfair treatment ranging from ancestry / national origin, intelligence, and gender (the three most common) to religion, learning, and disability (the three least common, see Figure 4).
Fig. 4.

Breakdown of 448 reports of unfair treatment by type. National, Orientation, and Learning refer to ancestry or national origin, sexual orientation, and learning disability respectively. See Table 3 for details of all categories. Participants were able to report multiple incidents of unfair treatment, possibly of different types, in each report.
Below, we provide further details and rationale for who we recruited, what data we collected, and how we collected it. Our study was approved by our institution’s Institutional Review Board.
4.1. Participants
We advertised our study through flyers, which were distributed across campus at locations frequently visited by students, over student mailing-lists, and in student groups on social media. Our call for participation invited first-year full-time students, 18 years and older, who owned an iOS or Android smartphone and were available for the entire duration of the study (Jan-Jun 2018). We were particularly interested in sampling from among women in STEM, where gender discrimination is an ongoing problem [26]. We thus did snowball sampling for students enrolled in engineering majors. We worked to oversample women, minorities, and first-generation students.
We recruited 209 participants, of whom 176 stayed in the study through the end (84% retention rate). Table 1 provides further information about our sample at the beginning and end of the study. The age range of participants in the final sample was 18 - 23 years (M = 18.4, SD = 0.69).
Table 1.
Sample breakdown in terms of gender and minority status. Percentages are calculated out of 209 (the total number who began the study). Categories are non-independent, which is why the columns do not sum to 209. Of the 33 who dropped out, 13 did so before the break between quarters, and 20 before post questionnaire.
| Completed Study | Dropped Out | |||
|---|---|---|---|---|
| All (N=176) | Engineers (N=73) | All (N=33) | Engineers (N=11) | |
| Women | 114 (54%) | 41 (20%) | 19 (9%) | 7 (3%) |
| Under-Represented Minorities | 18 (9%) | 15 (7%) | 10 (5%) | 5 (2%) |
| First Generation Students | 51 (24%) | 27 (13%) | 11 (5%) | 7 (3%) |
4.2. Procedure
After an initial screening questionnaire, participants attended an information session, where we went over the consent form and compensation structure, installed phone data collection software on participants’ phones and gave them Fitbit Flex 2 devices for passive sensing. We also asked the participants to complete a demographic survey (Table 2).
Table 2.
Demographics information most relevant to the present work. Statistics in the table are calculated from the 209 participants who started the study.
| Demographics | |||||||
|---|---|---|---|---|---|---|---|
| Age | M= 18.4 SD= 0.69 | URM | 12% | Disability | 1% | College | 40% Engineering |
| Gender | 64% Female | Language | 75% English | Sexual orientation | 88% Straight | ||
Participants were asked to answer hour-long questionnaires about their life experiences, self regulation and coping skills, health behaviors, and personality, three times during the study: pre, or before the start of the Winter quarter; mid, or between Winter and Spring quarter; and post, or after their last final of Spring quarter (see Section 4.3 for details). The timing of the pre survey overlapped the start of Winter quarter for some participants. In addition, participants were asked to report twice weekly on their affect, stress, and experiences of unfair treatment, among other things, in response to Ecological Momentary Assessment (EMA) surveys (details in Section 4.3). Participants were given approximately a ten-hour window to complete these surveys. During two weeks of each quarter, we sent the EMA surveys four times a day to get more detailed information. Building up on earlier work, we chose sampling timing and frequency for EMAs to minimize participant burden while obtaining representative data. For example, Wang et al. [76] collect multiple responses a day, while Wang et al. [77] collect responses once a week. We incorporated both approaches, slightly increasing frequency (twice weekly rather than once a week) when not asking on a daily basis. This allowed us to obtain responses both on week days and weekends, as behaviors on week days and weekends are measurably different (e.g., Saeb et al. [58]). We scheduled daily EMA surveys a week before exam periods to get more detailed data when academic demands are the highest. We used Qualtrics1 to administer all questionnaires and surveys.
During the study we continuously monitored participants’ compliance in responding to EMA surveys and their sensor data availability. We followed up with participants when necessary to address the issues that might prevent them from receiving surveys or collecting their sensor data.
We compensated participants for completing pre, mid, and post questionnaires as well as the EMA survey responses. They could earn up to US$245 depending on the number of the surveys they responded to. If their sensor data was available for more than 90% of the study duration they could also keep their Fitbit device.
Below we provide more depth on the subset of this data used in this paper. Our analysis focuses on variables drawn from the demographic survey, pre and post questionnaires, and EMAs along with passively-sensed data.
4.3. Surveys and Questionnaires
Our analysis of the longer questionnaires focuses on specific items from the pre and post questionnaires only. The questionnaire items relevant to this article are summarized in Table 3. In addition to outcome measures previously reported in literature (e.g., depression or anxiety), we included a wide range of items such as health, social experiences, and coping resources. We anticipated these factors would be related to both reports of and reactions to unfair treatment and included them as resource factors in our analysis. According to the stress process model of discrimination, not only are certain groups more likely to face unfair treatment, but also they are also more likely to react to discriminatory situations (see Section 3 for the theoretical model that informed our decisions).
Table 3.
Measures in pre or post questionnaires and EMA surveys relevant to our discrimination analysis. The health status or social perception that the acronym measures is given in parentheses.
| Measure | Administration | Scales / Items Included in the Measure | |
|---|---|---|---|
| Pre or Post | Social Experiences or Perceptions | pre, post | UCLA Loneliness* [57] (loneliness), 2-way SSS [63] (social support) |
| Stress & Coping | pre, post | MAAS [7] (mindfulness), ERQ [22] (emotion regulation), PSS* [10] (perceived stress), BRS [66] (resilience) | |
| Physical & Mental Health | pre, post | CHIPS [9] (physical health), CES-D* (depression) [55], STAI* (anxiety) [27] | |
| EMA | Affect* | daily, weekly | Feeling Anxious, depressed, frustrated, overwhelmed, lonely, happy, and connected on the scale of 1 (not at all) to 5 (extremely) |
| Unfair Treatment† | daily, weekly | Unfairly treated because of ancestry or national origin, gender, sexual orientation, intelligence, major, learning disability, education or income level, age, religion, physical disability, height, weight or other aspect of one’s physical appearance; the question also included the option “I was not treated unfairly.” |
Scales representing mental health are bold-faced and starred.
Predictor measures are italicized and marked with a cross.
Other scales are considered as risk / protective factors (i.e., resources) in our analysis.
As shown in Table 3, participants also responded to Ecological Momentary Assessment (EMA) surveys that were administered either twice weekly or daily (Section 4.2). Twice-weekly EMAs asked about experiences of unfair treatment the day before (i.e., yesterday), whereas daily EMAs asked about same-day events. More concretely, the unfair treatment question we asked in the twice weekly surveys was “Did you experience unfair treatment for any of the following reasons yesterday?” In the daily surveys, we asked “Did you experience unfair treatment for any of the following reasons today?” The explicit wording (i.e., ‘yesterday’ or ‘today’) allows us to identify the exact date of the discrimination experience so that we can properly align self-reported and passively-sensed data. Participants could mark any applicable reason or indicate they were not unfairly treated. They could also leave the question blank. We only consider explicit positive (i.e., marked at least one reason in response to the question) or negative (i.e., marked “I was not treated unfairly”) responses to the unfair treatment question in our analysis.
All but one of 209 participants completed the pre questionnaire. 196 (94%) and 176 (84%) also completed mid and post questionnaires respectively. The overall compliance rate for EMA surveys was 85%. Figure 2 illustrates the average compliance rate across all weeks of the study. It also depicts the timing of pre, mid, and post questionnaires and EMA surveys as well as important dates according to the student calendar.
Fig. 2.

Timeline and completion rate of pre, mid, and post questionnaires as well as EMA surveys. Y axis shows the completion rates and is narrowed to the range 50-100%. The completion rate of pre, mid, and post questionnaires are percentages of the original pool of 209 participants, whereas EMA completion rates are based on the 176 participants who completed the study. EMA completion rates are computed as the average completion rate of the surveys administered in a certain week of the study. School-related events (i.e., start and end of quarters as well as exam periods) are marked. Dark blue bars (Daily Survey) show the weeks when participants answered surveys every day, four times a day.
4.4. Passively Sensed Data
We equipped participants’ phones with the AWARE framework app [16], to passively collect data from their smartphones. This enabled us to record location, phone screen status, and call logs for incoming, outgoing and missed calls. We also used a plugin for AWARE to collect activity information (e.g., walking, running, or still) inferred by the phone. AWARE ran in the background on participants’ phones and automatically transferred data to our server over WiFi on a regular basis. Further, we gave each participant a Fitbit Flex 2, which records the number of steps and sleep status (e.g., asleep or awake). We chose the Fitbit Flex 2 because it provided important data (sleep and steps) at a reasonable cost with acceptable reliability. Table 4 summarizes the passively sensed data we collected, specific sensors we used, which device provided the data, sampling rate, and information collected. Existing literature on mobile sensing of indicators of mental health (Section 2.2) informed our choice of sensors(Figure 5).
Table 4.
Passively sensed data collected and used in our analysis.
| Relevant Behavior | Sensor | Source | Sampling | Information Collected |
|---|---|---|---|---|
| Physcial Activity | Step | Fitbit | 1 sample per min | number of steps |
| Activity | AWARE | 1 sample per 5 min | type of activity: walking, running, on bicycle, in vehicle, still, unknown | |
| Phone Usage | Screen | event-based | screen status (locked, unlocked, off, and on) events | |
| Social Interactions | Call | time and duration of incoming, outgoing, and missed calls | ||
| Mobility | Location | 1 sample per 10 min | GPS latitude, longitude, altitude | |
| Activity | 1 sample per 5 min | variety of activities | ||
| Sleep | Sleep | Fitbit | 1 sample per min | duration and onset of sleep, minutes to fall sleep, of awake, and after wakeup |
Fig. 5.
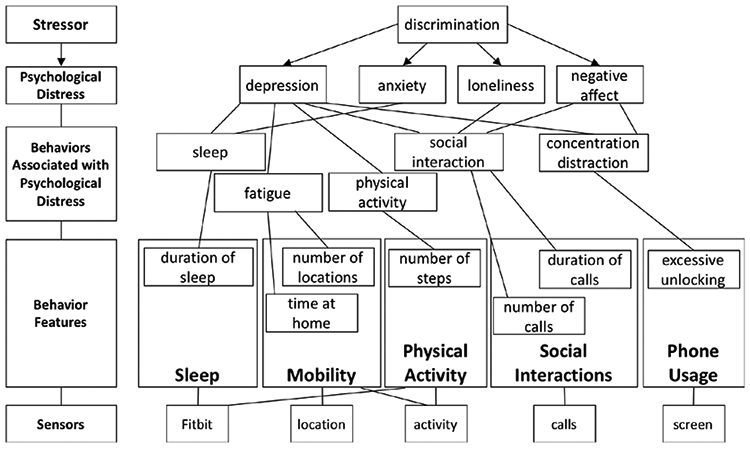
Based on the stress process model in Figure 1, discrimination, as a daily or chronic stressor (top level), is associated with psychological distress, e.g., depression or anxiety (level 2). These psychological conditions have a variety of behavioral manifestations (level 3) that are linked to behavior features in categories defined in Section 2.2 (level 4) and derived from passively sensed data (level 5).
We started data collection three weeks into the study because of some technical difficulties. We continued data collection until the final compensation session although some participants continued uploading data even after they exited the study. Figure 3 illustrates availability of different sensor data for the duration of our study; the brighter the cell for a sensor, the larger the number of people who uploaded data for that sensor on that date.
Fig. 3.

Sensor data availability for each day of the study in terms of the number of participants whose data is available on a given day. Weeks of the study are marked on the horizontal axis while different sensors appear on the vertical axis. Important calendar dates (e.g., start / end of the quarter and exam periods) are highlighted as are the weeks of daily surveys. The brighter the cells for a sensor the larger the number of people contributing data for that sensor. Event-based sensors (e.g., calls) are not as bright as sensors continuously sampled (e.g., location) as expected. There was a technical issue in the data collection application in the middle of study, visible as a dark vertical line around the beginning of April.
5. DATASET
In this preliminary study of the association between discrimination and behaviors, we consider all types of unfair treatment under one category of experiencing discrimination, which is used to drive two measures: exposure (any report of unfair treatment qualifies; if a participant reported they were not unfairly treated in their EMA responses their exposure would be zero) and severity (ratio of total reports to total available responses, i.e., number of times the question was answered over the course of the study; severity is zero for people who always reported they were not unfairly treated). This allows us to address concerns regarding the validity of the measurement and practicality of the analysis. First, our measure of discrimination was not a validated measure, e.g., it did not explicitly include race as a source of unfair treatment. Thus, it may not adequately differentiate between types of discrimination, and it may not have captured all examples of discrimination (a limitation we plan to address in future iterations of the study). For this reason, we refer to it as unfair treatment throughout this paper, drawing the connection to discrimination as appropriate where our results match what the literature would predict, and in the discussion. Second, there are relatively few incidents for some categories, which complicates their individual analysis.
Four hundred fifty-four distinct incidents of unfair treatment during our study, of which 448 belong to participants whose sensor data is available for analysis. Figure 4 shows the prevalence and breakdown of the reports of unfair treatment by category. As summarized in Table 5, unfair treatment is more prevalent amongst women than men; 73% of all reports of unfair treatment come from women. Unfair treatment is equally prevalent in both engineering and non-engineering majors for all genders.
Table 5.
Breakdown of unfair treatment reports across genders and majors. The percentages are calculated based on 448 incidents of unfair treatment.
| # reports | χ2 | p-value | |
|---|---|---|---|
| Female | 326 (73%) | 8.98 (df=1) | 0.003 |
| Male | 122 (27%) | ||
| Engineering | 201 (45%) | 3.67 (df=1) | 0.055 |
| Non-engineering | 247 (55%) |
Prior work on bias and discrimination has identified mental health conditions associated with discrimination, such as depression, anxiety, negative affect, psychological distress, and social withdrawal. We thus include both long-term and short-term measures of these indicators of mental health in relation to discriminatory encounters in creating the dataset for our analysis:
long-term indicators of mental health (from post questionnaire): depression (CES-D [55]), anxiety (STAI [27]), stress (PSS [10]), and loneliness (UCLA Loneliness [57]).
short-term indicators of psychological distress (from EMA surveys): momentary affect (anxious, depressed, frustrated, overwhelmed, lonely, happy, connected).
Should there be short-term behavioral correlates of unfair treatment, they are likely linked to the psychological conditions associated with discrimination. We thus include behavior features that are reported to correlate with any of the mental health and affect measures noted above. In what follows, we first describe steps we took, preparing the data we collected (see Section 4 for information on the data being collected). We then detail the behavior features and how we operationalized them in our work. Figure 5 summarizes the rationale informing our choice of outcome measures as well as behavior features. It also depicts the sensors relevant to each feature.
5.1. Data Preparation
We include all survey and sensor data available in our analysis. We calculate features daily (12am-12am) as well as for four different epochs of the day (following the method in [76]): night (12am-6am), morning (6am-12pm), afternoon (12pm-6pm), and evening (6pm-12am) (Section 5.2). The only exceptions are steps and sleep, for which we only calculate daily values, because Fitbit provides aggregate information only. Moreover, Fitbit devices drop detailed per minute step information, keeping only daily aggregate values, if they are not regularly synced with the phone. Unfortunately, irregular sync was a common issue in our data and prevented us from reliably calculating step counts for epochs. We calculate simple statistics (i.e., mean) of values in different epochs as a global representation of the features, when relevant. We use this global representation for our long-term analysis (Section 6.6).
5.2. Behavior Features
We calculated features capturing aspects of participants’ behavior from passively-sensed data, as summarized in Table 6. We used the AWARE feature extraction library originally developed by [14] for feature calculations, as described below.
Table 6.
Sensor features. Daily averages within the duration of the study are considered as global features for the starred (*) items.
| Relevant Behavior | Features | Sensor |
|---|---|---|
| Physical Activity | most common activity; number of steps* | Activity Steps |
| Phone Usage | length* and its min, max, mean, and standard deviation of interactions or unlocks; first time turned on/locked each day; last on/locked/unlocked each day; | Screen |
| Social Inateractions | number of incoming/outgoing/missed calls*; duration of incoming/outgoing calls* | Call |
| Mobility | number of changes in activities*; number of activities*; location variance*; radius of gyration*; total distance traveled* and its descriptive statistics (min, max, mean, standard deviation); location entropy*; number of distinct locations visited; circadian movement*; number of transitions between different locations*; percentage of time in motion*; length* of stay in different locations and its descriptive statistics (min, max, mean, standard deviation); time* spent at top three most visited locations; time* spent at rare locations | Activity Location |
| Sleep | total time in bed*; total time asleep*; number of sleep periods; minutes to fall asleep/awake/asleep* and onset of the main sleep and other sleeps in aggregate | Sleep |
Physical Activity.
We operationalize physical activity in terms of daily number of steps, collected by the Fitbit. We also consider type of activity. Activity recognition algorithms on both Android and iOS platforms infer types of activity (walking, running, on bicycle, in vehicle, and still) with reasonable accuracy. We additionally operationalize the level of physical activity in an epoch (e.g., daily, or morning) in terms of the most common activity in that time period.
Phone Usage.
We represent phone usage based on duration. We use duration and its aggregate information (i.e., min, max, mean, and standard deviation) for interaction and unlock periods, defined based on [3]. Interaction is the period between screen status going from unlocked to off or locked, whereas unlock period is the period of status change from unlocked to locked. We additionally include the timing of the first and last screen on and unlocked as well as the last locked events.
Social Interactions.
We use the number of incoming, outgoing, and missed calls, as well as the duration of incoming and outgoing calls, to capture social interaction behaviors.
Mobility.
We operationalize mobility (or lack of it) as follows: variability in location latitude and longitude (i.e., location variance), extent of the area being traveled (i.e., radius of gyration), total distance traveled and its descriptive statistics (min, max, mean, and standard deviation), variability in time spent in locations visited (i.e., location entropy), number of distinct locations visited, regularity in locations visited (i.e., circadian movement), number of transitions between different locations, percentage of time in motion, length of stay in different locations and its descriptive statistics (min, max, mean, and standard deviation), time spent at top three most visited locations, and time spent at rare locations. We also consider the number of different activities and number of changes in the type of activity, where higher values are related to a more varied use of time (e.g., riding a bus, then walking, then sitting).
Sleep.
We use daily duration and counts of sleep and time spent in bed as well as duration in-bed, awake, or asleep, and the time of sleep onset for the main sleep period, and other sleep periods in aggregate.
6. ANALYSIS
We analyze both long-term and short-term relationships between unfair treatment and psychological health. The data we use in our analysis can be considered in three main categories that are separately operationalized for long-term and short-term analysis:
Measures of unfair treatment hypothesized to predict differences in mental health and behavior.
Indicators of psychological state as well as behaviors related to those states, as outcome variables, hypothesized to be associated with the predictor variables.
Resource metrics hypothesized to moderate the relation between predictors and mental health in the long run. In other words, these can reduce or eliminate the relationship between unfair treatment and mental health.
Our basic approach to long-term analysis (RQ1 and RQ2) leverages linear regression [24]. Specifically, we model the relationship between exposure to/severity of unfair treatment and outcomes. We use hierarchical linear modeling (HLM) for short-term analysis (RQ3 and RQ4). HLM is an extension of linear regression in which units (e.g., individuals, schools, communities) are correlated and share common features. For our analysis, we use a two-level model in which individual participants, who were repeatedly sampled over time, are clustered within themselves. HLM allows for flexibility in how change over time is modeled such that these models can fit discontinuous and non-linear changes. Additionally, HLM models do not require that individuals report the same number of observations over time and thus can handle an unequal number of observations per person and uneven spacing between observations [35].
Because of the complexity of the study, there are important challenges to address in the analysis:
Selecting variables, e.g., from over 400 behavior features generated from our data
Dealing with the potential for overfitting and/or type I errors (false positives)
Applying statistical methods to capture change in reaction over time
Considering the inter-related nature of the variables and the sheer number of them, we have to be careful not to overfit. Thus, much of our analysis methodology deals with strategies for reducing the number of regression models we create and the variables we include in those models. These methods were developed with the help of statistics experts and all choices are driven by a combination of statistical analysis and hypotheses generated from the literature. Because of the exploratory nature of our analysis, and the many variables that we have, we often perform multiple comparisons. We have used the Benjamini-Hochberg procedure [5] to account for multiple testing for each group of tests by correcting p-values to limit false discoveries.
In the following sections we provide further details on operationalization of variables for long- and short-term analysis and our multi-step process for model construction in each case.
6.1. Operationalization of Variables for Long-term Analysis
Unfair treatment (RQ1 and RQ2).
Presence/absence of a report of unfair treatment (exposure) and proportion of such reports (severity) over the duration of the study.
Mental and psychological health (RQ1).
Scores from CES-D [55] for depression, STAI [27] for anxiety, PSS [10] for stress, and UCLA Loneliness [57] for loneliness.
Behaviors (RQ2).
Features aggregated over the entire duration of the study and drawn from six sensors in five different categories that the literature suggests are relevant to mental health measures considered here (Table 6).
Resources (RQ1).
Scores on 2-way SSS [63] for social support, MAAS [7] for mindfulness, ERQ [22] for emotion-regulation, BRS [66] for resilience, and CHIPS [9] for physical health.
6.2. Operationalization of Variables for Short-term Analysis
Unfair treatment (RQ3 and RQ4).
Exposure to discrimination on a particular date is used to label all associated data with respect to the timing of unfair treatment events; the question we asked about unfair treatment had an explicit timeframe that allows us to exactly identify day 0 (day of the event). Thus, we can consider self-reported or passively-sensed measures on day 0 across all reports of unfair treatment, do the same for day 1, day 2, and so on. We can likewise consider self-reports and sensor values for all dates for which no unfair treatment was reported as day 0 for a non-unfair treatment event, and do so similarly for day 1, day 2, and so on. We can then check for significant differences when participants report unfair treatment and when they do not on day 0, day 1, and so on. We note that some of the unfair treatment our participants faced might have occurred on days our survey did not specifically ask about, due to the frequency of the surveys (twice weekly). Thus, while we can accurately identify day 0 for all reported unfair treatment, we cannot be sure that a second incident of unfair treatment did not occur on day 1, 2, and so on. Should this happen frequently, it is possible it might increase the size or length of the impact of unfair treatment.
Mental and psychological health (RQ3).
Ratings from a simple question on momentary affect including anxiety, depression, frustration, feeling overwhelmed, loneliness, happiness, and feeling connected (Table 3).
Behaviors (RQ4).
Behaviors are operationalized as features calculated using the passively sensed data. We group the features into the five categories that the literature suggests, described in Section 5.2. Each category contains multiple measures calculated daily, and for epochs of the day (e.g., morning or night) as explained in Section 5.
6.3. Removing redundancy in Pre and Post Scores
Measures of mental health, social experiences and coping resources were all administered in both pre and post questionnaires. We do not expect experiences of unfair treatment to only happen during the study. Moreover, given the duration of the study, we would not expect discrimination that occurs only during the study to impact long-term mental health. Thus, we do not expect mental health scores to change significantly from pre to post. We verify the hypothesis that the difference in scores on relevant scales from pre to post is unimportant, using a repeated measure ANOVA analysis, comparing pre and post scores for depression, anxiety, stress, and loneliness. The differences are all small or negligible based on Cohen’s d measure of effect size (Figure 6). The same is true for scores of social support, mindfulness, emotion regulation, resilience, and health. For this reason, we only use post scores of each measure in our analysis. In addition, we do not control for depression, anxiety, stress, or loneliness scores at the beginning of the study (i.e., pre scores) in our models. Given that the difference between the pre and post scores is negligible, using pre scores in regression models for the post scores would explain most of the variation. This is justified since using pre scores is almost equivalent to using the post scores themselves as predictors in the model.
Fig. 6.

Pre and post scores of mental health indicators. The scores obtained at the beginning vs. the end of the study have differences with small to negligible effect sizes as measured with Cohen’s d.
6.4. Selecting Resources
Resource selection is done for the analysis of long-term measures of mental health (RQ1), and is based on how well the resources explain the variations in these measures. The goal is to focus on resources that have a strong overall relationship with mental health. We use linear regression to determine this. Table 7 shows those factors that are significantly related to each measure of mental health. Resilience is significantly related to all measures of mental health. Social support, mindfulness, and physical health explain variations in most of the measures.
Table 7.
List of resource factors obtained from post questionnaire that are significantly related to post measures of mental health. These factors can moderate the strength of the relationship between unfair treatment and mental health.
| Measure of Mental Health | Resources in Dealing with Unfair treatment |
|---|---|
| Depression (CES-D) | Social support (2-way SSS), mindfulness (MAAS), resilience (BRS), health (CHIPS) |
| Anxiety (STAI) | Social support (2-way SSS), mindfulness (MAAS), resilience (BRS), health (CHIPS) |
| Stress (PSS) | Resilience (BRS), health (CHIPS) |
| Loneliness (UCLA Loneliness) | Social support (2-way SSS), mindfulness (MAAS), resilience (BRS) |
6.5. Selecting Behavior Features
The behavior features considered as outcomes must be reduced to avoid an excessive number of comparisons that increase the chance of type I error. Our approach to selecting long-term features is to use coefficients of ridge linear regression models to order and select features, stratified over sensors so that each sensor is represented by one feature. We consider the mental health variables instead of unfair treatment in these ridge linear regression models to avoid overfitting to our final predictor variable (i.e., unfair treatment). This allows us to identify a subset of behavior metrics that can explain variations in measures of mental health. Since there are multiple measures of mental health, we use separate models for each measure, add together the absolute values of coefficients from these models and pick the behavior metric with the largest coefficient per sensor. Also, we normalize feature values to have zero mean and unit variance to ensure coefficients can be compared across features. The selected long-term behavior features are listed in Table 8.
Table 8.
Global behavior metrics associated with mental health (i.e, depression, anxiety, stress, and loneliness). These metrics have the largest combined coefficients in ridge linear regression models in relation to measures of mental health (details in Section 6.5).
| Global Behaviors Related to Mental Health | |
|---|---|
| Physical Activity | Number of daily steps |
| Phone Use | Number of minutes phone is unlocked (night) |
| Social Interactions | Number of outgoing calls (night) |
| Mobility | Number of activities (night) Time spent in the second most visited location (morning) |
| Sleep | Minutes in bed (main sleep) |
We use a related approach for selecting short-term behavior features, that is less sensitive to missing values. Instead of using regression, we calculate pair-wise correlations between all behavior metrics and all affect ratings, and sum the absolute values of the significant correlation coefficients as a measure of the overall importance of a behavior metric. We consider the top five metrics (when available) for each sensor for further analysis, which leads to between 10 and 1 features per category of behavior as defined in Section 5.2 (Table 9).
Table 9.
Daily behavior metrics associated with affect ratings (i.e., ratings of momentary anxiety, depression, frustration, feeling overwhelmed, loneliness, happiness, feeling connected). These are grouped by categories of behaviors literature suggested as relevant to psychological distress. These metric are considered as outcomes in relation to unfair treatment.
| Daily Behaviors Related to Affect Ratings | ||
|---|---|---|
| Mobility | Social Interactions | Sleep |
| Number of changes in activity | Number of calls | Minutes sleep |
| Number of changes in activity (afternoon) | Number of calls (evening) | Minutes sleep (main sleep) |
| Number of activities | Number of incoming calls (evening) | Minutes in bed |
| Number of activities (afternoon) | Number of outgoing calls (evening) | Minutes in bed (main sleep) |
| Number of activities (evening) | Number of missed calls | Sleep duration (main sleep) |
| Percentage of time in motion | Phone Usage | Physical Activity |
| Percentage of time in motion (afternoon) | Number of unlocks per minute (night) | Number of steps |
| Circadian movement | Number of minutes interacting with phone | |
| Circadian movement (afternoon) | Number of interactions with phone (morning) | |
| Percentage of time at home (night) | Number of interactions with phone (afternoon) | |
| Number of interactions with phone (afternoon) | ||
6.6. Models of Long-term Relations
The final analysis addressing RQ1 is performed using linear regression models for pairs of an unfair treatment variable as a predictor (exposure or severity), and a mental health measure as an outcome (depression, anxiety, stress, loneliness). That is, we have a total of 2 predictors × 4 outcomes = 8 models. We additionally include interaction terms with resource variables selected for each measure of mental health, leading to 16 total models.
With respect to RQ2, we build separate linear regression models for each unfair treatment variable (as predictor, i.e., exposure and severity) and the global behavior metrics selected above (as outcomes) (Table 8). This resulted in 12 models (two predictors by six outcome variables).
Given the sensitivity of linear regression to extreme value,s we remove outliers from the analysis pertaining to RQ1 and RQ2. We remove samples that fall outside three standard deviations of the mean number of instances of unfair treatment (counting only people with one or more instances of such treatments in calculating the mean). The rationale is that other factors might confound perceptions of individuals reporting unfair treatment at such high rates.
6.7. Models of Short-term Relations
We create HLMs with unfair treatment exposure as the predictor with affect ratings as outcomes (7 models in total, see Table 3 under Affect). We also model the relationship of unfair treatment exposure and passively-sensed metrics of behavior as outcomes (26 models in total, see Table 9). These models, respectively, address RQ3 and RQ4. All models also include time as both a fixed and a random effect, as this type of data changes substantially over the course of the study. All 33 models are calculated on each day from day 0 to day 6 of the unfair treatment incident. As a reminder, the multiple comparisons are addressed in our assessment of significance using the Benjamini-Hochberg procedure. For the most part, our results section does not mention results that were not significant (unless highly relevant to the point being made).
6.8. Implementation
We use lm (from stats package [54]) and lme (from nlme package [52]) in R [54] for linear regression and hierarchical linear regression modeling respectively.
7. RESULTS
Our results indicate both short-term and long-term associations between experiences of unfair treatment and psychological distress. We also observe short-term differences in behaviors, in relation to reports of unfair treatment. We detail our findings in the following subsections, organized according to the research questions in Section 3.
7.1. RQ1: Is Unfair Treatment Associated with Differences in Mental Health?
In response to RQ1, we examine whether we can reproduce some of the existing knowledge on the relationship between unfair treatment and mental health. As shown in Table 10, the severity of unfair treatment is significantly linked to all four measures. Exposure is also linked, but less consistently and with lower significance. More specifically, recall our interest in confidence and magnitude. With respect to confidence, the results are significant. With respect to magnitude, the regression coefficients (b) are small for exposure, but are much larger for severity vs. exposure to unfair treatment for each measure. We can further quantify this in terms of predicted impact on mental health scores. For example, our results suggest an increased depression score of ~3 and ~37 for a unit of increase in exposure and severity, respectively. This translates to going from ‘no to mild depressive symptomatology’ to ‘severe depressive symptomatology’ if repeatedly exposed to unfair treatment. This is aligned with the existing reports that repeated experiences of unfair treatment lead to a larger decline in mental health status (e.g., [44, 47]).
Table 10.
Relationships between indicators of mental health and measures of unfair treatment, based on regression models, with mental health indicators as outcomes whose variations are explained by measures of unfair treatment as predictors. The regression coefficient estimates (b), their standard error (SE), and p-value are reported. The larger the regression coefficients (b) for each measure, the stronger the relationship. Therefore, relationships with unfair treatment severity are much stronger than unfair treatment exposure.
| Mental Health Indicator | Unfair treatment | b | SE | p-value |
|---|---|---|---|---|
| CES-D depression | exposure | 3.17 | 1.52 | 0.038 |
| severity | 31.93 | 12.51 | 0.012 | |
| STAI anxiety | exposure | 3.44 | 1.79 | 0.057 |
| severity | 37.52 | 14.80 | 0.012 | |
| PSS stress | exposure | 1.04 | 0.95 | 0.277 |
| severity | 15.63 | 7.84 | 0.048 | |
| UCLA loneliness | exposure | 3.49 | 1.6 | 0.033 |
| severity | 37.15 | 13.34 | 0.006 |
We do not find any significant main effect of exposure or severity of unfair treatment on scores of depression, anxiety, stress, or loneliness in models that additionally include resource factors (i.e., social support, mindfulness, resilience, or health). The shared variance with these other predictors limits the unique contribution of unfair treatment. That is, these factors explain much of the variation in mental health (Table 11 summarizes the results; Table 7 lists the resources considered). For example, people with low scores on resilience and mindfulness, who experience health issues, are more depressed, independent of whether or not they have experienced unfair treatment, or how severe their experience has been. This is consistent with other research on the relationship between these factors and depressive symptoms (e.g., [33]). Given people’s experiences of unfair treatment may not be limited to our study, there is a possibility that unfair treatment is related to resource depletion, as suggested by the association between exposure to unfair treatment and health (people exposed to unfair treatment are less healthy; b = 0.01, p-value=0.015). This matches the reports that diminished physical health is often an early sign of stress effects (e.g., [47]).
Table 11.
Significant relationships between measures of mental health as outcomes, and unfair treatment and resources as predictors. b’s (regression coefficient estimates), their standard error (SE), and p-value are reported. Highly significant results are shown in bold, while the significant ones are italicized. Resilience and physical health are among the most important predictors of mental health.
| Outcome | Predictors | b | SE | p-value |
|---|---|---|---|---|
| CES-D depression | Exposure to unfair treatment | 8.210 | 8.297 | 0.324 |
| MAAS mindfulness | −3.018 | 0.997 | 0.003 | |
| BRS resilience | −4.436 | 1.187 | <0.001 | |
| CHIPS health | 0.253 | 0.064 | <0.001 | |
| Exposure to unfair treatment × 2way SSS social support | −0.155 | 0.069 | 0.027 | |
| CES-D depression | Severity of unfair treatment | 120.549 | 94.846 | 0.206 |
| 2way SSS social support | −0.083 | 0.041 | 0.045 | |
| MAAS mindfulness | −1.866 | 0.830 | 0.026 | |
| BRS resilience | −3.722 | 0.975 | <0.001 | |
| CHIPS health | 0.258 | 0.053 | <0.001 | |
| STAI anxiety | Exposure to unfair treatment | 19.643 | 11.216 | 0.082 |
| MAAS mindfulness | −3.248 | 1.348 | 0.017 | |
| CHIPS health | 0.223 | 0.087 | 0.011 | |
| STAI anxiety | Severity of unfair treatment | 212.648 | 126.749 | 0.095 |
| MAAS mindfulness | −2.415 | 1.109 | 0.031 | |
| CHIPS health | 0.222 | 0.070 | 0.002 | |
| PSS stress | Exposure to unfair treatment | −0.615 | 3.913 | 0.875 |
| BRS resilience | −4.167 | 0.745 | <0.001 | |
| CHIPS health | 0.116 | 0.041 | 0.005 | |
| PSS stress | Severity of unfair treatment | 33.019 | 37.763 | 0.383 |
| BRS resilience | −3.832 | 0.613 | <0.001 | |
| CHIPS health | 0.130 | 0.032 | <0.001 | |
| UCLA loneliness | Exposure to unfair treatment | −5.750 | 7.595 | 0.450 |
| 2way SSS social support | −0.238 | 0.059 | <0.001 | |
| MAAS mindfulness | −2.836 | 1.064 | 0.008 | |
| BRS resilience | −4.756 | 1.295 | <0.001 | |
| UCLA loneliness | Severity of unfair treatment | −31.101 | 67.304 | 0.645 |
| 2way SSS social support | −0.275 | 0.045 | <0.001 | |
| MAAS mindfulness | −2.481 | 0.867 | 0.005 | |
| BRS resilience | −3.397 | 1.048 | 0.001 |
We did not find any significant interaction effect except between social support and exposure to unfair treatment in relation to depression (b = −0.15, p-value=0.027); people who reported unfair treatment, and scored lower on social support, reported higher levels of depression (Figure 7). This is aligned with the differential reactivity hypothesis for the impact of unfair treatment as also reported elsewhere (e.g., [42]): having social support buffers some of the psychological distress of unfair treatment. This significant buffering effect suggests promising directions for program support and interventions.
Fig. 7.

Interaction between social support and exposure to unfair treatment in relation to depression. The magnitude of the slope of association for the group reporting unfair treatment is larger, indicating that the students have worse depressive symptoms with reduced social support.
Overall, our findings support our model of the relationship between discrimination and mental health and the moderating impact of resources, as laid out in Figure 1.
7.2. RQ2: Is Unfair treatment Characterized by Differences in Global Behaviors?
In RQ2, we are interested in general differences in behaviors between people who have experienced unfair treatment at least once during our study and those who did not experience such treatment. Our analysis did not find global behaviors that demonstrate a high confidence relationship with unfair treatment. None of our results were significant after applying the Benjamini-Hochberg correction.
7.3. RQ3: Is Unfair treatment Associated with Changes in Daily Affect?
We look at the immediate response to unfair treatment in RQ3, and find strong (high confidence) relationships with same-day and next-day daily reports of depression and frustration (Table 12). Anxiety ratings are also higher on the day of the event. The magnitude of difference is larger for depression and frustration than anxiety. Overall, people experiencing unfair treatment experience higher levels of negative affect and psychological distress but do not differ in levels of positive affect. This is consistent with earlier reports that discrimination is more strongly associated with higher negative but not lower positive states [60]. Our results demonstrate higher confidence and magnitude on the day of discrimination than the day after; experiences of unfair treatment lead to ~0.3 increase in ratings of both depression and frustration on the day of the event. On the day after we have ~0.2 increase in the ratings.
Table 12.
Significant relationships between unfair treatment reports and metrics indicative of daily affect, and passively sensed daily behavior (b: regression coefficient estimate, SE: standard error of the estimates). Highly significant results are shown in bold.
| Same-day Affect | b | SE | p-value |
|---|---|---|---|
| Daily depression | 0.29 | 0.06 | <0.001 |
| Daily frustration | 0.28 | 0.07 | <0.001 |
| Daily anxiety | 0.14 | 0.06 | 0.026 |
| Next-day Affect | b | SE | p-value |
| Daily depression | 0.24 | 0.07 | 0.002 |
| Daily frustration | 0.21 | 0.09 | 0.025 |
| Same-day Behaviors | b | SE | p-value |
| Number of activities | 0.11 | 0.06 | 0.049 |
| Number of calls (evening) | 0.57 | 0.29 | 0.048 |
| Number of interactions with phone (morning) | 5.19 | 2.42 | 0.032 |
| Time in bed | −13.57 | 6.85 | 0.048 |
| Number of steps | 554.53 | 276.16 | 0.045 |
For short-term measures, in addition to quantifying impact and confidence, we can look at how impact changes over time. As noted, the psychological distress we observe in our participants is stronger on the day of unfair treatment than the day after (larger b’s). We further examined the associations on the following days and the distress returns to values in the absence of unfair treatment on the second day (Figure 8).
Fig. 8.

Ratings of feeling depressed and frustrated (1: not at all, 5: extremely) 6 days before and after reports of unfair treatment. Day of unfair treatment is at zero. The following days come on the right as positive numbers and the days before come on the left as negative numbers. There is a large peak on the day of the report which lasts an additional day but then more or less dies off.
7.4. RQ4: Does Unfair treatment have Daily Behavioral Correlates?
In terms of short-term relationships between unfair treatment and behavior in RQ4, we find that, on average, people are more active and walk more (by ~500 steps), have more evening calls (~1 more), interact more with their phone in the morning (~5 more interactions), and spend less time in bed (~15 minutes less). These behaviors are consistent with increased psychological distress that we observed in affect ratings. As with affect, we have strong (though slightly weaker) confidence in these results. We cannot directly compare the magnitude of the change across different measures as each varies in a different range.
To explore the trend in these effects over time, we looked at a group of six behavior features and three affect measures which had strong relationships to unfair treatment events (low p-values). We calculated the confidence (p-value) that these variables would be different in the presence and absence of discrimination reports on day 0, day 1, and day 2 of the unfair treatment report (Figure 9). Our results demonstrate that most to all of the impact found in our data occurs on day 0 (the day of unfair treatment). This effect then falls (p-values rise) within the next two days.
Fig. 9.

Patterns of feature significance from the day before to two days after the discrimination event. The shortest bars represent the highest significance values (e.g., depressed and frustrated on day 0; depressed on day 1; morning screen use on day 2). There are no significant differences the day before. Most short-term relationships exist on the day of the event, a few appear on the next day (day 1). On the third day one significant difference, repeated, from the first day is observed.
8. DISCUSSION
Our goal in this work is to better understand whether there are changes in people’s psychological state and behavior associated with unfair treatment, particularly in the short-term. However, the broader value of this work lies in our ability to learn from what we observe regarding opportunities to improve the resources available to people, or even to intervene.
As described in our results section, overall, we see unfair treatment’s prevalence and its relation to mental health reflects what is found in the literature. This is reassuring evidence of the quality and representativeness of our sample and study procedures.
The novel contribution of our study lies specifically in our ability to understand the short-term changes associated with unfair treatment in a situated fashion, which brings together self-reports and passively-sensed behavioral data. Our results demonstrate a short-term change is present, and that it affects all of the categories of data predicted by the literature, including activity, phone use, social interaction, mobility, and sleep. Our results also demonstrate that the acute change is short-lived, lasting about a day. In examining this data we see several important results that have implications for the design of both individual and collaborative solutions, interventions, and resources.
8.1. Quantifying the impact of Unfair Treatment
As we have argued, the ability to quantify impact is very important. Looking at short-term changes, our study shows that unfair treatment most strongly hits participants within the first two days after the experience. With respect to self-reports, changes of depression and frustration are the strongest. We also see changes in a number of variables. The average changes found include increased physical activity during the day (~500 steps), increased calls in the evening (~1 call), increased interaction with the phone in the morning (by ~ 5 more interactions) and less time in bed (~15 min less), all on the day of the event. This resolves fairly quickly (approximately within a day). It should be noted that this average change may reflect an increase in variability, meaning we cannot differentiate between a situation where a some people walk less but more people walk more after unfair treatment, from a situation where everyone walks more. Our analysis technique does not differentiate between a clear positive trend and increased variability and this should be explored in future work.
Higher distress associated with reports of unfair treatment is consistent with its conceptualization as a stressor. Some of the observed changes in behavior suggest how the stress response in such experiences erodes the health resources with consequences for both mental health and academic performance. For example, we observe disturbed sleep, which is inversely related to physical and mental well-being [34] and can impact college students’ performance [51].
Some of the other behavior patterns we observe suggests potential coping mechanisms people employ to deal with the distress they experience. For example, increased interactions with the phone or phone calls can indicate attempts for seeking social support. Increased phone use can also be a self-regulatory behavior to withdraw attention from negative feelings to something else. More steps may indicate increased physical activity possibly to reduce stress [1]. In future work we would like to obtain further data to distinguish the nature of these in relation to coping, e.g., social support seeking using phone calls or related behaviors such as social media use.
There are several possible applications of these results. First, it might be possible to detect or quantify the magnitude of changes at the individual level (our current work only does this at the group level). A tool that could communicate such information might be able to support self-reflection or have value in a therapeutic context as a data source for discussion. Further, such a tool could suggest coping strategies, such as seeking social support and self-monitoring of emotional self-awareness. There is growing attention to tools and devices to support this kind of positive behavior change and their potential to help prevent mild symptoms from developing into more severe mental health problems [28, 61].
In future work, we plan to also explore intervention design. Expanding on the data we are collecting for four additional years, this study will continue to ask more and better questions about coping strategies that can further inform interventions.
8.2. A Social Model Perspective on Intervention
One of the most compelling goals for future work of a study like this is to find a way to influence and reduce either the prevalence or impact of discrimination. However, it is problematic to think that the only way to address discrimination is by expecting the person experiencing it to improve their coping strategies.
We take a disability studies perspective here because it provides a critical eye onto who should be responsible for inclusion (e.g., [36]). In particular, disability studies posits that the “medical model” of disability (which situates responsibility in the body) is limited in its ability to solve problems. An alternative, the “social model” argues that context is critical. Thus accessible technologies like curb stops address disability at the societal level, rather than the individual level. Taking a disability studies perspective on discrimination, we critique the instinct to focus solely on individuals. Efforts to strengthen individual resilience are important, but should take place alongside structural change. For example, educational institutions can take proactive stances, improve inclusiveness in classroom and laboratory environments, and educate organization members about discrimination and bias.
A social perspective also underscores the value of a stress and coping perspective as these models are inherently transactional [18], assessing both person and environmental factors in establishing stress sources, effects, and solutions. This suggests the need for future work collecting better information about unfair treatment context including who is involved and where it happens.
8.3. Discrimination in the Context of other Stressors
A social, transactional perspective of stress also suggests the value of considering discrimination effects within a broader ecology of individual’s other chronic stressors, as well as protective resources. For example, Prince et al. [53] found that while discrimination experiences in students significantly worsened mental and physical health and school performance, other chronic life stressors and protective resources influenced these effects. Importantly, there is social patterning of stress (disparities for some groups in what they experience and also buffering resources, e.g., [15]).
The data we collected allows for a fuller consideration of student stressors within which discrimination is embedded. In future work we plan to add other types of stressful life events to our analysis, looking more deeply at their cumulative impact on student stress, behavior and outcomes.
8.4. Computational Social Science
Another set of observations about our paper relates to the impact of technology on social science research. We have demonstrated the enormous value of phone and wearable data collection for characterizing the changes associated with social phenomena. However, the work of running our study and analyzing our data required a very high level of computational fluency. We argue that there is an opportunity for tools to better support this (e.g., [4]).
With respect to our specific modeling approach, we have quantified the relationship between an event and self-reported or passively-sensed indicators of mental health over time using simple linear regression analysis. However, our data is inherently non-linear and inter-related. In the future, we hope to apply more advanced techniques that can account for the non-linearity and model the inter-relations between various behavior. These models could lead to additional insights.
8.5. Limitations
Our study and data set provide opportunities to study a critically important set of issues. The effort by both experimenters and participants that went into data collection was large and costly, and we are grateful particularly to our participants for the gift of this data. Even so, there are always opportunities for improvement.
Our question about discrimination was flawed because while it asked about ancestry and national origin it did not directly ask about race-based discrimination. In addition, our picture of student stress and its impact is necessarily incomplete. We cannot survey students as often as we would like to get a complete picture. Also, students cannot be expected to wear Fitbits or carry phones at all times (e.g., devices need to be taken off to be charged or may not be worn during intense exercise). Moreover, what we measure has limited accuracy. For example, Fitbit devices do not always accurately detect sleep, its onset, or length.
Another limitation of our data is that it is largely correlational, limiting confidence as to causation. However, we do have the benefit of time-ordered data, e.g., changes in behavior and affect that occur after discrimination for multiple timepoints of EMAs. At present we are able to show trends in responses over both the sample and subgroups and are moving toward longitudinal analysis. These data are not yet usable, for example, to automate detection of discrimination impact for individuals, although future work may support this.
Finally, given the large number of analyses we ran, there is a chance that our estimates of significance are over confident. We took many precautions to reduce this risk, but our results ideally should be replicated in another study; this is something we plan to do in the future.
Even with these limitations we believe that the data provides important insights about the relationship between unfair treatment (both situational and cumulative) and behaviors as well as psychological distress, and suggests important next steps for addressing the impact of unfair treatment.
9. CONCLUSION
Understanding how day-to-day experiences of discrimination impact psychological state helps us to reason about the processes through which such experiences lead to deteriorated mental health. We identified patterns of self-reported and passively-sensed behaviors in relation to discrimination events in a sample of college students. Our findings illustrate the complexity of response to discriminatory encounters and that it changes over time.
Educational institutions are characterized by dominant attitudes and behaviors. Some disciplines are particularly vulnerable to gender, race, and nationality bias, including engineering [62], a discipline from which half our participants were drawn.
We believe that it is critically important to study these issues in the educational context, a sentiment recently argued in an NSF (National Science Foundation) Dear Colleague Letter encouraging research in sexual and other forms of harassment in STEM contexts2. The pervasiveness of these experiences was a surprise to our team, and addressing them is critical to creating a diverse and informed workforce. As Bill and Melinda Gates said in their recent Annual Letter3, data is sexist (and racist) and the biases inherent in the data we collect are necessary, indeed critical to address. This study is a hrst attempt to do so, and we hope to contribute to the development of this domain as an important topic of study for computational researchers.
CCS Concepts: • Human-centered computing → Ubiquitous and mobile computing; • Applied computing → Life and medical sciences.
ACKNOWLEDGEMENTS
We would like to thank our participants for their time and effort in the study, and our reviewers for their feedback. We would also like to thank Denzil Ferraira and Yuuki Nishiyama for their support during our use of the AWARE data collection infrastructure, and Afsaneh Doryab and Prerna Chikersal for their help with using AWARE feature extraction library. The material presented here is based upon work supported by the National Science Foundation under Grant Number IIS1816687 and IIS7974751, the National Institute on Disability, Independent Living and Rehabilitation Research under Grant Number 90DPGE0003-01, and the University of Washington College of Engineering.
Footnotes
ACM Reference Format:
Yasaman S. Sefidgar, Woosuk Seo, Kevin S. Kuehn, Tim Althoff, Anne Browning, Eve Riskin, Paula S. Nurius, Anind K. Dey, and Jennifer Mankoff. 2019. Passively-sensed Behavioral Correlates of Discrimination Events in College Students. Proc. ACM Hum.-Comput. Interact. 3, CSCW, Article 114 (November 2019), 29 pages. https://doi.org/10.1145/3359216
Contributor Information
YASAMAN S. SEFIDGAR, University of Washington, USA
WOOSUK SEO, University of Michigan, USA.
KEVIN S. KUEHN, University of Washington, USA
TIM ALTHOFF, University of Washington, USA.
ANNE BROWNING, University of Washington, USA.
EVE RISKIN, University of Washington, USA.
PAULA S. NURIUS, University of Washington, USA
ANIND K. DEY, University of Washington, USA
JENNIFER MANKOFF, University of Washington, USA.
REFERENCES
- [1].Aldana Steven G, Sutton Leanne D, Jacobson Bert H, and Quirk Michael G. 1996. Relationships between leisure time physical activity and perceived stress. Perceptual and Motor Skills 82, 1 (1996), 315–321. [DOI] [PubMed] [Google Scholar]
- [2].American Psychological Association. 2018. Stress in America: Generation Z. Technical Report. https://www.apa.org/news/press/releases/stress/2018/stress-gen-z.pdf
- [3].Banovic Nikola, Brant Christina, Mankoff Jennifer, and Dey Anind. 2014. ProactiveTasks: the short of mobile device use sessions. In Proceedings of the 16th International Conference on Human-computer Interaction with Mobile Devices & Services. ACM, 243–252. [Google Scholar]
- [4].Banovic Nikola, Buzali Tofi, Chevalier Fanny, Mankoff Jennifer, and Dey Anind K. 2016. Modeling and understanding human routine behavior. In Proceedings of the 2016 CHI Conference on Human Factors in Computing Systems. ACM, 248–260. [Google Scholar]
- [5].Benjamini Yoav and Hochberg Yosef. 1995. Controlling the false discovery rate: a practical and powerful approach to multiple testing. Journal of the Royal Statistical Society: series B (Methodological) 57, 1 (1995), 289–300. [Google Scholar]
- [6].Brondolo Elizabeth, Libby Daniel J, Denton Ellen-ge, Thompson Shola, Beatty Danielle L, Schwartz Joseph, Sweeney Monica, Tobin Jonathan N, Cassells Andrea, Pickering Thomas G, et al. 2008. Racism and ambulatory blood pressure in a community sample. Psychosomatic Medicine 70, 1 (2008), 49–56. [DOI] [PubMed] [Google Scholar]
- [7].Brown Kirk Warren and Ryan Richard M. 2003. The benefits of being present: mindfulness and its role in psychological well-being. Journal of Personality and Social Psychology 84, 4 (2003), 822–848. [DOI] [PubMed] [Google Scholar]
- [8].Carver Charles S. 1997. You want to measure coping but your protocol’s too long: Consider the brief cope. International Journal of Behavioral Medicine 4, 1 (1997), 92. [DOI] [PubMed] [Google Scholar]
- [9].Cohen Sheldon and Hoberman Harry M. 1983. Positive events and social supports as buffers of life change stress. Journal of Applied Social Psychology 13, 2 (1983), 99–125. [Google Scholar]
- [10].Cohen Sheldon, Kamarck Tom, and Mermelstein Robin. 1983. A global measure of perceived stress. Journal of Health and Social Behavior (1983), 385–396. [PubMed] [Google Scholar]
- [11].Cohen Sheldon, Kaplan Jay R, and Manuck Stephen B. 1994. Social support and coronary heart disease underlying psychological and biological mechanisms. In Social Support and Cardiovascular Disease. Springer, 195–221. [Google Scholar]
- [12].Cohn Jeffrey F., Cummins Nicholas, Epps Julien, Goecke Roland, Joshi Jyoti, and Scherer Stefan. 2019. The handbook of multimodal-multisensor interfaces. Association for Computing Machinery and Morgan Claypool, New York, NY, USA, Chapter Multimodal Assessment of Depression from Behavioral Signals, 375–417. 10.1145/3107990.3108004 [DOI] [Google Scholar]
- [13].Demirci Kadir, Akgönül Mehmet, and Akpinar Abdullah. 2015. Relationship of smartphone use severity with sleep quality, depression, and anxiety in university students. Journal of Behavioral Addictions 4, 2 (2015), 85–92. [DOI] [PMC free article] [PubMed] [Google Scholar]
- [14].Doryab Afsaneh, Chikarsel Prerna, Liu Xinwen, and Dey Anind K.. 2018. Extraction of behavioral features from smartphone and wearable data. CoRR abs/1812.10394 (2018). arXiv:1812.10394 http://arxiv.org/abs/1812.10394 [Google Scholar]
- [15].Dyson Rachael and Renk Kimberly. 2006. Freshmen adaptation to university life: depressive symptoms, stress, and coping. Journal of Clinical Psychology 62, 10 (2006), 1231–1244. [DOI] [PubMed] [Google Scholar]
- [16].Ferreira Denzil, Kostakos Vassilis, and Dey Anind K. 2015. AWARE: mobile context instrumentation framework. Frontiers in ICT 2 (2015), 6. [Google Scholar]
- [17].Fisher Celia B, Wallace Scyatta A, and Fenton Rose E. 2000. Discrimination distress during adolescence. Journal of Youth and Adolescence 29, 6 (2000), 679–695. [Google Scholar]
- [18].Folkman Susan and Nathan Peter E. 2011. The Oxford handbook of stress, health, and coping. Oxford University Press. [Google Scholar]
- [19].Gee Gilbert C, Spencer Michael, Chen Juan, Yip Tiffany, and Takeuchi David T. 2007. The association between self-reported racial discrimination and 12-month DSM-IV mental disorders among Asian Americans nationwide. Social Science & Medicine 64, 10 (2007), 1984–1996. [DOI] [PMC free article] [PubMed] [Google Scholar]
- [20].Girard Jeffrey M, Cohn Jeffrey F, Mahoor Mohammad H, Mavadati S Mohammad, Hammal Zakia, and Rosenwald Dean P. 2014. Nonverbal social withdrawal in depression: evidence from manual and automatic analyses. Image and vision computing 32, 10 (2014), 641–647. [DOI] [PMC free article] [PubMed] [Google Scholar]
- [21].Glenn Tasha and Monteith Scott. 2014. New measures of mental state and behavior based on data collected from sensors, smartphones, and the Internet. Current Psychiatry Reports 16, 12 (2014), 523. [DOI] [PubMed] [Google Scholar]
- [22].Gross James J and John Oliver P. 2003. Individual differences in two emotion regulation processes: Implications for affect, relationships, and well-being. Journal of Personality and Social Psychology 85, 2 (2003), 348. [DOI] [PubMed] [Google Scholar]
- [23].Guyll Max, Matthews Karen A, and Bromberger Joyce T. 2001. Discrimination and unfair treatment: Relationship to cardiovascular reactivity among African American and European American women. Health Psychology 20, 5 (2001), 315–325. [DOI] [PubMed] [Google Scholar]
- [24].Hoerl Arthur E and Kennard Robert W. 1970. Ridge regression: biased estimation for nonorthogonal problems. Technometrics 12, 1 (1970), 55–67. [Google Scholar]
- [25].Huang Yu, Xiong Haoyi, Leach Kevin, Zhang Yuyan, Chow Philip, Fua Karl, Teachman Bethany A, and Barnes Laura E. 2016. Assessing social anxiety using GPS trajectories and point-of-interest data. In Proceedings of the 2016 ACM International Joint Conference on Pervasive and Ubiquitous Computing. ACM, 898–903. [Google Scholar]
- [26].Johnson Paula A, Widnall Sheila E, and Benya Frazier F. 2018. Sexual harassment of women: climate, culture, and consequences in academic sciences, engineering, and medicine. Washington, DC: National Academies Press. [PubMed] [Google Scholar]
- [27].Kabacoff Robert I, Segal Daniel L, Hersen Michel, and Van Hasselt Vincent B. 1997. Psychometric properties and diagnostic utility of the Beck anxiety inventory and the state-trait anxiety inventory with older adult psychiatric outpatients. Journal of Anxiety Disorders 11, 1 (1997), 33–47. [DOI] [PubMed] [Google Scholar]
- [28].Kauer Sylvia Deidre, Reid Sophie Caroline, Crooke Alexander Hew Dale, Khor Angela, Hearps Stephen John Charles, Jorm Anthony Francis, Sanci Lena, and Patton George. 2012. Self-monitoring using mobile phones in the early stages of adolescent depression: randomized controlled trial. Journal of Medical Internet Research 14, 3 (2012), e67. [DOI] [PMC free article] [PubMed] [Google Scholar]
- [29].Kawachi Ichiro and Berkman Lisa F. 2001. Social ties and mental health. Journal of Urban health 78, 3 (2001), 458–467. [DOI] [PMC free article] [PubMed] [Google Scholar]
- [30].Kessler Ronald C, Mickelson Kristin D, and Williams David R. 1999. The prevalence, distribution, and mental health correlates of perceived discrimination in the United States. Journal of Health and Social Behavior (1999), 208–230. [PubMed] [Google Scholar]
- [31].Landrine Hope and Klonoff Elizabeth A. 1996. The schedule of racist events: a measure of racial discrimination and a study of its negative physical and mental health consequences. Journal of Black Psychology 22, 2 (1996), 144–168. [Google Scholar]
- [32].LeBlanc Allen J, Frost David M, and Wight Richard G. 2015. Minority stress and stress proliferation among same-sex and other marginalized couples. Journal of Marriage and Family 77, 1 (2015), 40–59. [DOI] [PMC free article] [PubMed] [Google Scholar]
- [33].Won Lee Sang, Ye Bae Geum, Rim Hyo-Deog, Lee Seung Jae, Chang Sung Man, Kim Byung-Soo, and Won Seunghee. 2018. Mediating effect of resilience on the association between emotional neglect and depressive symptoms. Psychiatry Investigation 15, 1 (2018), 62–69. [DOI] [PMC free article] [PubMed] [Google Scholar]
- [34].Léger Damien, Scheuermaier Karine, Philip Pierre, Paillard Michel, and Guilleminault Christian. 2001. SF-36: Evaluation of quality of life in severe and mild insomniacs compared with good sleepers. Psychosomatic Medicine 63, 1 (2001), 49–55. [DOI] [PubMed] [Google Scholar]
- [35].Maas Cora JM and Hox Joop J. 2005. Sufficient sample sizes for multilevel modeling. Methodology 1, 3 (2005), 86–92. [Google Scholar]
- [36].Mankoff Jennifer, Hayes Gillian R, and Kasnitz Devva. 2010. Disability studies as a source of critical inquiry for the field of assistive technology. In Proceedings of the 12th International ACM SIGACCESS Conference on Computers and Accessibility. ACM, 3–10. [Google Scholar]
- [37].Marshall Nancy L, Barnett Rosalind C, and Sayer Aline. 1997. The changing workforce, job stress, and psychological distress. Journal of Occupational Health Psychology 2, 2 (1997), 99–107. [DOI] [PubMed] [Google Scholar]
- [38].Martin Jack K, Tuch Steven A, and Roman Paul M. 2003. Problem drinking patterns among African Americans: the impacts of reports of discrimination, perceptions of prejudice, and "risky" coping strategies. Journal of Health and Social Behavior (2003), 408–425. [PubMed] [Google Scholar]
- [39].Min Jun-Ki, Doryab Afsaneh, Wiese Jason, Amini Shahriyar, Zimmerman John, and Hong Jason I. 2014. Toss’n’turn: smartphone as sleep and sleep quality detector. In Proceedings of the SIGCHI Conference on Human Factors in Computing Systems. ACM, 477–486. [Google Scholar]
- [40].Morrison Dianne N, McGee ROB, and Stanton Warren R. 1992. Sleep problems in adolescence. Journal of the American Academy of Child & Adolescent Psychiatry 31, 1 (1992), 94–99. [DOI] [PubMed] [Google Scholar]
- [41].Moss-Racusin Corinne A., Dovidio John F., Brescoll Victoria L., Graham Mark J., and Handelsman Jo. 2012. Science faculty’s subtle gender biases favor male students. Proceedings of the National Academy of Sciences 109, 41 (2012), 16474–16479. 10.1073/pnas.1211286109arXiv:https://www.pnas.org/content/109/41/16474.full.pdf [DOI] [PMC free article] [PubMed] [Google Scholar]
- [42].Mossakowski Krysia N and Zhang Wei. 2014. Does social support buffer the stress of discrimination and reduce psychological distress among Asian Americans? Social Psychology Quarterly 77, 3 (2014), 273–295. [Google Scholar]
- [43].Nezlek John B, Imbrie Mark, and Shean Glenn D. 1994. Depression and everyday social interaction. Journal of Personality and Social Psychology 67, 6 (1994), 1101. [DOI] [PubMed] [Google Scholar]
- [44].Ong Anthony D, Fuller-Rowell Thomas, and Burrow Anthony L. 2009. Racial discrimination and the stress process. Journal of Personality and Social Psychology 96, 6 (2009), 1259. [DOI] [PubMed] [Google Scholar]
- [45].Pager Devah and Shepherd Hana. 2008. The sociology of discrimination: racial discrimination in employment, housing, credit, and consumer markets. Annual Review of Sociolgy 34 (2008), 181–209. [DOI] [PMC free article] [PubMed] [Google Scholar]
- [46].Papadimitriou George N and Linkowski Paul. 2005. Sleep disturbance in anxiety disorders. International Review of Psychiatry 17, 4 (2005), 229–236. [DOI] [PubMed] [Google Scholar]
- [47].Pascoe Elizabeth A and Richman Laura Smart. 2009. Perceived discrimination and health: a meta-analytic review. Psychological Bulletin 135, 4 (2009), 531. [DOI] [PMC free article] [PubMed] [Google Scholar]
- [48].Pearlin Leonard I, Schieman Scott, Fazio Elena M, and Meersman Stephen C. 2005. Stress, health, and the life course: Some conceptual perspectives. Journal of Health and Social Behavior 46, 2 (2005), 205–219. [DOI] [PubMed] [Google Scholar]
- [49].Pierce Chester. 1995. Stress analogs of racism and sexism: terrorism, torture, and disaster. Mental Health, Racism, and Sexism (1995), 277–293. [Google Scholar]
- [50].Pieterse Alex L and Carter Robert T. 2007. An examination of the relationship between general life stress, racism-related stress, and psychological health among black men. Journal of Counseling Psychology 54, 1 (2007), 101. [Google Scholar]
- [51].Pilcher June J and Walters Amy S. 1997. How sleep deprivation affects psychological variables related to college students’ cognitive performance. Journal of American College Health 46, 3 (1997), 121–126. [DOI] [PubMed] [Google Scholar]
- [52].Pinheiro Jose, Bates Douglas, DebRoy Saikat, Sarkar Deepayan, and R Core Team. 2018. nlme: linear and nonlinear mixed effects models. https://CRAN.R-project.org/package=nlme R package version 3.1-137.
- [53].Prince Dana M, Rocha Anita, and Nurius Paula S. 2018. Multiple disadvantage and discrimination: implications for adolescent health and education. Social Work Research 42, 3 (2018), 169–179. [DOI] [PMC free article] [PubMed] [Google Scholar]
- [54].R Core Team. 2013. R: a language and environment for statistical computing. R Foundation for Statistical Computing, Vienna, Austria. http://www.R-project.org/ ISBN 3-900051-07-0. [Google Scholar]
- [55].Radloff Lenore Sawyer. 1977. The CES-D scale: A self-report depression scale for research in the general population. Applied Psychological Measurement 1, 3 (1977), 385–401. [Google Scholar]
- [56].Robinson William H, McGee Ebony O, Bentley Lydia C, Houston Stacey L, Botchway Portia K, and Roy Ruchi. 2015. Racial and gendered experiences that dissuade a career in the professoriate. In Research in Equity and Sustained Participation in Engineering, Computing, and Technology (RESPECT), 2015. IEEE, 1–5. [Google Scholar]
- [57].Russell Daniel W. 1996. UCLA loneliness scale (version 3): reliability, validity, and factor structure. Journal of Personality Assessment 66, 1 (1996), 20–40. [DOI] [PubMed] [Google Scholar]
- [58].Saeb Sohrab, Lattie Emily G, Schueller Stephen M, Kording Konrad P, and Mohr David C. 2016. The relationship between mobile phone location sensor data and depressive symptom severity. PeerJ 4 (2016), e2537. [DOI] [PMC free article] [PubMed] [Google Scholar]
- [59].Saeb Sohrab, Zhang Mi, Karr Christopher J, Schueller Stephen M, Corden Marya E, Kording Konrad P, and Mohr David C. 2015. Mobile phone sensor correlates of depressive symptom severity in daily-life behavior: an exploratory study. Journal of Medical Internet Research 17, 7 (2015), e175. [DOI] [PMC free article] [PubMed] [Google Scholar]
- [60].Schmitt Michael T, Branscombe Nyla R, Postmes Tom, and Garcia Amber. 2014. The consequences of perceived discrimination for psychological well-being: a meta-analytic review. Psychological bulletin 140, 4 (2014), 921. [DOI] [PubMed] [Google Scholar]
- [61].Schroeder Jessica, Wilkes Chelsey, Rowan Kael, Toledo Arturo, Paradiso Ann, Czerwinski Mary, Mark Gloria, and Linehan Marsha M. 2018. Pocket skills: A conversational mobile web app to support dialectical behavioral therapy. In Proceedings of the 2018 CHI Conference on Human Factors in Computing Systems. ACM, 398:1–398:15. [Google Scholar]
- [62].Sevo Ruta and Chubin Daryl E. 2010. Bias literacy: A review of concepts in research on gender discrimination and the US context. In Women in Engineering, Science and Technology: Education and Career Challenges. IGI Global, 21–54. [Google Scholar]
- [63].Shakespeare-Finch Jane and Obst Patricia L. 2011. The development of the 2-way social support scale: a measure of giving and receiving emotional and instrumental support. Journal of personality assessment 93, 5 (2011), 483–490. [DOI] [PubMed] [Google Scholar]
- [64].Sheppes Gal, Scheibe Susanne, Suri Gaurav, and Gross James J. 2011. Emotion-regulation choice. Psychological Science 22, 11 (2011), 1391–1396. [DOI] [PubMed] [Google Scholar]
- [65].Richman Laura Smart, Pek Jolynn, Pascoe Elizabeth, and Bauer Daniel J. 2010. The effects of perceived discrimination on ambulatory blood pressure and affective responses to interpersonal stress modeled over 24 hours. Health Psychology 29, 4 (2010), 403–411. [DOI] [PubMed] [Google Scholar]
- [66].Smith Bruce W, Dalen Jeanne, Wiggins Kathryn, Tooley Erin, Christopher Paulette, and Bernard Jennifer. 2008. The brief resilience scale: assessing the ability to bounce back. International Journal of Behavioral Medicine 15, 3 (2008), 194–200. [DOI] [PubMed] [Google Scholar]
- [67].Solorzano Daniel, Ceja Miguel, and Yosso Tara. 2000. Critical race theory, racial microaggressions, and campus racial climate: the experiences of African American college students. Journal of Negro Education (2000), 60–73. [Google Scholar]
- [68].Spencer-Rodgers Julie, Major Brenda, Forster Daniel E, and Peng Kaiping. 2016. The power of affirming group values: group affirmation buffers the self-esteem of women exposed to blatant sexism. Self and Identity 15, 4 (2016), 413–431. [DOI] [PMC free article] [PubMed] [Google Scholar]
- [69].Steffen Patrick R, McNeilly Maya, Anderson Norman, and Sherwood Andrew. 2003. Effects of perceived racism and anger inhibition on ambulatory blood pressure in African Americans. Psychosomatic Medicine 65, 5 (2003), 746–750. [DOI] [PubMed] [Google Scholar]
- [70].Stephens Thomas. 1988. Physical activity and mental health in the United States and Canada: evidence from four population surveys. Preventive Medicine 17, 1 (1988), 35–47. [DOI] [PubMed] [Google Scholar]
- [71].Steptoe AS and Butler Neville. 1996. Sports participation and emotional wellbeing in adolescents. The Lancet 347, 9018 (1996), 1789–1792. [DOI] [PubMed] [Google Scholar]
- [72].Swim Janet K, Hyers Lauri L, Cohen Laurie L, Fitzgerald Davita C, and Bylsma Wayne H. 2003. African American college students’ experiences with everyday racism: characteristics of and responses to these incidents. Journal of Black psychology 29, 1 (2003), 38–67. [Google Scholar]
- [73].Turner R Jay. 2013. Understanding health disparities: The relevance of the stress process model. Society and Mental Health 3, 3 (2013), 170–186. [Google Scholar]
- [74].Vandeputte Melissa and de Weerd Al. 2003. Sleep disorders and depressive feelings: a global survey with the Beck depression scale. Sleep Medicine 4, 4 (2003), 343–345. [DOI] [PubMed] [Google Scholar]
- [75].Wang Rui, Aung Min SH, Abdullah Saeed, Brian Rachel, Campbell Andrew T, Choudhury Tanzeem, Hauser Marta, Kane John, Merrill Michael, Scherer Emily A, et al. 2016. CrossCheck: Toward passive sensing and detection of mental health changes in people with schizophrenia. In Proceedings of the 2016 ACM International Joint Conference on Pervasive and Ubiquitous Computing. ACM, 886–897. [Google Scholar]
- [76].Wang Rui, Chen Fanglin, Chen Zhenyu, Li Tianxing, Harari Gabriella, Tignor Stefanie, Zhou Xia, Ben-Zeev Dror, and Campbell Andrew T. 2014. StudentLife: Assessing mental health, academic performance and behavioral trends of college students using smartphones. In Proceedings of the 2014 ACM International Joint Conference on Pervasive and Ubiquitous Computing. ACM, 3–14. [Google Scholar]
- [77].Wang Rui, Wang Weichen, daSilva Alex, Huckins Jeremy F, Kelley William M, Heatherton Todd F, and Campbell Andrew T. 2018. Tracking depression dynamics in college students using mobile phone and wearable sensing. Proceedings of the ACM on Interactive, Mobile, Wearable and Ubiquitous Technologies 2, 1 (2018), 43. [Google Scholar]
- [78].Williams Melissa J, Elizabeth Levy Paluck, and Spencer-Rodgers Julie. 2010. The masculinity of money: automatic stereotypes predict gender differences in estimated salaries. Psychology of Women Quarterly 34, 1 (2010), 7–20. [Google Scholar]