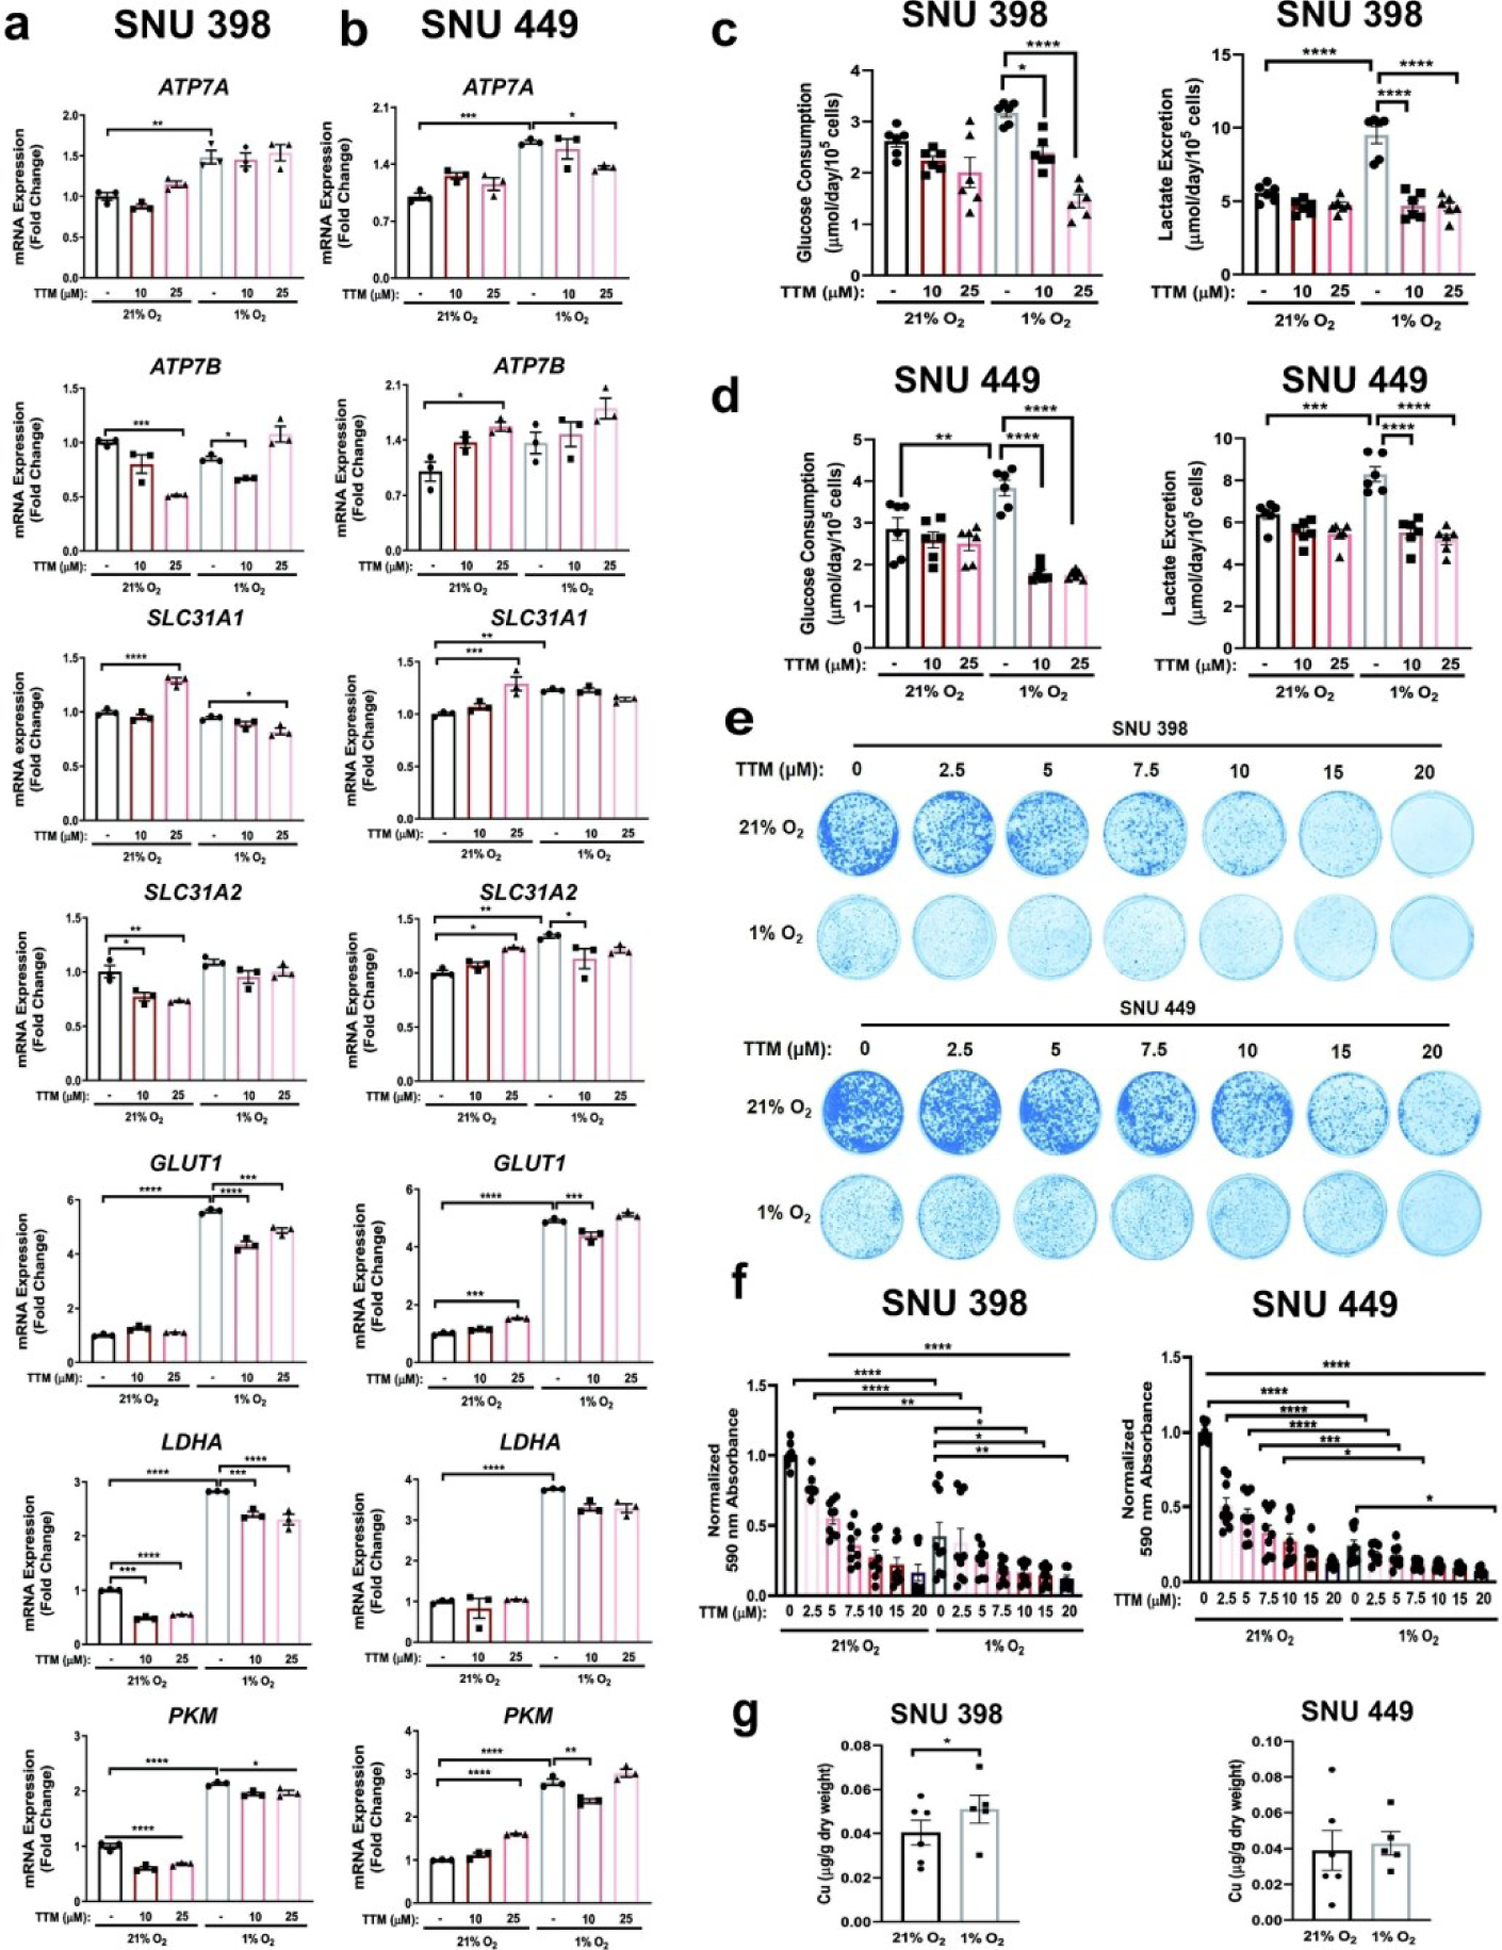
Fig. 5. Hypoxic conditions in combination with TTM alter HCC metabolism.

(a and b) Scatter dot plot with bar at mean ±s.e.m. of normalized quantitative PCR (qPCR) mRNA expression of indicated genes from SNU398 (a) and SNU449 (b) cells upon treatment with 10 μM or 25 μM TTM or exposure to hypoxic (1% O2) conditions for 48 hours. Representative n of three biologically independent experiments performed in technical triplicate. (c and d) Scatter dot plot with bar at mean +s.e.m. of glucose consumption (left) or lactate excretion (right) rates from SNU398 (c) and SNU449 (d) cells upon treatment with 10 μM or 25 μM TTM or exposure to hypoxic conditions for 48 hours. n = 3 biologically independent experiments performed in technical duplicate. (e) Representative images of crystal violet stained colonies from SNU398 (top) and SNU449 (bottom) HCC cells treated with vehicle (DMSO) or increasing concentrations of TTM in normoxic (21% O2) or hypoxic conditions for seven days of three independent experiments plated in technical triplicate. (f) Scatter dot plot of mean absorbance of extracted crystal violet at 590 nm ±s.e.m. of crystal violet staining experiments in (e). (g) Scatter dot plot of ICP-MS detection with bar at mean Cu (μg/g dry weight) from indicated HCC cell lines exposed to normoxic or hypoxic conditions. n = 6 biologically independent experiments performed and statistical analysis was performed with a paired, two-tailed student t-test *P = 0.0257. For panels a–f, statistical analysis was performed using a one-way ANOVA followed by Tukey’s multiple comparison test. *P < 0.0332, **P < 0.0021, ***P < 0.0002, ****P < 0.0001.
