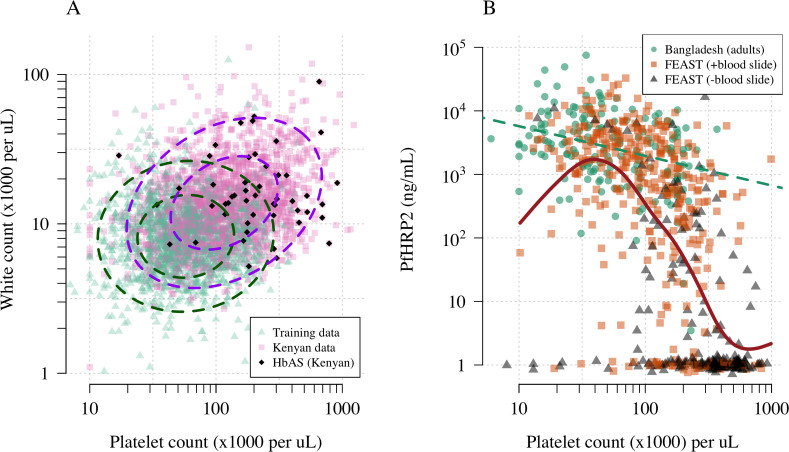
Figure 1. Platelet counts and white blood cell counts as diagnostic predictors of severe falciparum malaria.
Panel (A) shows the bivariate marginal distribution for the reference data (thought to be highly specific to severe malaria, green triangles, n = 1704, summarised in Table 1) and for the Kenyan case data (pink squares, n = 2220; black diamonds: HbAS). The dashed ellipses show the 50% and 95% bivariate normal probability contours approximating each dataset (dark green: reference data; purple: Kenyan data). Panel (B) shows the relationship between platelet counts and plasma PfHRP2 in adults with severe malaria from Bangladesh (green circles, n = 172, the dashed green line shows a linear fit) and in children enrolled in the FEAST trial (n = 567, not specific to severe malaria, Maitland et al., 2011). Undetectable plasma PfHRP2 concentrations were set to 1 ng/mL ± random jitter. Orange squares: malaria-positive blood slide; black triangles: malaria-negative blood slide. The brown line shows a spline fit to the FEAST data (smooth.spline function in R with default parameters) including the data points where PfHRP2 was below the lower limit of detection.

