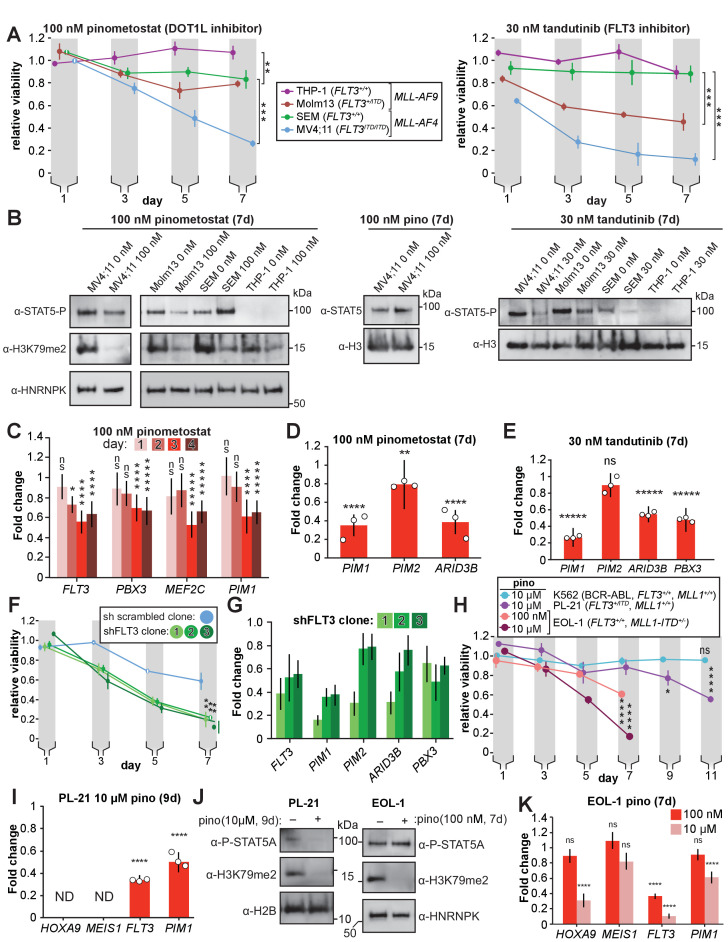
Figure 4. DOT1L inhibition reduces STAT5A activation and downregulates STAT5A targets in FLT3-ITD leukemia lines.
(A) MLL-rearranged leukemia lines with genotypes indicated were treated with 100 nM pinometostat (left panel, DOT1L inhibitor) or 30 nM tandutinib (right panel, FLT3 inhibitor MLN518), and relative growth monitored by CellTiter Glo 2.0 assay on the indicated days. Relative viability presented is the mean fraction of luminescence of treated versus side-by-side mock treated cultures (same volume of DMSO) for three independent replicates ± S.E.M. Student’s t-test (** p ≤ 0.01, *** p ≤ 0.001). (B) Western blots of phosphorylated STAT5 (active) or total STAT5A with H3 or HNRNPK as loading controls across the cell lines from panel A treated as indicated; H3K79me2 is monitored in pinometostat-treated lines to confirm inhibition. (C) Time course of gene expression by RT-qPCR, presented as mean fold-change of FLT3, PBX3, PIM1, and MEF2C in MV4;11 cells ± 100 nM pinometostat at each time point indicated ± S.E.M.; n = 3; Student’s t-test (ns p > 0.05, * p ≤ 0.05, **** p ≤ 0.0001, ***** p < 0.00001). (D-E) DOT1L and FLT3 inhibition downregulate STAT5A targets in FLT3-ITD. RT-qPCR expression analysis presented as mean fold-change ± S.E.M. for the indicated transcript in MV4;11 cells treated with indicated inhibitor versus mock-treatment for 7 days. Student’s t-test (** p < 0.01, **** p < 0.0001, ***** p < 0.00001). (F) Proliferation assay as in panel A, with three clonal populations of MV4;11 cells virally transduced, selected, then induced to express shRNA to FLT3 (Green et al., 2015) or a scrambled shRNA (Yuan et al., 2009) control by 1 µg/mL doxycycline. Means of fractional viability relative to uninduced cells ± S.E.M. are shown for three independent experiments; Student’s t-test (** p < 0.01). (G) RT-qPCR analysis of PIM1, PIM2, and ARID3B expression in MV4;11 cells expressing an inducible shRNA targeting FLT3 (Green et al., 2015) for 7 days. Results are depicted as fold-change expression of control cells expressing shRNA to GFP (Scheeren et al., 2005). (H) Proliferation assay of K562, PL-21, and EOL-1 cells treated with 10 µM or 100 nM pinometostat using CellTiter Glo 2.0 to measure viability, showing the luminescence fraction of inhibited over DMSO-treated cells. Means ± SE are shown for three independent experiments. Student’s t-test of day 7 (EOL-1 cells), day 9 (PL-21), or days 9 and 11 (K562 and PL-21) values: ns p > 0.05, * p < 0.05, **** p < 0.0001. (I) Gene expression analysis by RT-qPCR in PL-21 cells treated for 9 days with 10 µM pinometostat. Results are displayed as fold-change over DMSO-treated cells with means ± SE for three independent experiments (ND = not detected). Student’s t-test (**** p < 0.0001). (J) Western blots of (left) cell extract from PL-21 cells treated with 10 µM pinometostat for 9 days and (right) EOL-1 cells treated with 100 nM pinometostat for 7 days and then blotted for H3K79me2 and p-STAT5 with H2B or HNRNPK as a loading controls. (K) Gene expression analysis by RT-qPCR in EOL-1 cells treated for 7 days with 100 nM or 10 µM pinometostat. Results are displayed as fold-change over DMSO-treated cells with means ± SE for three independent experiments. Student’s t-test (ns p > 0.05, **** p < 0.0001).


