

ABSTRACT
High-avidity antibodies (Abs) are acquired after a few Plasmodium falciparum infections in low transmission areas, but it remains unclear if Ab avidity to different merozoite antigens increases with age in individuals with persistent antigenemia and, if so, when a fully mature Ab response occurs. The study used plasma samples collected between 1996 and 1998 from 566 individuals aged 4 to 84 years in Simbok, Cameroon, where residents received an estimated 1.6 infectious mosquito bites/person/night. Plasma samples were examined for Ab levels (median fluorescence intensity [MFI]) and Ab avidity index (AI) (where AI = [MFI after treatment with 2 M NH4SCN/MFI without salt] × 100) using a bead-based multiplex immunoassay for recombinant AMA1, EBA-175, MSP1-42 (3D7, FVO), MSP2 (3D7, Fc27), and MSP3. Blood-smear positivity for P. falciparum declined with age from 54.3% at 4 to 5 years to 18% at 16 to 40 years and <11% at >40 years of age, although most individuals had submicroscopic parasitemia. Ab affinity maturation, based on age-related patterns of median AI, percentage of individuals with AI of ≥50, and strength of association between MFI and AI, occurred at different rates among the antigens; they developed rapidly before age 4 years for AMA1, increased gradually with age for EBA-175 and MSP1 until ∼16 to 25 years, but occurred negligibly for MSP2 and MSP3. In a hyperendemic area with perennial transmission, affinity maturation resulting in an increase in the proportion of high-avidity Abs occurred for some merozoite antigens, in parallel with a decline in malaria slide passivity, but not for others.
KEYWORDS: antibody avidity, malaria, merozoite antigens
INTRODUCTION
Antibody (Ab) quantity and quality are important in immunity to P. falciparum malaria. Antibody avidity (or functional affinity) is the net antigen-binding force of populations of Abs in sera (1) and provides an indication of the overall extent of affinity maturation. Considering the importance of Ab quality in malarial immunity, relatively few studies have investigated Ab avidity in naturally infected individuals. It remains unclear if Ab avidity to P. falciparum increases with age and, if so, when a fully mature Ab response is attained.
Early studies reported that Ab avidity to an extract of P. falciparum-infected erythrocytes increased after a few infections in a low-transmission region (2, 3). For example, Leoratti et al. (2008) reported that the proportion of high-avidity Ab to a schizont extract increased from 23% after one episode of P. falciparum to 72% after more than 5 clinical attacks (3). In high-transmission areas, however, studies have found little or no increase in Ab avidity with age to merozoite antigens, including MSP1, MSP2, MSP3, and EBA-175 (4–9), although an increase with age for AMA1 has been reported (4, 5). In order for Ab avidity to increase, the concentration of antigen must become limiting so that B cells with higher-affinity B cell receptors (BCR, surface IgG) can outcompete both B cells with lower-affinity BCR and antibodies bound to antigen on follicular dendritic cells (10–12). In low-transmission areas, it is easy to envision that clonal selection of affinity-mature B cells occurs after parasite clearance, resulting in higher avidity IgG, but it remains uncertain in areas where individuals are infected repeatedly or have chronic asymptomatic infections whether antigen levels drop sufficiently to support clonal selection.
Data from Ab avidity studies in malaria-endemic areas give a confusing picture about changes in Ab avidity with age and the role of Ab avidity in immunity. Part of the problem is that multiple variables influence the results of previous studies, including differences in (i) malaria transmission intensity, (ii) age groups, (iii) recombinant antigens, (iv) sample sizes, and (v) protocols used for measuring Ab avidity. A few studies used plasma magnetic resonance and bilayer interferometry to measure Ab avidity (4, 7, 13), but most studies have used the enzyme-linked immunosorbent assay (ELISA) format with a variety of chaotropes. For example, four studies used 4 M guanidine HCl to assess Ab avidity to the merozoite antigens AMA1 (5, 6, 9, 14), MSP1 (5, 6, 9, 14), MSP2 (9), and MSP3 (5); five studies used 8 M urea for Ab avidity to a schizont extract (3), Plasmodium vivax MSP1 and P. vivax Duffy binding protein (15, 16); and six studies used thiocyanate to measure avidity to a schizont extract (3), EBA-175 (8), and VAR2CSA (17, 18). The use of different protocols and antigens, as well as the other variables, make it difficult to interpret study results. However, a recent comprehensive study compared different concentrations of the 3 chaotropes in a bead-based multiplex immunoassay (MIA) format using 5 merozoite antigens (19). The results showed that 2 M NH4SCN provided the widest range of avidity indexes for AMA1, EBA-175, MSP1, MSP2, and MSP3, that 2 M NH4SCN was in the middle of the Ab exclusion curve (i.e., released ∼50% of Ab bound to the 5 antigens), and that the assay was reproducible. The current study used the optimized bead-based avidity MIA to study changes in Ab avidity with age in a high-transmission setting.
Plasma samples and malariometric data collected between 1996 and 1998 were available from 566 individuals with ages ranging from 4 to 84 years who lived in the rural Cameroonian village of Simbok (20). In this village, malaria transmission was perennial, with two wet and two dry seasons. Entomological inoculation rates (EIR) were estimated to be 1.9 and 1.2 infected mosquito bites/person/per night in the wet and dry seasons, respectively. Thus, Simbok residents were infected daily throughout the year. These samples provided an excellent opportunity to evaluate the effect of persistent antigenemia on affinity maturation of Abs to merozoite antigens.
RESULTS
Characteristics of the study population.
The 566 participants were divided into 9 age groups, resulting in an average of 63 individuals per group (range: 35 to 119) (Table 1). The prevalence of slide-positive P. falciparum malaria in Simbok progressively declined with age, from 54.3% in children 4 to 5 years old to <11% in adults of >40 years of age. However, PCR results using 18S rRNA and Cox3 primers revealed that most individuals had very low levels of P. falciparum parasites circulating in their peripheral blood; specifically, 100% of children 4 to 10 years, 93% of people ages 11 to 20 years, 85% of people 21 to 30 years, 84% of people 31 to 40 years, and 75% of adults >40 years were PCR-positive (Fig. 1). As expected, peripheral parasitemia, that is, the number of infected erythrocytes per μl of blood, also decreased with age (Table 1). The prevalence of anemia, which is frequently associated with malaria, was highest in children and adolescents 6 to 20 years of age, and declined to ∼15% in adults >40 years of age. Overall, 22.1% of the residents of Simbok were anemic (125/566). Thus, in this high-transmission village, slide-positive cases of P. falciparum peripheral parasitemia declined with age, but most individuals maintained chronic infections that were detectable only by PCR (submicroscopic parasitemia).
TABLE 1.
Characteristics of study participants in Simbok, Cameroon (1996 to 1998)
| Age group (yrs) | No. of people | % Slide-positive for Pfa,c | Median parasitemia (IE/μl blood) (IQR)b,c | Mean hemoglobin (g/dl) ± SD | Mean % PCV ± SDc | % with anemiad |
|---|---|---|---|---|---|---|
| 4–5 | 35 | 54.3 | 1,000 (315–1,915) | 11.6 ± 1.2 | 34.9 ± 3.8 | 37.1 |
| 6–10 | 119 | 40.3 | 516 (164–1,524) | 12.0 ± 1.4 | 36.1 ± 4.2 | 27.7 |
| 11–15 | 95 | 28.4 | 246 (160–824) | 12.7 ± 1.2 | 38.1 ± 3.6 | 16.8 |
| 16–20 | 51 | 19.6 | 652 (80–1,214) | 12.6 ± 1.6 | 38.0 ± 4.9 | 25.5 |
| 21–25 | 46 | 15.2 | 140 (80–277) | 13.5 ± 1.9 | 40.5 ± 5.6 | 17.4 |
| 26–30 | 46 | 17.4 | 240 (129–372) | 12.5 ± 1.8 | 37.6 ± 5.3 | 26.1 |
| 31–40 | 66 | 19.7 | 120 (100–345) | 13.2 ± 1.7 | 39.5 ± 5.1 | 21.2 |
| 41–50 | 38 | 10.5 | 180 (130–674) | 13.7 ± 1.4 | 40.0 ± 3.9 | 10.5 |
| >50 | 70 | 10.0 | 313 (200–360) | 13.2 ± 1.5 | 39.8 ± 4.5 | 17.1 |
Percentage of subjects in each age group who were thick blood smear positive.
Median and interquartile range (25th to 75th percentiles) for slide-positive individuals.
Pf, Plasmodium falciparum; IE, infected erythrocytes; PCV, packed cell volume; SD, standard deviation.
Anemia was defined as hemoglobin levels 11.0 g/dL in <5 years of age, as 11.5 g/dL in 5 to <12 years of age, and <12 g/dL in ≥12 years of age (33).
FIG 1.

Malaria prevalence in Simbok. Results for slide-positivity are based on thick films for all 566 individuals. PCR was performed using primers for 18S rRNA and Cox3 and results are based on 150 samples randomly selected from all age groups. The age distribution of the 150 samples used for PCR was as follows: 4 to 5 years (n = 8); 6 to 10 years (n = 21); 11 to 15 years (n = 29); 16 to 20 years (n = 11); 21 to 25 years (n = 13); 26 to 30 years (n = 13); 31 to 40 years (n = 19); 41 to 50 years (n = 13); and 51+ years (n = 23). Data labeled Cox3 + 18S shows the percentage of samples that were PCR-positive with one or both primers.
Changes in antibody prevalence with age.
Over 90% of children 4 to 5 years of age had Abs to AMA1, EBA-175, MSP2 (3D7 and FcR3), and MSP3, with high Ab prevalence in all age groups (Table 2). In comparison, among children 4 to 5 years of age, only 60% and 86% had Ab to the 3D7 and FVO strains of MSP1-42, respectively, with Ab prevalence increasing during adolescence such that by adulthood over 93% of individuals had Abs to either strain of MSP1-42. Thus, most individuals in Simbok produce Abs to the 5 merozoite antigens, but maximal prevalence was obtained at different ages.
TABLE 2.
Prevalence (% antibody positive) of antibodies to merozoite antigensa
| Age group (yrs) | No. of people | AMA-1 | EBA-175 | MSP1-42 3D7 | MSP1-42 FVO | MSP2 3D7 | MSP2 FcR3 | MSP3 |
|---|---|---|---|---|---|---|---|---|
| 4–5 | 35 | 97 | 94 | 60 | 86 | 97 | 94 | 91 |
| 6–10 | 119 | 100 | 86 | 66 | 92 | 96 | 95 | 94 |
| 11–15 | 95 | 98 | 85 | 77 | 94 | 97 | 96 | 95 |
| 16–20 | 51 | 100 | 92 | 86 | 100 | 100 | 98 | 96 |
| 21–25 | 46 | 100 | 98 | 93 | 98 | 100 | 100 | 91 |
| 26–30 | 46 | 100 | 98 | 96 | 98 | 98 | 100 | 98 |
| 31–40 | 66 | 100 | 100 | 95 | 95 | 97 | 98 | 95 |
| 41–50 | 38 | 97 | 100 | 95 | 100 | 95 | 97 | 97 |
| >50 | 70 | 97 | 96 | 91 | 99 | 96 | 99 | 96 |
Cutoff MFI values signifying Ab positivity were as follows: AMA1 = 546; EBA-175 = 291; MSP1-42 3D7 = 429; MSP1-42 FVO = 285; MSP2 3D7 = 613; MSP2 Fc27 = 620; and MSP3 = 992.
Changes in Ab levels (median fluorescence intensity) with age.
IgG Ab levels for AMA1, MSP2 (3D7 and FcR3), and MSP3 did not differ significantly among the 9 age groups (Kruskal-Wallis [KW] test, all P values > 0.05) (Fig. 2A, E to G). On the other hand, Ab levels to EBA-175 and MSP1-42 (3D7 and FVO) were significantly different (KW, P < 0.001 for each of the three antigens), with an upward trend in Ab levels from 4 to 5 years of age to 31 to 40 years, at which time median Ab levels seemed to reach peak levels (Fig. 2B to D). In order to more precisely define when Ab levels became maximal, pairwise median fluorescence intensity (MFI) comparisons were made between the age group with the apparent highest median, i.e., 31 to 40 years, and the preceding ordered age groups for each antigen (Fig. 2H). The analysis for MSP1-42 (both alleles) showed that Ab levels were significantly higher at 31 to 40 years compared to 4 to 5 years (adjusted P < 0.001), 6 to 10 years (adjusted P < 0.001), and 11 to 15 years (adjusted P = 0.001), but not significantly different from levels at 16 to 20, 21 to 25, and 26 to 30 years (each adjusted P > 0.05) (Fig. 2H). The analysis for EBA-175 demonstrated a similar pattern, but the MFI at 31 to 40 years was only significantly different from the MFI at 4 to 5 years (P = 0.001) and 6 to 10 years (P = 0.011) (Fig. 2H). Therefore, Ab levels to EBA-175 and MSP1-42 (3D7 and FVO) increased with age from 4 to 5 years until 11 to 15 and 16 to 20 years, respectively, and remained stable thereafter, whereas, adult levels of Abs to AMA1, MSP2 (both alleles), and MSP3 were already present at 4 to 5 years of age.
FIG 2.
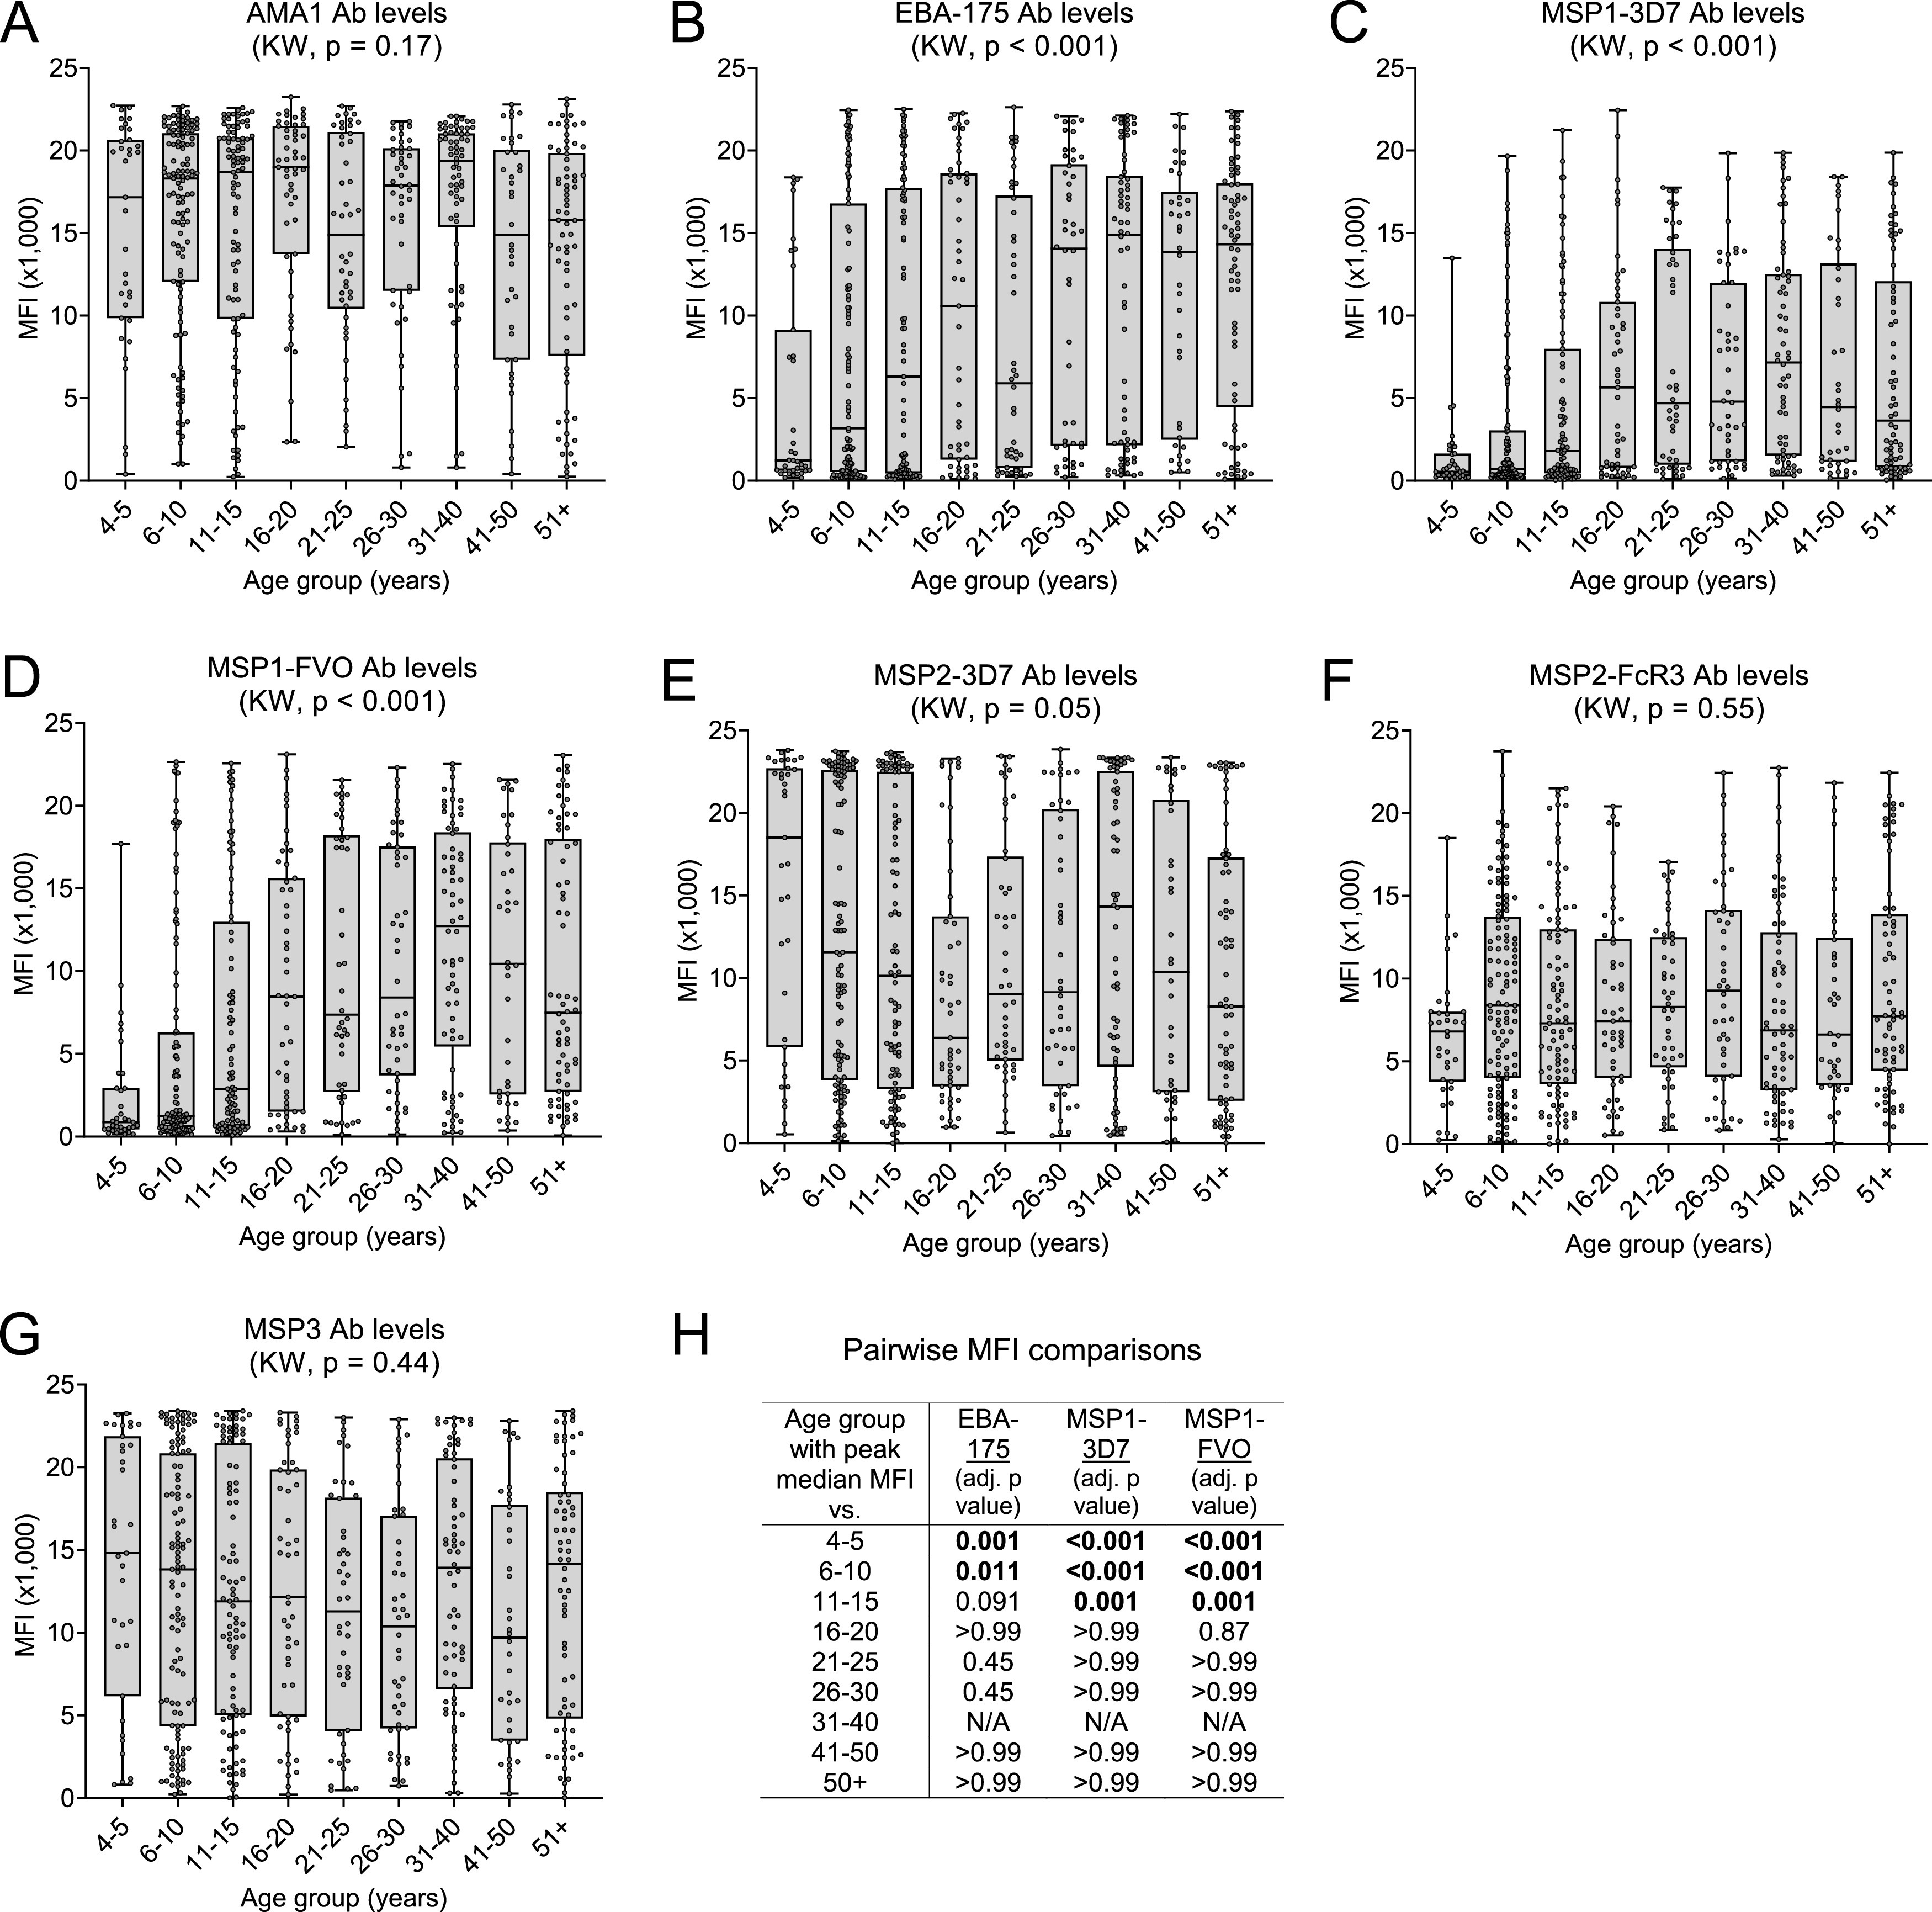
Change in Ab levels with increasing age. Ab levels (MFI) for each of the 566 individuals enrolled in the study were divided into 9 age groups. (A to G) Box plots represent the 25th, 50th, and 75th percentiles (horizontal lines of box) and minimum/maximum values (tip of whiskers) for each age group. Sample sizes are provided in Table 1. Median Ab levels were compared among all age groups using the Kruskal-Wallis (KW) test. (H) Pairwise MFI comparisons (Wilcoxon rank sum test) between the age group with observed peak median MFI (31 to 40 years) and other age groups for EBA-175 and MSP1-42 3D7 and FVO. The results, after Bonferroni adjustment of P values, indicate that the increase in Ab levels with age actually became maximal at 11 to 15 years for EBA-175 and 16 to 20 years for MSP1-42 (both alleles), and did not significantly change thereafter. NA, not applicable.
Changes in Ab avidity with age.
The proportion of high-avidity Ab (AI) and, thus, timing of affinity maturation differed among the antigens (Fig. 3). For AMA1, median AI fluctuated between 40% and 65% across the 9 age groups (KW, P = 0.012), with no specific trend or meaningful ordered differences (Fig. 3A). These results suggest that affinity maturation to AMA1 took place prior to 4 to 5 years of age and did not increase appreciably with subsequent exposure. In contrast, AI differed among the 9 age groups for EBA-175, MSP1-3D7, and MSP1-FVO (KW, P < 0.001 for each antigen), with median AI having an upward trend with age (Fig. 3B to D). Peak median AIs were observed at 26 to 30 years for EBA-175 (peak median AI = 73%) and at 31 to 40 years for both MSP1-3D7 (68%) and MSP1-FVO (78%) (Fig. 3B to D). However, the observed peak median AIs were only found to be significantly higher than the AIs of age groups <21 to 25 years for EBA-175 and <16 to 20 years for MSP1-42 (3D7 and FVO), indicating that AIs for EBA-175 and MSP1-42 increased from age 4 to 5 years until becoming stable around 21 to 25 years and 16 to 20 years of age, respectively (Fig. 3H). Unlike the above antigens, AIs for MSP2 were low (<30%) in most individuals (Fig. 3E and F). No change in AI was observed for MSP2-3D7 (Fig. 3E), but a slight increase was seen for the FcR3 strain, from median AIs of 11% in the 4- to 5-year-old group to a median AI of 20% at age 6 to 10 years, after which AIs did not change significantly (Fig. 3F). AIs to MSP3 were very low (median <10% for all age groups) and did not change with age (Fig. 3G). Taken together, the proportion and timing of production of high-avidity Ab is antigen-dependent, with maximal AI (after which there was no significant increase with age) attained for AMA-1 at ages 4 to 5 years, for EBA-175 at 21 to 25 years, and for MSP1-42 at 16 to 20 years. On the other hand, the AI for MSP2 FcR3 increased minimally until age 6 to 10 years, and there is little or no change in AI with age for MSP2-3D7 and MSP3.
FIG 3.
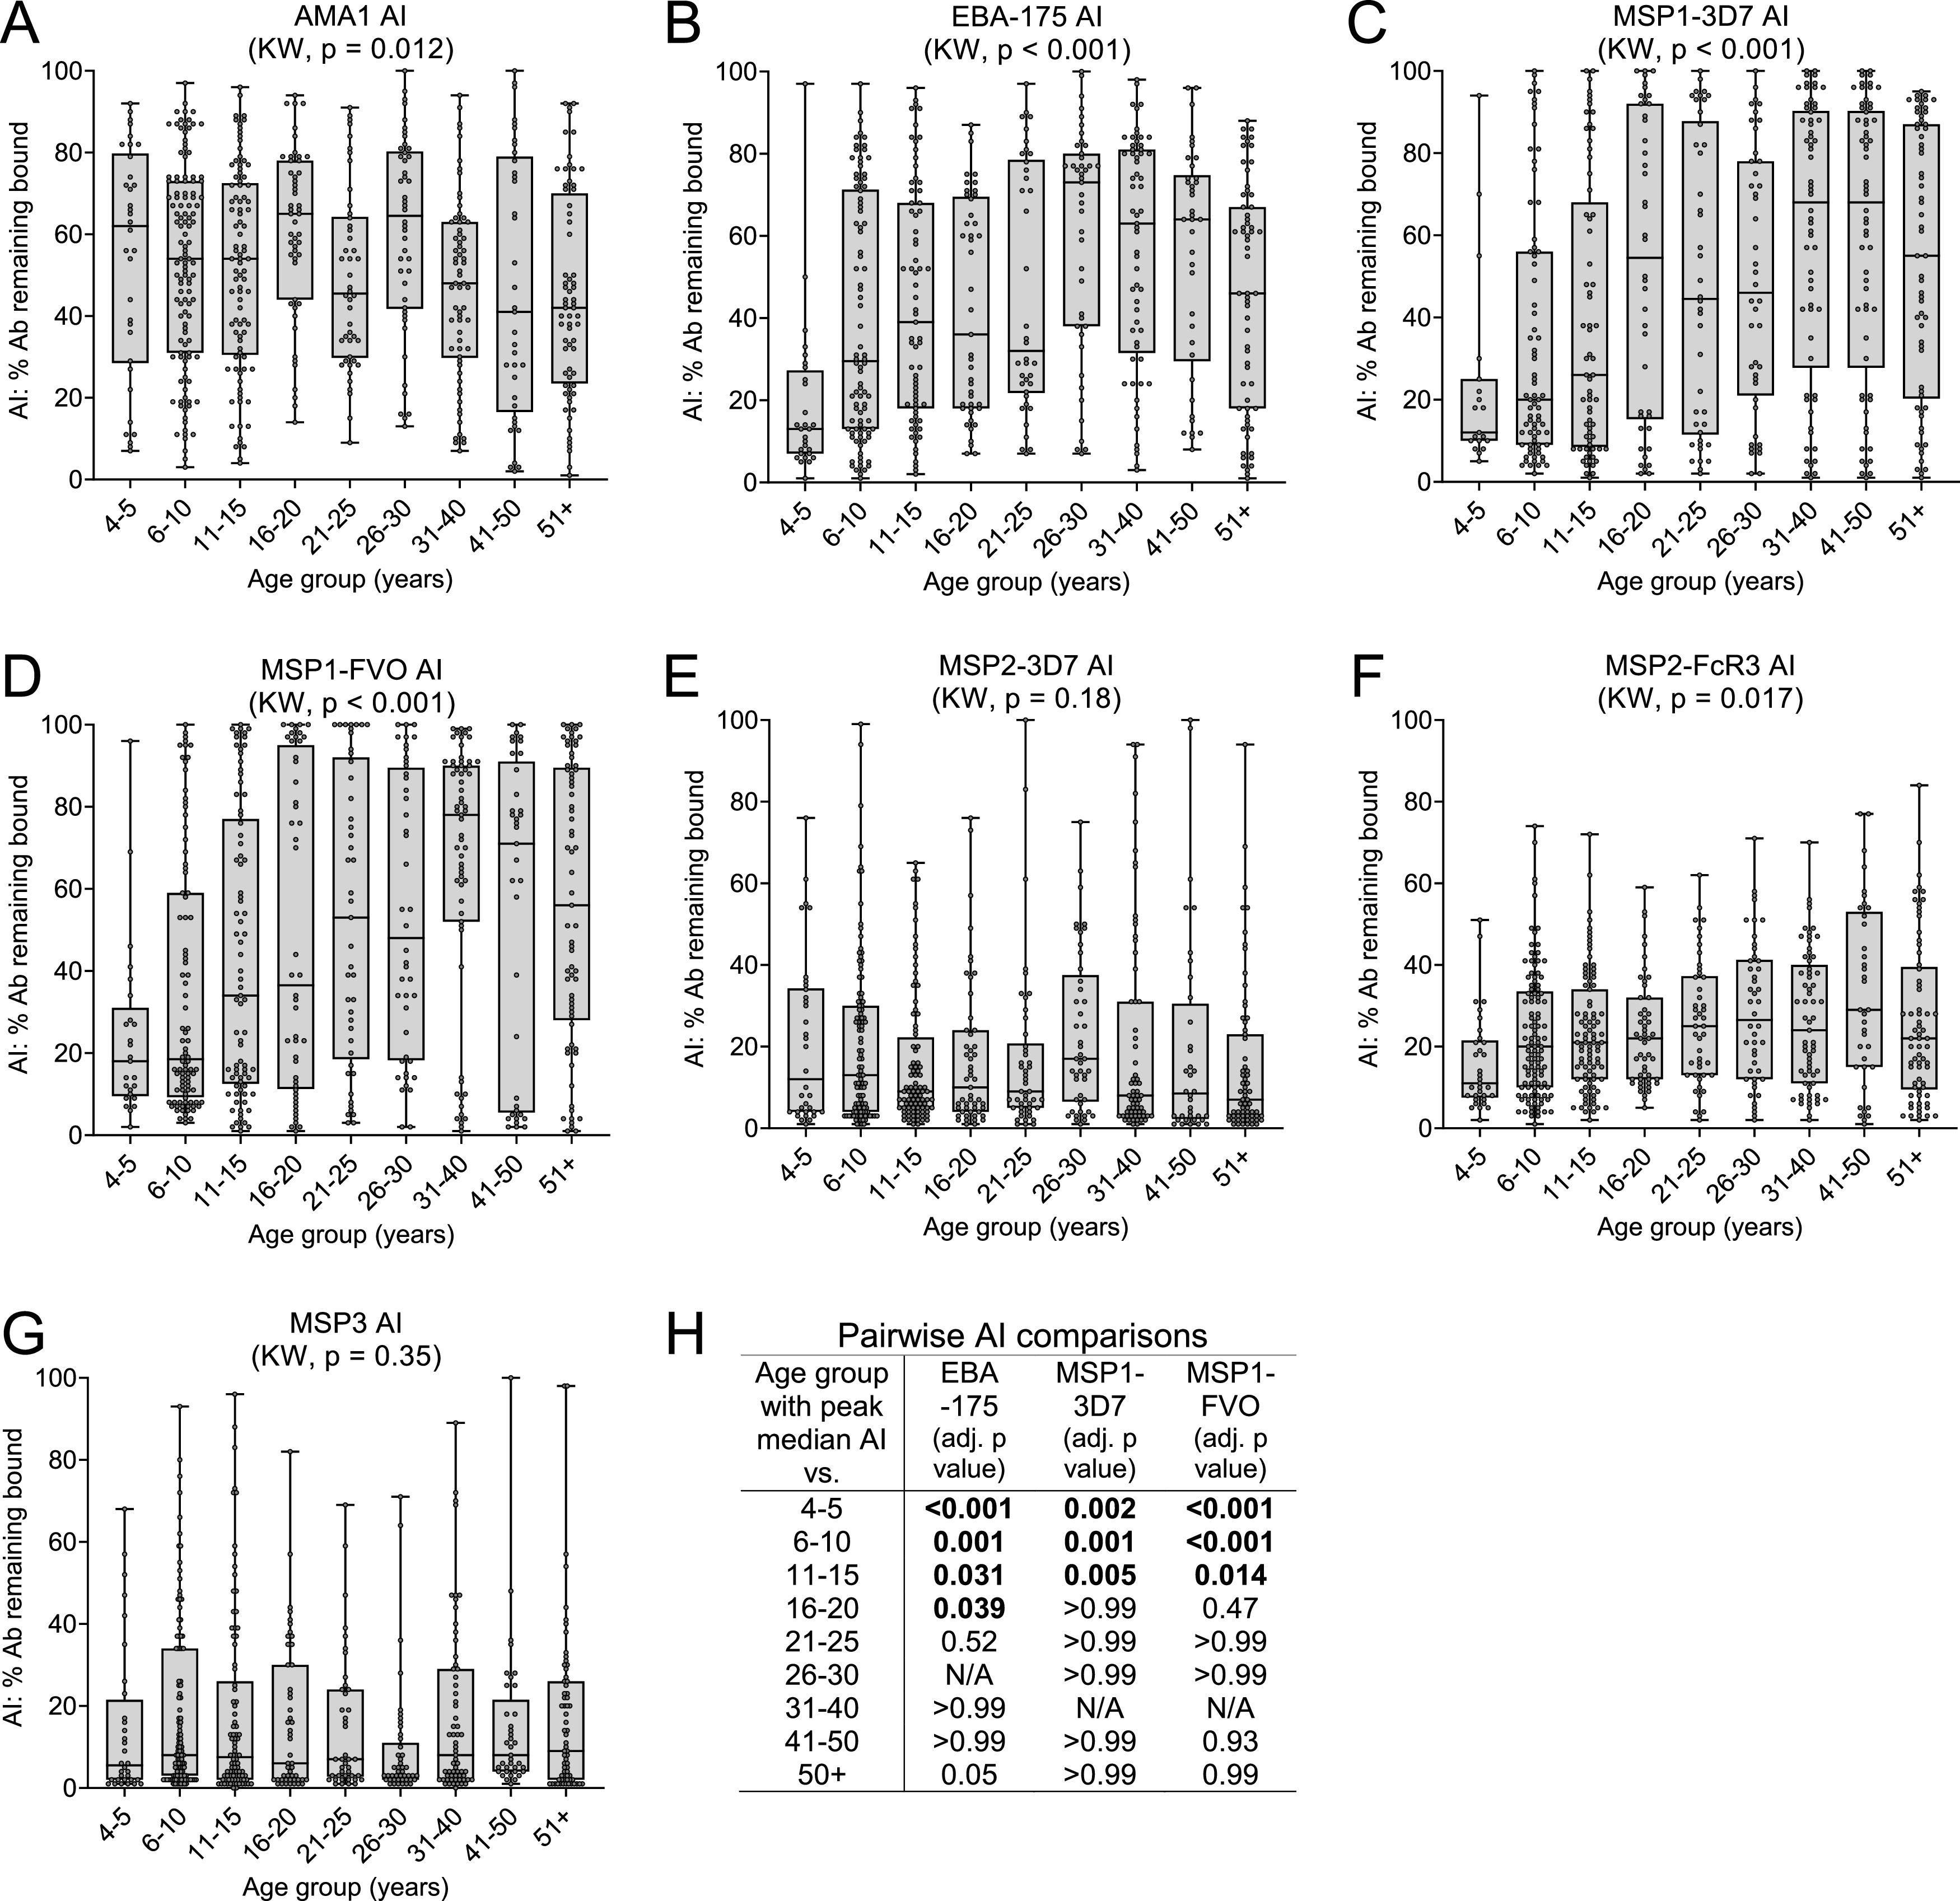
Change in avidity index (AI) with age. The AI (% Ab remaining bound after treatment with 2 M NH4SCN) was calculated for each individual who was Ab positive, i.e., with MFI value of ≥500 or >mean + 3SD of malaria-naive U.S. controls (whichever was higher). (A to G) Box plots represent the 25th, 50th, and 75th percentiles (horizontal lines of box) and minimum/maximum values (tip of whiskers) for each age group. Sample sizes are provided in Table 1. Median AI was compared among all age groups by way of the Kruskal-Wallis (KW) test. (H) Pairwise AI comparisons (for antigens with significant KW) between age groups with observed peak median AI (73% at 26 to 30 years for EBA-175, 68% at 31 to 40 years for MSP1 3D7, and 78% at 31 to 40 years for MSP1 FVO) and other ordered age groups. The P values were adjusted for multiple comparisons using the Bonferroni method. The results indicate that the increase in AI with age actually became maximal at 16 to 20 years and 21 to 25 years for MSP1-42 and EBA-175, respectively, and stable thereafter.
Comparison of AI for the allelic variants of MSP1-42 (3D7 and FVO) and MSP2 (3D7 and FcR3).
A strong linear relationship between MSP1-42 3D7 and FVO was found for both MFI (r = 0.891) and AI (r = 0.907) (Fig. S1A and B in the supplemental material). In contrast, although a moderate linear relationship of MFI values for MSP2 3D7 and FcR3 was found (r = 0.42), only a weak linear relationship was seen for AI for the two strains (r = 0.189) (Fig. S1D). Thus, almost identical results were obtained for the two strains of MSP1-42, but differences were seen between the two MSP2 strains.
The relationship between MFI and AI.
To determine if individuals who have high Ab levels also have high-avidity Ab, the relationship between MFI and AI was assessed. Because Ab levels and avidity were maximal by age 21 to 25 years, the relationship between MFI and AI was investigated among individuals aged 4 to 10, 11 to 20, 21 to 30, and all individuals >30 years (Fig. 4). Scatterplots of MFI versus AI showed an upward trend that was not completely linear, so Spearman analysis was used to determine the strength of the relationship, with strength being defined as weak (0.00 < |rs| < 0.40), moderate (0.40 < |rs| <0.70), or strong (0.70 < |rs| <1.0). Overall, the relationship between MFI and AI was positive (rs and 95% confidence interval [CI] lower limits > 0.000), but the strength varied among the antigens (Fig. 4). The strength between MFI and AI was moderate for AMA1, weak to moderate for EBA-175 and MSP1-42, and weak for MSP2 and MSP3. Results showed that age did not influence the relationship between MFI and AI for AMA1, MSP2, and MSP3, that is, Spearman values were similar for all age groups (Fig. 4). However, for MSP1-42 and, to a lesser extent, for EBA-175, the strength of the relationship between MFI and AI increased with age up to age group 21 to 30 years (Fig. 4). Interestingly, the relationship was weaker in the >30 years age group, where AI remained high but MFI declined (Fig. 4). The moderate relationship for AMA1 suggests that individuals with high Ab levels often had a high proportion of high-avidity Ab; whereas, the weak relationship for MSP2 and MSP3 show that individuals with high Ab levels to MSP2 and MSP3 rarely had high-avidity Ab. For MSP1, the relationship between high Ab levels and proportion of high-avidity Ab increased with age until age 30 years, after which AI remained high at relatively lower Ab levels.
FIG 4.

Spearman correlations (rs) and 95% confidence intervals between MFI and AI. Spearman rs coefficients with 95% confidence intervals (CIs) for the monotonic relationship between antibody levels expressed as median fluorescence intensity (MFI) and antibody avidity expressed as avidity index (AI) are represented for each antigen. The results are shown for antibody-positive individuals combined into larger age groups (4 to 10 years, 11 to 20 years, 21 to 30 years, and 31+ years) to reduce complexity and increase power of the correlation analysis. The strength of the monotonic relationship between MFI and AI was indicated as weak (0.000<|rs|<0.400), moderate (0.400<|rs|<0.700), or strong (0.700<|rs|<1.000).
Proportion of individuals with >50% high-avidity Ab.
The percentage of individuals who had 50% or more high-avidity Ab for the antigens, an index of a strong avidity response, is summarized in Fig. 5. In general, over half the population had strong avidity responses to AMA1 from age 4 to 5 years onward; whereas, the prevalence of strong avidity responses to EBA-175 and MSP1-42 (3D7 and FVO) increased with age. In contrast, less than 16% of the population acquired strong avidity responses to MSP2 (3D7 and FcR3) and MSP3. Thus, although the seroprevalence of Ab to all the merozoite antigens was high among individuals in Simbok (Table 2), affinity maturation occurred quickly to AMA1, increased with age for EBA-175 and MSP1, but did not occur appreciably for MSP2 and MSP3.
FIG 5.

The percentage of individuals with >50% high-avidity antibodies. The percentage of Ab-positive individuals with AI ≥50% was determined for each age group and for each antigen.
Comparison of AI to AMA1 at age 1 year and AI at adulthood.
Since the maturation of high Ab avidity to AMA1 appeared to occur early in life, plasma samples collected from infants at 12 months of age, after in utero-acquired maternal Abs had completely waned, were tested for Ab avidity to AMA1 (Fig. 6). Although these infants did not reside in Simbok, they lived in a village (Ngali II) from the same region of Cameroon with similar malaria transmission and entomological dynamics (21, 22). Infant plasma samples were screened at a dilution of 1:100 and plasma samples from 38 adults living in Ngali II were used at a 1:1,000 dilution to place Ab values for both groups on the linear region of the Ab-binding curve. In addition, the samples were incubated with 1.5 M NH4SCN (instead of 2 M), since this concentration was shown to provide a wider range of AI in young children (19). Although MFI values for infants and adults could not be directly compared because different plasma dilutions were used, AI comparisons were made since AI do not change with plasma dilution as long as the MFI are on the linear part of the Ab-binding curve (19). Overall, it is clear that at age 1 year, Ab avidity to AMA1 was significantly lower than that found in adults (P < 0.001) and the association between MFI and AI was relatively weak in infants (Fig. 6). Thus, the combined data (Fig. 3, Fig. 4, and Fig. 6) support the conclusion that avidity maturation to AMA1 takes place between the ages of 1 and 4 to 5 years. An overall summary of the above results is provided in Fig. 7 and discussed below.
FIG 6.

Comparison of antibody response to AMA1 between infants 12 months of age and adults. (A and B) Plasma samples from 38 adults and 55 infants living in Ngali II village with equally high malaria transmission as in Simbok village were compared for avidity index (AI) (A) and the monotonic relationship between MFI and AI for Ab-positive participants (B). The 38 adults were of reproductive age and consisted of 14 males, 9 nonpregnant females, and 15 pregnant women. Note that 1.5 M NH4SCN was used in this part of the study, since it provided a wider range of AI in infants (19). (A) Box plots represent the 25th, 50th, and 75th percentiles (horizontal lines of box) and minimum/maximum values (tip of whiskers). (B) Horizontal lines show the Spearman correlation coefficients (dot) and lower/upper limits of 95% confidence interval.
FIG 7.
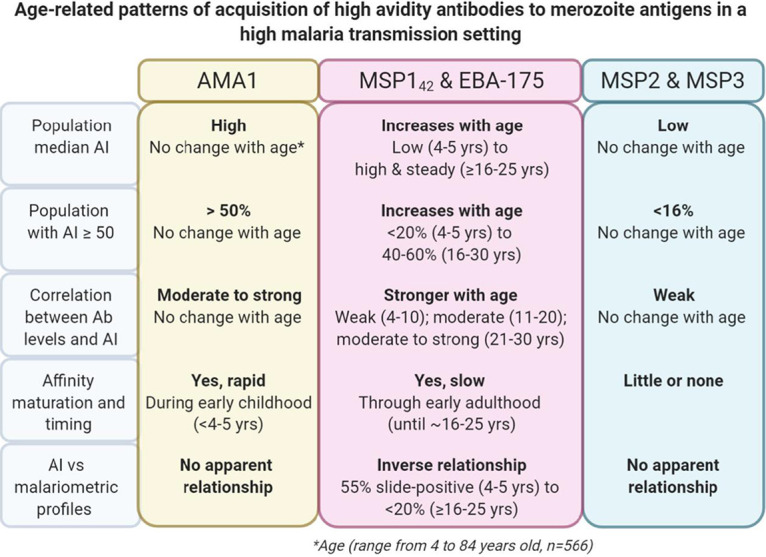
Summary of affinity maturation patterns for antibodies to P. falciparum merozoite antigens in an area of high malaria transmission intensity. The antibody avidity index (AI) to 5 merozoite antigens was measured for 566 individuals aged 4 to 84 years who lived in the rural village of Simbok, Cameroon, where they were exposed to infectious mosquito bites daily. In addition, AMA1 AI was measured in 38 adults and 55 1-year-old infants living in the nearby village of Ngali II with similar malaria transmission intensity. In general, three distinct AI-versus-age patterns were observed based on various parameters, including median AI, percentage of the population with ≥50% high-avidity antibodies, relationship between AI and antibody levels, and interplay with antiparasite immunity.
DISCUSSION
In 1996 to 1998, Simbok was a typical rural village where residents were exposed daily to P. falciparum-infected mosquitoes (20). Among the 566 individuals studied, all children between the ages of 4 to 10 were infected with malaria, with 55% being slide-positive and the remainder having submicroscopic infections (Table 1 and Fig. 1). Immunity was acquired with increasing age, as demonstrated by a decline in malaria prevalence, parasite burden, and anemia (Table 1). By adulthood, sufficient immunity had been achieved to either eliminate or reduce parasitemia to very low levels. Thus, malaria became a chronic, asymptomatic infection after a specific level of immunity was acquired. Since avidity, or functional affinity, is a measure of Ab quality, the question was, did Ab avidity to merozoite antigens increase with age in this setting?
In high malaria transmission areas where individuals were repeatedly infected, at least four studies reported absence of affinity maturation (5–7, 9). For example, no association between Ab avidity to AMA1 or MSP2 and age was found in 152 Gambian children <3.3 years of age living in an area with seasonal transmission (9), and no increase in Ab avidity to AMA-1, MSP1-42, or MSP3 was found in 1- to 13-year-old Kenyan children with asymptomatic malaria (5). Furthermore, no increase with age in Ab AI to AMA1 and MSP1-19 was reported in individuals over a wide age range in malaria-endemic areas with different transmission conditions in Uganda (6), and young individuals (5 to 15 years) produced comparable or higher avidity Ab to EBA-175 than adults of >15 years in Nigeria (7). In high transmission areas, it is possible that maximal affinity maturation was achieved after only the first few infections. Alternatively, since it takes many years to achieve significant antiparasite immunity, Ab avidity to some antigens might continue to increase with age until maximal immunity was achieved.
Affinity maturation is a complex process, where somatically hypermutated centrocytes (i.e., light zone germinal center B cells) capture antigens on follicular dendritic cells (FDC), undergo cognate interaction with T-follicular helper (TFH) cells, and differentiate into Ab-producing plasma cells (10). Competition for a limiting amount of antigen displayed on FDC as immune complexes is an important step in affinity maturation, where centrocytes with high-affinity BCR outcompete centrocytes with lower-affinity BCR (i.e., centrocyte-centrocyte competition) and high-affinity BCR-antigen interactions overcome lower-affinity antibody-antigen interactions in immune complexes (centrocyte-antibody competition), resulting in antigen capture by the centrocyte (11, 12). Therefore, high-affinity centrocytes that outcompete other centrocytes and Ab for antigen are spared from apoptosis, are better at presenting antigen to TFH cells, and preferentially receive help signals to become high-affinity Ab-producing plasma cells. With abundant antigen, competition is compromised, leading to coselection of lower-affinity centrocytes and slower affinity maturation. Results from the current study are summarized in Fig. 7 and reveal three patterns of affinity maturation, represented by AMA1, for which high levels of avid Ab were quickly produced at a young age, EBA-175 and MSP1-42, for which Ab levels and avidity gradually increased until adulthood, and MSP2 and MSP3, for which affinity maturation did not occur in most individuals. All of the antigens are present in P. falciparum merozoites. Following schizont rupture, the merozoite surface antigens (MSPs) participate in initial attachment of merozoites to erythrocytes; then, erythrocyte-binding antigen EBA-175 aids in binding and induces release of proteins localized in the micronemes, including AMA that participates in junction formation (23). Thus, B cells would be exposed to all of the antigens simultaneously and repeatedly, but appear to induce different responses during the affinity maturation process (Fig. 7).
(i) Pattern 1: AMA-1. In this high transmission setting, 84% of 1-year-old children had Abs to AMA1 (Fig. 6) and 4- to 5-year-old children had Ab levels and AIs equivalent to those found in adults (Fig. 2, Fig. 3, and Table 2). Previously, a significant increase in Ab levels to AMA1 was reported in febrile Ugandan children between the ages of 0.5 and 3 years (4), indicating that a rapid response to AMA1 can occur at a young age. Immunization of Malian children 1 to 6 years of age with an AMA1 vaccine did not boost avidity (24), perhaps because the maximal response had already been achieved by natural infection. Like the current study, several studies have reported that Ab avidity to AMA1 does not increase with age (5, 6, 9). In these studies, the failure to find an increase might be due, in part, to the age of the participants, since the mean age of the Kenyan subjects was 6.2 ± 2.4 years, Gambian children was 4.0 to 4.3 ± 1.5 years, and Ugandan 1- to 4-year-old children already had high median AI of 0.43 to >0.5 (5, 6, 9). In the current study, AMA1 induced a strong humoral response resulting in most individuals having (i) high Ab levels (Fig. 2), (ii) >50% high-avidity Ab (Fig. 3 and 5), and (iii) a moderate MFI:AI relationship (i.e., had both high levels and affinity Abs). Therefore, a mature Ab response to AMA1 occurred prior to the appearance of protective immunity (Fig. 1).
(ii) Pattern 2: EBA-175 and MSP1-42. Ab avidity to EBA-175 and MSP1-42 gradually increased into early adulthood at around 16 to 25 years of age (Fig. 3), at which time many individuals were able to significantly reduce or clear their parasitemia (Fig. 1 and Table 1). A positive association between Ab levels (MFI) and AI would be expected during the process of affinity maturation, with the strength of the association increasing with more rounds of clonal selection (Fig. 4). Thereafter, AI may remain stable, but Ab levels might fluctuate or decline after parasite clearance. This trend is reflected for EBA-175 and, particularly, for MSP1-42 (Fig. 3 and Fig. 4). EBA-175, which binds to glycophorin A on the erythrocyte surface, is polymorphic and has an N-terminal Duffy binding-like domain that shares conserved structures with EBA-140 and EBA-181 (23). It is unclear how genetic diversity and shared epitopes with other antigens influence the gradual maturation of the Ab response to EBA-175. As expected, the response to the 3D7 and FVO strains of MSP1-42 were very similar (Fig. S1), since the MSP1-19 region of the antigen has minimal sequence variation and most MSP1-42 Abs are directed to this region. The MSP1-19 sequence has 2 EGH-like domains, D1 and D2 (25, 26). In future studies, it will be interesting to determine if Ab avidity increases with age to all sequences or to only a specific region or domain within MSP1-19. The gradual increase in Ab avidity to EBA-175 and MSP1-42 with age, which parallels the decline in malaria slide-positivity and parasitemia, demonstrates that fine-tuning of the humoral response to these merozoite antigens can occur. These data suggest that a vaccine that “speeds up” the process might be beneficial.
(iii) Pattern 3: MSP2 and MSP3. At 4 to 5 years of age, >90% of children in this study had Ab to MSP2 and MSP3 (Table 2), with adult levels of Ab to these antigens (Fig. 2). However, in contrast to AMA1, AI were low with median AI remaining at <30% (Fig. 3). Consequently, little or no relationship between MFI and AI was detected for MSP2 and MSP3 (rs and 95% CI mostly <0.400, Fig. 4). Overall, less than 16% of the population had >50% high-avidity Ab to MSP2 and MSP3 (Fig. 5), showing that affinity maturation could occur, but only in a few individuals. Thus, the question becomes why didn’t the majority of individuals living in this high-transmission area produce high-avidity Ab to these antigens? Several reasons may explain low AI to MSP2. First, the concentration of these antigens may not drop low enough in individuals with submicroscopic infections (Table 1) to support affinity maturation. Second, a low concentration of MSP2 does not seem to be the answer, since the antigens MSP2 and MSP1 constitute about two-thirds of the proteins expressed on the surface of merozoites (27). Like other MSP antigens, MSP2 is dimorphic with two main allelic groups, i.e., the 3D7 and FcR27 groups, that have ∼95% amino acid sequence homology within the group, but only 64% homology between the two groups (28). The antigenic difference between the two dimorphic forms is apparent in Fig. 2 (E and F) with differences in Ab levels between the 3D7 and FcR3 variants, as well as in Fig. S1, with the low linear relationship (r value) of Ab levels between the two variants. In addition to polymorphism, MSP2 is reported to be a highly unstructured molecule that contains degenerate repetitive sequences that could hinder affinity maturation (29, 30). The situation with MSP3 is less clear, especially since its C-terminal domain is conserved across P. falciparum isolates (31). It is tempting to speculate that high-avidity MSP3-specific centrocytes are either few in number, fail to compete for antigen, or are inefficient in presenting antigen to TFH cells and simply undergo apoptosis.
In summary, results from this study suggest that in areas with high malaria transmission, affinity maturation can occur rapidly early in life, increase gradually during childhood and adolescence until early adulthood, or potentially not happen at all, depending on the antigen. The current results may help provide a broader context for understanding results from previous studies. The current study was able to identify three patterns of affinity maturation for merozoite antigens in Simbok residents because of the following: (i) 7 recombinant proteins (5 antigens and 2 variants) were used; (ii) a relatively large sample size (n = 566); (iii) a wide age range (4 to 84 years); and (iv) a well-defined rate of malaria transmission. Results from earlier studies tended to include only one or a few antigens and/or a limited age range that resulted in identifying only one pattern, e.g., no increase in Ab avidity with age, based on the conditions under which the study was conducted. It is hoped that additional studies, using other P. falciparum antigens, will begin to provide a clearer picture about the production of high-avidity Ab following natural infections and the impact of the high-avidity responses on the acquisition of antimalarial immunity.
MATERIALS AND METHODS
Study population and ethics statement.
A cross-sectional prevalence study was conducted in the rural village of Simbok, Cameroon between November 1996 and July 1998 (20). This initial study was approved by the Ethics Committee of Cameroon, the Georgetown University Institutional Review Board (115-94), and was covered by single project assurance number S-9601-01 (NIH). The use of deidentified samples in the current study was considered exempt by the IRB, University of Hawaii (CHS number 23249). Malariometric relevant data, including age of participants, have been reported previously (20). Slide-positive individuals were referred to the local health center for antimalarial treatment according to governmental guidelines. Plasma samples and parasitology data (based on thick and thin peripheral blood smears) from 566 individuals were available for analysis.
PCR detection of P. falciparum.
A total of 150 archival, cryopreserved red blood cell pellets from the study subjects were randomly selected and screened by PCR using primers for the P. falciparum 18S rRNA gene and mitochondrial cytochrome c oxidase III (Cox3) gene (ultrasensitive PCR). A detailed description of the protocol has been published (32). A positive control, consisting of DNA isolated from laboratory-cultured P. falciparum of the 3D7 strain, was diluted 5-fold from 3.7 to 4 × 10⁻⁷ ng/μl of parasite DNA and included in the assay. Blood collected from malaria-naive individuals and PCR-grade water were used for negative controls.
Determination of anemia.
Anemia was assessed by determining the packed cell volume (PCV, %) and hemoglobin concentration (g/dl) of blood samples. Anemia was defined using age-appropriate cutoffs of hemoglobin levels, i.e., <11.0 g/dl in <5 years of age, <11.5 g/dl in 5 to <12 years of age, and <12 g/dl in ≥12 years of age (33).
Antigens.
The recombinant antigens used in the study have been described previously (34, 35) and included MSP1-42 (3D7 and FVO), MSP2 (3D7 and FcR3), MSP3, EBA-175, and AMA1.
The avidity multiplex immunoassay.
Details of the avidity MIA have been described recently (19). In brief, SeroMap beads (Luminex) with different spectral addresses were covalently coupled with saturating (optimal) amounts of each of the recombinant proteins. The beads were pooled to create a 7-plex, such that 50 μl of the mix contained 2,000 beads of each antigen. The 7-plex was compared with each individual antigen as a monoplex and no competition was found (34). The 566 plasma samples were diluted 1:300 and 50 μl of diluted plasma was incubated with 50 μl of the 7-plex in duplicate for 60 min at room temperature on a rotary shaker. Beads were washed twice with phosphate-buffered saline (PBS), once with PBS-1% bovine serum albumin (BSA), and resuspended in 50 μl PBS. Then, 50 μl of PBS was added to one well (no salt) and 50 μl of 2 M NH4SCN was added to the other well for 30 min at room temperature. After washing, the beads were incubated with 100 μl of secondary Ab (R-phycoerythrin-conjugated, AffiniPure F(ab′)2 fragment goat anti-human IgG Fc fragment specific, Jackson ImmunoResearch, West Grove, PA) diluted to 2 μg/ml in PBS-1% BSA on a rotary shaker for 1 h. Beads were washed, resuspended in 100 μl PBS-1% BSA, and the microsphere suspension was analyzed using a Liquichip M100 reader (Qiagen, Valencia, CA). The reader was programmed to read a minimum of 100 beads per spectral address, DD Gate 7500 to 15000. On each plate, a positive control (PC) consisting of a pool of plasma samples from Cameroonian adults with high Ab levels and a negative control (NC) consisting of a pool of malaria-naive plasma samples were included. In addition, plasma samples from 59 adults residing in the USA were individually screened against the antigens in order to establish the cutoff for Ab-positivity for each antigen. Results were expressed as median fluorescence intensity (MFI). MFI from wells not treated with the chaotropic salt provided information on the Ab level in each sample. The avidity index (AI), i.e., the percentage of Abs that remained bound following treatment with 2 M NH4SCN, was calculated as follows: ([MFI beads with salt]/[MFI beads with no salt]) ×100. Individuals with MFI values greater than the mean + 3× the standard deviation (SD) for the 59 U.S. negative controls were considered Ab-positive. All Ab-positive samples with MFI values >500 were used in the avidity assay. The cutoff for Ab avidity ensured that all samples were on the linear part of the Ab-binding curve (19).
Statistical analysis.
Antibody levels (MFI) and AI were described using medians and interquartile ranges. Medians were compared among nine age-stratified groups using the Kruskal-Wallis test (KW). When KW was significant (P < 0.05), pairwise comparisons were made between the age group with the apparent highest median and medians of the preceding age groups using the Wilcoxon rank sum test with Bonferroni adjustment for P values. In addition to changes in median AI, affinity maturation was also assessed by the proportion of individuals in each age group with AI ≥ 50 and by the strength of the association between MFI and AI. The Spearman’s rank correlation coefficient (rs) and 95% confidence intervals (CIs) were used to assess the monotonic relationship between MFI and AI.
ACKNOWLEDGMENTS
We acknowledge the entire staff at the Biotechnology Center, University of Yaoundé I, for their excellent technical support in conducting the field and laboratory studies. We are grateful to colleagues who provided the recombinant proteins: C. Long, Malaria Development Branch, NIAID, NIH for AMA-1 (3D7) and MSP1-42 (3D7); Science Applications International Corp., Frederick, MD for EBA-175; R. Anders, La Trobe University, Victoria, Australia for MSP2; and J. Rayner, Wellcome Trust Sanger Institute, for MSP3 (HB3). We thank Alexander Kayatani for his support in assay development and useful discussions. We also thank John J. Chen of the Department of Quantitative Health Sciences, John A. Burns School of Medicine, University of Hawaii at Manoa for his support in reviewing statistics.
The study was funded by grants from the NIAID, NIH: UOI AI 35839 for acquisition of the clinical data and plasma samples and 1R21 AI 105286 for laboratory support. S.T.Y. was supported by training grant D43TW009074 from the Fogarty International Center. M.M. was partially supported by the U54MD007601 (Ola HAWAII) grant from the National Institutes of Health (NIH).
Contributor Information
Diane Wallace Taylor, Email: dwtaylordw@hawaii.edu.
De'Broski R. Herbert, University of Pennsylvania
REFERENCES
- 1.Hedman K, Lappalainen M, Soderlund M, Hedman L. 1993. Avidity of IgG in serodiagnosis of infectious diseases. Rev Med Microbiol 4:123–129. 10.1097/00013542-199307000-00001. [DOI] [Google Scholar]
- 2.Ferreira MU, Kimura EA, De Souza JM, Katzin AM. 1996. The isotype composition and avidity of naturally acquired anti-Plasmodium falcipaurm antibodies: differential Patterns in Clinically Immune Africans and Amazonian Patients. Am J Trop Med Hyg 55:315–323. 10.4269/ajtmh.1996.55.315. [DOI] [PubMed] [Google Scholar]
- 3.Leoratti FMS, Durlacher RR, Lacerda MVG, Alecrim MG, Ferreira AW, Sanchez MCA, Moraes SL. 2008. Pattern of humoral immune response to Plasmodium falciparum blood stages in individuals presenting different clinical expressions of malaria. Malar J 7:186. 10.1186/1475-2875-7-186. [DOI] [PMC free article] [PubMed] [Google Scholar]
- 4.Reddy SB, Anders RF, Beeson JG, Farnert A, Kironde F, Berenzon SK, Wahlgren M, Linse S, Persson KEM. 2012. High affinity antibodies to Plasmodium falciparum merozoite antigens are associated with protection from malaria. PLoS One 7:e32242. 10.1371/journal.pone.0032242. [DOI] [PMC free article] [PubMed] [Google Scholar]
- 5.Ibison F, Olotu A, Muema DM, Mwacharo J, Ohuma E, Kimani D, Marsh K, Bejon P, Ndungu FM. 2012. Lack of avidity maturation of merozoite antigen-specific antibodies with increasing exposure to Plasmodium falciparum amongst children and adults exposed to endemic malaria in Kenya. PLoS One 7:e52939. 10.1371/journal.pone.0052939. [DOI] [PMC free article] [PubMed] [Google Scholar]
- 6.Ssewanyana I, Arinaitwe E, Nankabirwa JI, Yeka A, Sullivan R, Kamya MR, Rosenthal PJ, Dorsey G, Mayanja-Kizza H, Drakeley C, Greenhouse B, Tetteh KKA. 2017. Avidity of anti-malarial antibodies inversely related to transmission intensity at three sites in Uganda. Malar J 16:1–8. 10.1186/s12936-017-1721-3. [DOI] [PMC free article] [PubMed] [Google Scholar]
- 7.Tijani MK, Reddy SB, Langer C, Beeson JG, Wahlgren M, Nwuba RI, Persson KEM. 2018. Factors influencing the induction of high affinity antibodies to Plasmodium falciparum merozoite antigens and how affinity changes over time. Sci Rep 8–:12. 10.1038/s41598-018-27361-w. [DOI] [PMC free article] [PubMed] [Google Scholar]
- 8.Abagna HB, Acquah FK, Okonu R, Aryee NA, Theisen M, Amoah LE. 2018. Assessment of the quality and quantity of naturally induced antibody responses to EBA175RIII-V in Ghanaian children living in two communities with varying malaria transmission patterns. Malar J 17:1–11. 10.1186/s12936-017-2167-3. [DOI] [PMC free article] [PubMed] [Google Scholar]
- 9.Akpogheneta OJ, Dunyo S, Pinder M, Conway DJ. 2010. Boosting antibody responses to Plasmodium falciparum merozoite antigens in children with highly seasonal exposure to infection. Parasite Immunol 32:296–304. 10.1111/j.1365-3024.2009.01193.x. [DOI] [PMC free article] [PubMed] [Google Scholar]
- 10.Gatto D, Brink R. 2010. The germinal center reaction. J Allergy Clin Immunol 126:898–907. 10.1016/j.jaci.2010.09.007. [DOI] [PubMed] [Google Scholar]
- 11.Zhang Y, Garcia-Ibanez L, Toellner KM. 2016. Regulation of germinal center B-cell differentiation. Immunol Rev 270:8–19. 10.1111/imr.12396. [DOI] [PMC free article] [PubMed] [Google Scholar]
- 12.Garg AK, Desikan R, Dixit NM. 2019. Preferential presentation of high-affinity immune complexes in germinal centers can explain how passive immunization improves the humoral response. Cell Rep 29:3946–3957.e5. 10.1016/j.celrep.2019.11.030. [DOI] [PMC free article] [PubMed] [Google Scholar]
- 13.Dennison SM, Reichartz M, Seaton KE, Dutta S, Wille-Reece U, Hill AVS, Ewer KJ, Rountree W, Sarzotti-Kelsoe M, Ozaki DA, Alam SM, Tomaras GD. 2018. Qualified biolayer interferometry avidity measurements distinguish the heterogeneity of antibody interactions with Plasmodium falciparum circumsporozoite protein antigens. J Immunol 201:1315–1326. 10.4049/jimmunol.1800323. [DOI] [PMC free article] [PubMed] [Google Scholar]
- 14.Wipasa J, Suphavilai C, Okell LC, Cook J, Corran PH, Thaikla K, Liewsaree W, Riley EM, Hafalla JCR. 2010. Long-lived antibody and B cell memory responses to the human malaria parasites, Plasmodium falciparum and Plasmodium vivax. PLoS Pathog 6:e1000770. 10.1371/journal.ppat.1000770. [DOI] [PMC free article] [PubMed] [Google Scholar]
- 15.Zakeri S, Babaeekhou L, Mehrizi AA, Abbasi M, Djadid ND. 2011. Antibody responses and avidity of naturally acquired anti-Plasmodium vivax Duffy binding protein (PvDBP) antibodies in individuals from an area with unstable malaria transmission. Am J Trop Med Hyg 84:944–950. 10.4269/ajtmh.2011.11-0001. [DOI] [PMC free article] [PubMed] [Google Scholar]
- 16.Mehrizi AA, Zakeri S, Salmanian AH, Sanati MH, Djadid ND. 2009. IgG subclasses pattern and high-avidity antibody to the C-terminal region of merozoite surface protein 1 of Plasmodium vivax in an unstable hypoendemic region in Iran. Acta Trop 112:1–7. 10.1016/j.actatropica.2009.05.016. [DOI] [PubMed] [Google Scholar]
- 17.Tutterrow YL, Salanti A, Avril M, Smith JD, Pagano IS, Ako S, Fogako J, Leke RGF, Taylor DW. 2012. High avidity antibodies to full-length VAR2CSA correlate with absence of placental malaria. PLoS One 7:e40049. 10.1371/journal.pone.0040049. [DOI] [PMC free article] [PubMed] [Google Scholar]
- 18.Babakhanyan A, Fang R, Wey A, Salanti A, Sama G, Efundem C, Leke RJI, Chen JJ, Leke RGF, Taylor DW. 2015. Comparison of the specificity of antibodies to VAR2CSA in Cameroonian multigravidae with and without placental malaria: a retrospective case-control study. Malar J 14:480. 10.1186/s12936-015-1023-6. [DOI] [PMC free article] [PubMed] [Google Scholar]
- 19.Taylor DW, Bobbili N, Kayatani A, Tassi Yunga S, Kidima W, Leke RFG. 2020. Measuring antibody avidity to Plasmodium falciparum merozoite antigens using a multiplex immunoassay approach. Malar J 19:171. 10.1186/s12936-020-03243-3. [DOI] [PMC free article] [PubMed] [Google Scholar]
- 20.Quakyi IA, Leke RGF, Befidi-Mengue R, Tsafack M, Bomba-Nkolo D, Manga L, Tchinda V, Njeungue E, Kouontchou S, Fogako J, Nyonglema P, Harun LT, Djokam R, Sama G, Eno A, Megnekou R, Metenou S, Ndoutse L, Same-Ekobo A, Alake G, Meli J, Ngu J, Tietche F, Lohoue J, Mvondo JL, Wansi E, Leke R, Folefack A, Bigoga J, Bomba-Nkolo C, Titanji V, Walker-Abbey A, Hickey MA, Johnson AH, Taylor DW. 2000. The epidemiology of Plasmodium falciparum malaria in two Cameroonian villages: Simbok and Etoa. Am J Trop Med Hyg 63:222–230. 10.4269/ajtmh.2000.63.222. [DOI] [PubMed] [Google Scholar]
- 21.Leke RFG, Bioga JD, Zhou J, Fouda GG, Leke RJI, Tchinda V, Megnekou R, Fogako J, Sama G, Gwanmesia P, Bomback G, Nama C, Diouf A, Bobbili N, Taylor DW. 2010. Longitudinal studies of Plasmodium falciparum malaria in pregnant women living in a rural Cameroonian village with high perennial transmission. Am J Trop Med Hyg 83:996–1004. 10.4269/ajtmh.2010.10-0249. [DOI] [PMC free article] [PubMed] [Google Scholar]
- 22.Tassi Yunga S, Fouda GG, Sama G, Ngu JB, Leke RGF, Taylor DW. 2018. Increased susceptibility to Plasmodium falciparum in infants is associated with low, not high, placental malaria parasitemia. Sci Rep 8:169. 10.1038/s41598-017-18574-6. [DOI] [PMC free article] [PubMed] [Google Scholar]
- 23.Beeson JG, Drew DR, Boyle MJ, Feng G, Fowkes FJI, Richards JS. 2016. Merozoite surface proteins in red blood cell invasion, immunity and vaccines against malaria. FEMS Microbiol Rev 40:343–372. 10.1093/femsre/fuw001. [DOI] [PMC free article] [PubMed] [Google Scholar]
- 24.Berry AA, Gottlieb ER, Kouriba B, Diarra I, Thera MA, Dutta S, Coulibaly D, Ouattara A, Niangaly A, Kone AK, Traore K, Tolo Y, Mishcherkin V, Soisson L, Diggs CL, Blackwelder WC, Laurens MB, Sztein MB, Doumbo OK, Plowe CV, Lyke KE. 2019. Immunoglobulin G subclass and antibody avidity responses in Malian children immunized with Plasmodium falciparum apical membrane antigen 1 vaccine candidate FMP2.1/AS02 A. Malar J 18:13. 10.1186/s12936-019-2637-x. [DOI] [PMC free article] [PubMed] [Google Scholar]
- 25.Blackman MJ, Ling IT, Nicholls SC, Holder AA. 1991. Proteolytic processing of the Plasmodium falciparum merozoite surface protein-1 produces a membrane-bound fragment containing two epidermal growth factor-like domains. Mol Biochem Parasitol 49:29–33. 10.1016/0166-6851(91)90127-R. [DOI] [PubMed] [Google Scholar]
- 26.Egan AF, Chappel JA, Burghaus PA, Morris JS, McBride JS, Holder AA, Kaslow DC, Riley EM. 1995. Serum antibodies from malaria-exposed people recognize conserved epitopes formed by the two epidermal growth factor motifs of MSP119, the carboxy- terminal fragment of the major merozoite surface protein of Plasmodium falciparum. Infect Immun 63:456–466. 10.1128/IAI.63.2.456-466.1995. [DOI] [PMC free article] [PubMed] [Google Scholar]
- 27.Gilson PR, Nebl T, Vukcevic D, Moritz RL, Sargeant T, Speed TP, Schofield L, Crabb BS. 2006. Identification and stoichiometry of glycosylphosphatidylinositol-anchored membrane proteins of the human malaria parasite Plasmodium falciparum. Mol Cell Proteomics 5:1286–1299. 10.1074/mcp.M600035-MCP200. [DOI] [PubMed] [Google Scholar]
- 28.Fenton B, Clark JT, Khan CM, Robinson JV, Walliker D, Ridley R, Scaife JG, McBride JS. 1991. Structural and antigenic polymorphism of the 35- to 48-kilodalton merozoite surface antigen (MSA-2) of the malaria parasite Plasmodium falciparum. Mol Cell Biol 11:963–971. 10.1128/mcb.11.2.963. [DOI] [PMC free article] [PubMed] [Google Scholar]
- 29.Zhang X, Perugini MA, Yao S, Adda CG, Murphy VJ, Low A, Anders RF, Norton RS. 2008. Solution conformation, backbone dynamics and lipid interactions of the intrinsically unstructured malaria surface protein MSP2. J Mol Biol 379:105–121. 10.1016/j.jmb.2008.03.039. [DOI] [PMC free article] [PubMed] [Google Scholar]
- 30.Anders RF. 1986. Multiple cross‐reactivities amongst antigens of Plasmodium falciparum impair the development of protective immunity against malaria. Parasite Immunol 8:529–539. 10.1111/j.1365-3024.1986.tb00867.x. [DOI] [PubMed] [Google Scholar]
- 31.Oeuvray C, Bouharoun-Tayoun H, Gras-Masse H, Bottius E, Kaidoh T, Aikawa M, Filgueira M, Tartar A, Druilhe P. 1994. Merozoite surface protein-3: a malaria protein inducing antibodies that promote Plasmodium falciparum killing by cooperation with blood monocytes. Blood 84:1594–1602. 10.1182/blood.V84.5.1594.bloodjournal8451594. [DOI] [PubMed] [Google Scholar]
- 32.Lloyd YM, Esemu LF, Antallan J, Thomas B, Tassi Yunga S, Obase B, Christine N, Leke RGF, Culleton R, Mfuh KO, Nerurkar VR, Taylor DW. 2018. PCR-based detection of Plasmodium falciparum in saliva using mitochondrial cox3 and varATS primers. Trop Med Health 46:22. 10.1186/s41182-018-0100-2. [DOI] [PMC free article] [PubMed] [Google Scholar]
- 33.World Health Organization. 2011. Haemoglobin concentrations for the diagnosis of anaemia and assessment of severity. World Health Organization, Geneva, Switzerland. [Google Scholar]
- 34.Fouda GG, Leke RFG, Long C, Druilhe P, Zhou A, Taylor DW, Johnson AH. 2006. Multiplex assay for simultaneous measurement of antibodies to multiple Plasmodium falciparum antigens. Clin Vaccine Immunol 13:1307–1313. 10.1128/CVI.00183-06. [DOI] [PMC free article] [PubMed] [Google Scholar]
- 35.Fang R, Wey A, Bobbili NK, Leke RFG, Taylor DW, Chen JJ. 2017. An analytical approach to reduce between-plate variation in multiplex assays that measure antibodies to Plasmodium falciparum antigens. Malar J 16:287. 10.1186/s12936-017-1933-6. [DOI] [PMC free article] [PubMed] [Google Scholar]