ABSTRACT
Ceftazidime (CAZ)-avibactam (AVI) is a β-lactam/β-lactamase inhibitor combination with activity against type A and type C β-lactamases. Resistance emergence has been seen, with multiple mechanisms accounting for the resistance. We performed four experiments in the dynamic hollow-fiber infection model, delineating the linkage between drug exposure and both the rate of bacterial kill and resistance emergence by all mechanisms. The Pseudomonas aeruginosa isolate had MICs of 1.0 mg/liter (CAZ) and 4 mg/liter (AVI). We demonstrated that the time at ≥4.0 mg/liter AVI was linked to the rate of bacterial kill. Linkage to resistance emergence/suppression was more complex. In one experiment in which CAZ and AVI administration was intermittent and continuous, respectively, and in which AVI was given in unitary steps from 1 to 8 mg/liter, AVI at up to 3 mg/liter allowed resistance emergence, whereas higher values did not. The threshold value was 3.72 mg/liter as a continuous infusion to counterselect resistance (AVI area under the concentration-time curve [AUC] of 89.3 mg · h/liter). The mechanism involved a 7-amino-acid deletion in the Ω-loop region of the Pseudomonas-derived cephalosporinase (PDC) β-lactamase. Further experiments in which CAZ and AVI were both administered intermittently with regimens above and below the AUC of 89.3 mg · h/liter resulted in resistance in the lower-exposure groups. Deletion mutants were not identified. Finally, in an experiment in which paired exposures as both continuous and intermittent infusions were performed, the lower value of 25 mg · h/liter by both profiles allowed selection of deletion mutants. Of the five instances in which these mutants were recovered, four had a continuous-infusion profile. Both continuous-infusion administration and low AVI AUC exposures have a role in selection of this mutation.
KEYWORDS: β-lactam/β-lactamase inhibitor, resistance emergence, hollow-fiber infection model
INTRODUCTION
Ceftazidime (CAZ)-avibactam (AVI) is an important addition to the contemporary pharmacological armamentarium that was developed for therapy of difficult-to-treat Pseudomonas aeruginosa infections. AVI (a bridged diazabicyclooctane [DBO] non-β-lactam β-lactamase inhibitor [BLI]) is an inhibitor of class C and many class A β-lactamases, including Klebsiella pneumoniae carbapenemase 2 (KPC-2) and KPC-3 enzymes. As a result, this BLI, in combination with CAZ, has become an important mainstay of current therapies, showing improved outcomes in comparison with the best available therapy (1). Thus, this combination allows clinicians to avoid utilizing polymyxin antibiotics in seriously ill patients with multidrug-resistant organisms and thereby to avoid the toxicities associated with this class of anti-infective agents (2).
Unfortunately, the emergence of resistance to CAZ-AVI among isolates possessing KPC enzymes is very troublesome (3). Important variants in this carbapenemase possess single-amino-acid substitutions in the Ω-loop region, resulting in high-level resistance in KPC-3-bearing isolates (4). Similar findings were seen in Pseudomonas aeruginosa, with single point mutations driving clinically important changes in MIC values (5). A report of several deletion mutants in the Ω-loop region of the blaPDC β-lactamase of P. aeruginosa has also been reported (6). These deletion mutants exhibited high-level CAZ-AVI resistance but interestingly also demonstrated increased susceptibility to members of the type 2 carbapenems, such as meropenem, doripenem, and imipenem (3, 6). The same was true for some but not all KPC-3 mutants (3). The former finding in the KPC-3-bearing isolates occurred clinically, while the deletion mutations in the P. aeruginosa isolate represented an in vitro finding.
It is noteworthy that the recovered P. aeruginosa deletion mutations/deletions varied in size from 5 to 19 amino acid residues (6). The original isolate from which the mutants were recovered was at baseline stably derepressed for expression of its Pseudomonas-derived cephalosporinase (PDC) β-lactamase.
In this set of experiments, we aimed to examine differing CAZ-AVI resistance profiles in a dynamic, in vitro hollow-fiber infection model (HFIM). Specifically, we sought to ascertain the pharmacodynamic profile most closely associated with different mutations and to identify the profiles that provide the greatest cell kill against our isolate of stably derepressed P. aeruginosa. In so doing, we wished to identify a schedule of administration that would also help preserve the activity of CAZ-AVI for patients.
RESULTS
Organism MIC and mutational frequency to achieve resistance.
The isolate of P. aeruginosa employed in these studies was characterized previously (7). The MIC for CAZ was 1 mg/liter in the presence of 4 mg/liter of AVI, and it was 32 mg/liter for CAZ alone. Whole-genome sequencing (WGS) demonstrated that this isolate was wild type for ampD, ampG, ampE, and nagZ. In the baseline isolate, a 13-amino-acid deletion in the dacB gene, encoding the nonessential pbp4, was noted (8). This deletion has been shown to be the most prevalent change causing immediate onset of high-level β-lactam resistance due to overexpression of the PDC β-lactamase.
The mutational frequency to achieve resistance was determined twice. The values for the individual replicates were −8.16 log10 units (i.e., 1 in 144,543,977 CFU/ml) and −7.35 log10 units (i.e., 1 in 22,387,211 CFU/ml) when tested with CAZ-AVI at 3 times the baseline MIC for CAZ in the presence of 4 mg/liter AVI incorporated into the selecting agar. The MIC values for colonies recovered from the selecting plates were 4 mg/liter of CAZ (i.e., 4-fold higher than the baseline MIC) in the presence of 4 mg/liter of AVI.
Continuous-infusion AVI with intermittent CAZ selection.
We simulated 2 g of CAZ as a 2-h infusion every 8 h in all active HFIM arms. Active treatment controls were not employed. Additionally, we simulated the continuous infusion of AVI into the treatment arms with AVI concentrations that ranged from 1 through 8 mg/liter (nominal values) in gradations of 1 mg/liter (i.e., eight different treatment arms).
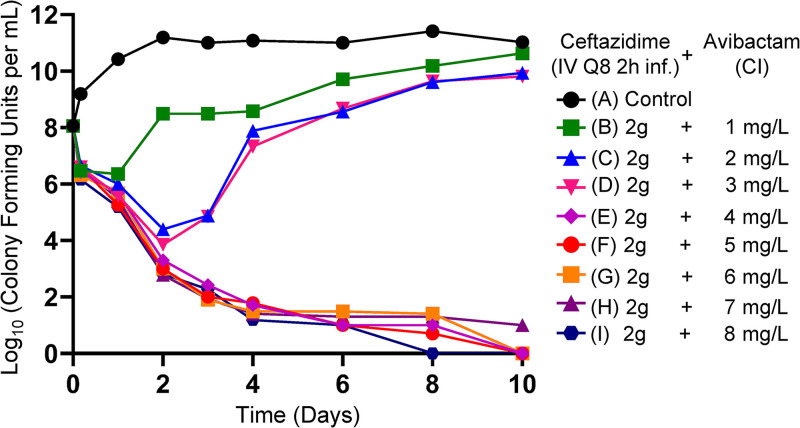
Figure 1 demonstrates the effect of CAZ-AVI in the different regimens on the P. aeruginosa isolate. The baseline bacterial burden was 1.15 × 10⁸ CFU/ml. For all CAZ-AVI regimens in which the continuous infusion of AVI met or exceeded 4 mg/liter (nominal value), the emergence of resistance was not observed and, importantly, bacterial kill rates were maximized. At CAZ-AVI continuous-infusion concentrations below this level, there was regrowth, with bacterial counts that initiated regrowth after an initial decline between day 1 and day 3.
FIG 1.
HFIM experiment in which a stably derepressed Pseudomonas aeruginosa PA01 isolate was exposed by continuous infusion (CI) to eight different AVI exposures, ranging from 1 to 8 mg/liter. A no-treatment control was included. In all treatment arms, a CAZ exposure profile simulating 2 g IV every 8 h as a 2-h infusion was employed.
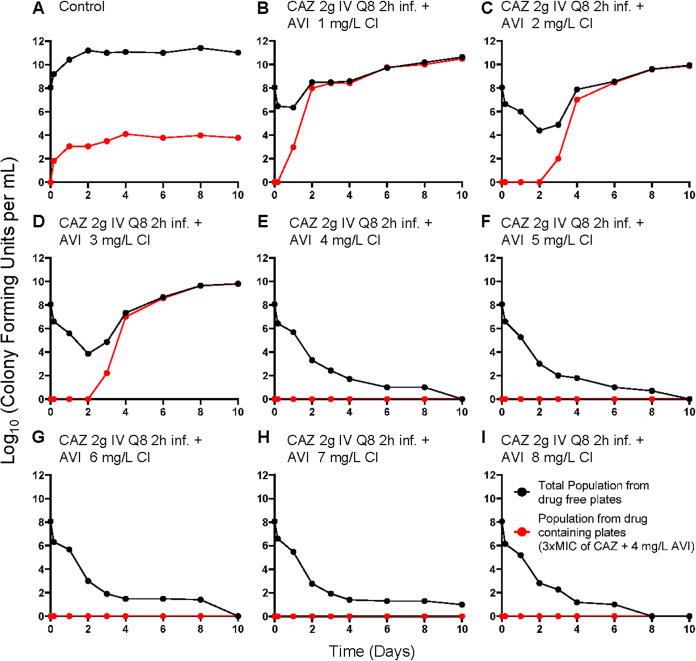
Figure 2 shows the recovery of less-susceptible isolates; with the three lowest continuous-infusion regimens of AVI, less-susceptible isolates were initially recovered between day 1 and day 3. In all instances, these less-susceptible isolates took over the entire population by days 2 to 4.
FIG 2.
Recovery of less-susceptible isolates from all arms of the AVI continuous-infusion (CI) experiment. Less-susceptible bacteria were selected on agar plates containing 3 times the baseline MIC (1 mg/liter CAZ) plus 4 mg/liter of AVI.
We measured achieved concentrations of CAZ and AVI. In all instances, there was good precision of attaining the desired CAZ concentrations (data not shown), and there was 100% time above the MIC of 1 mg/liter (with 4 mg/liter of AVI).
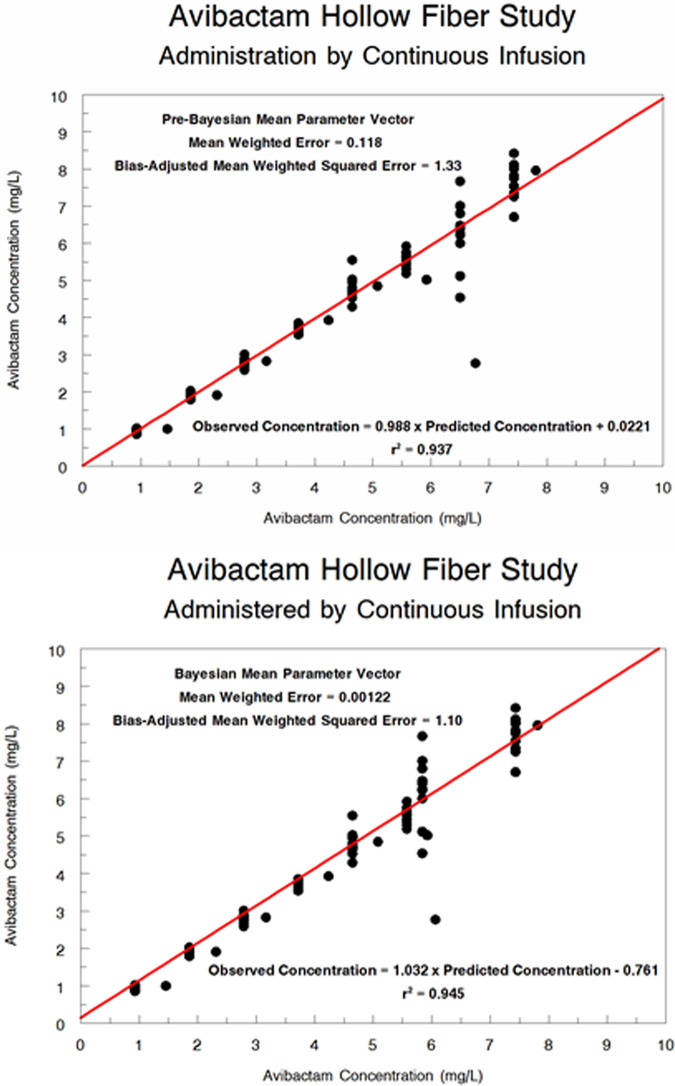
We performed a population pharmacokinetic analysis for the attained AVI concentration. The predicted-observed plots for the pre-Bayesian (population) analysis and the Bayesian (individual analysis) are displayed in Fig. 3. The fit of the model to the data was acceptable (r2 values of 0.937 and 0.945, respectively), with small estimates of bias and imprecision.
FIG 3.
Population pharmacokinetic model of AVI hollow-fiber concentrations. (Top) Pre-Bayesian (population) predicted-observed plot. (Bottom) Bayesian (individual) predicted-observed plot.
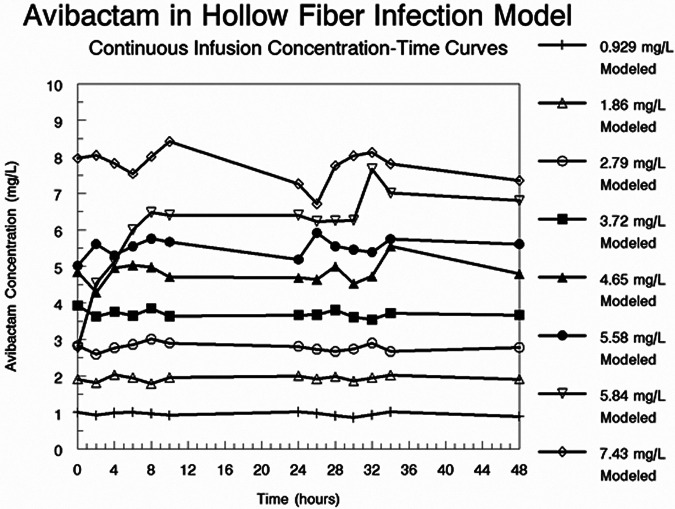
In Table 1, we show the Bayesian values for clearance for each treatment arm and the calculated attained AVI concentrations, relative to the nominal values. In Fig. 4, we show the actual measured AVI concentrations over the first 48 h of the experiment.
TABLE 1.
Concentrations of AVI administered by continuous infusion and then population modeled
| Desired AVI concentration (mg/liter) | Measured and modeled AVI concentration (mg/liter) | Modeled Bayesian posterior CL (liter/h) |
|---|---|---|
| 1 | 0.929 | 10.76 |
| 2 | 1.86 | 10.76 |
| 3 | 2.79 | 10.76 |
| 4 | 3.72 | 10.76 |
| 5 | 4.65 | 10.76 |
| 6 | 5.58 | 10.76 |
| 7 | 5.84 | 11.99 |
| 8 | 7.43 | 10.76 |
FIG 4.
Measured AVI concentrations from the experiment in which AVI was administered as continuous infusions to achieve nominal concentrations of 1 to 8 mg/liter.
Changes in MICs of the isolates recovered from resistance plates and mutational changes.
The MIC values for resistant isolates from the treatment arms ranged from 32 to 64 mg/liter. These isolates were chosen from early time points (day 3 or before) in an effort to avoid bacteria with multiple mutations that could arise because of the much larger number of rounds of replication from later time points in the experiment.
The WGS analyses revealed that all isolates with MIC values of ≥32 mg/liter taken from the first 3 days of the experiment possessed a deletion in the Ω-loop region of the PDC enzyme (Fig. 5). This deletion was 7 amino acids in length (ΔP208 to G214) and similar to that described previously (6).
FIG 5.
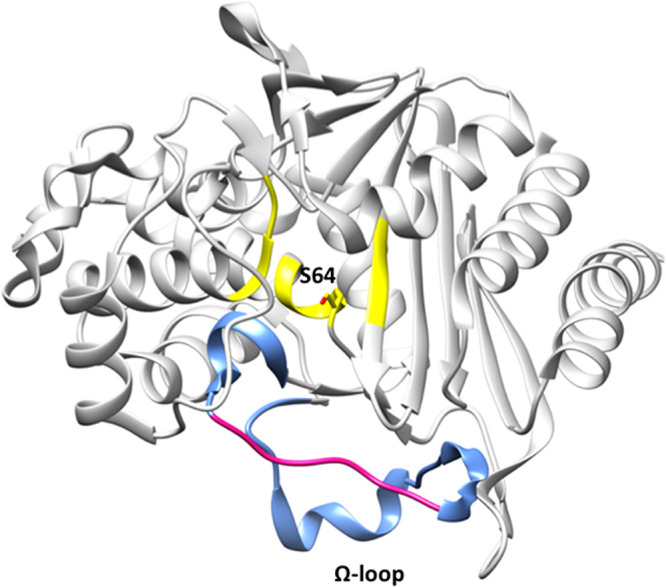
PDC structure (PDB code 4HEF) showing the Ω-loop (blue) at the entrance of the active site (yellow) and the catalytic serine 64 in stick model representation. The region of the Ω-loop that was deleted in some CAZ-resistant isolates is highlighted in pink (P208 to G214).
Intermittent infusion of CAZ-AVI.
In the previous continuous-infusion experiment, we identified a nominal concentration of AVI of 4 mg/liter (actual measured concentration of 3.72 mg/liter) as a critical concentration for suppressing production of Ω-loop deletions. This concentration or greater also determined the maximal bacterial kill rates. In this experiment, we simulated the intermittent administration (every 8 h as a 2-h infusion) of CAZ-AVI with differing pharmacokinetic parameters for each treatment arm, so that there was a differing time at ≥4 mg/liter of AVI for each arm. There were seven arms, i.e., a no-treatment control and five arms in which the time at ≥4 mg/liter of AVI decreased from approximately 8 of 8 h to approximately 4 of 8 h. The seventh arm had AVI administered as a continuous infusion at approximately 4 mg/liter.
The concentrations of CAZ in this experiment exceeded 1.0 mg/liter in all treatment arms (data not shown). We examined the concentration-time curves of AVI for the first 48 h to determine the time at which the AVI concentrations exceeded 4 mg/liter. These data were population modeled. The pre-Bayesian (population) observed-predicted plot was AVI observed concentration = 1.068 × AVI predicted concentration − 0.625 (r2 = 0.868, mean weighted error = 2.21, bias-adjusted mean weighted squared error = 39.6). For the Bayesian (individual) regression, these values were AVI observed concentration =0.997 × AVI predicted concentration + 0.151 (r2 = 0.992, mean weighted error = −0.109, bias-adjusted mean weighted squared error = 0.981).
We employed the Bayesian parameter estimates to calculate the time at ≥4 mg/liter of AVI for all intermittent regimens. The values for the time at ≥4 mg/liter and the AVI area under the concentration-time curve for 0 to 24 h (AUC) are displayed in Table 2. The times at ≥4 mg/liter of AVI ranged from 4.58 of 8 h to 7.96 of 8 h. The AUC values ranged from 353 mg · h/liter to 456 mg · h/liter. These AUCs were considerably greater than the AUC of 89.3 mg · h/liter seen at the critical value (nominal value of 4 mg/liter; observed value of 3.72 mg/liter) at which resistance was suppressed in the continuous-infusion experiment.
TABLE 2.
Volume of distribution and clearance of AVI with intermittent infusiona
| Arm | Volume of distribution (liters) | Clearance (liter/h) | Time at ≥4 mg/liter (h) | AUCss (mg . h/liter) |
|---|---|---|---|---|
| ≥4 mg/liter for 4 of 8 h | 3.06 | 3.29 | 4.58 | 456 |
| ≥4 mg/liter for 5 of 8 h | 4.88 | 3.58 | 5.48 | 419 |
| ≥4 mg/liter for 6 of 8 h | 6.83 | 4.09 | 5.88 | 367 |
| ≥4 mg/liter for 7 of 8 h | 8.66 | 4.25 | 6.47 | 353 |
| ≥4 mg/liter for 8 of 8 h | 11.1 | 3.90 | 7.96 | 382 |
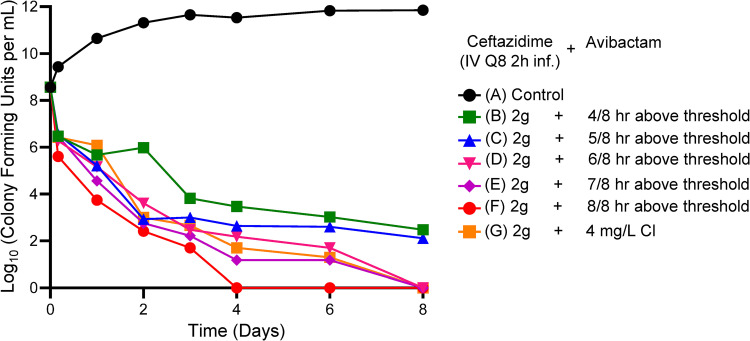
These values allow calculation of the time at an AVI concentration of ≥4 mg/liter, as well as the AVI AUC at steady state. Note that, as the time above the critical value of 4 mg/liter decreased, the rate of bacterial kill decreased. The AUC value seen in all arms was substantially greater than the AUC seen in experiment 1 for resistance suppression (AUC of 89.3 mg · h/liter).
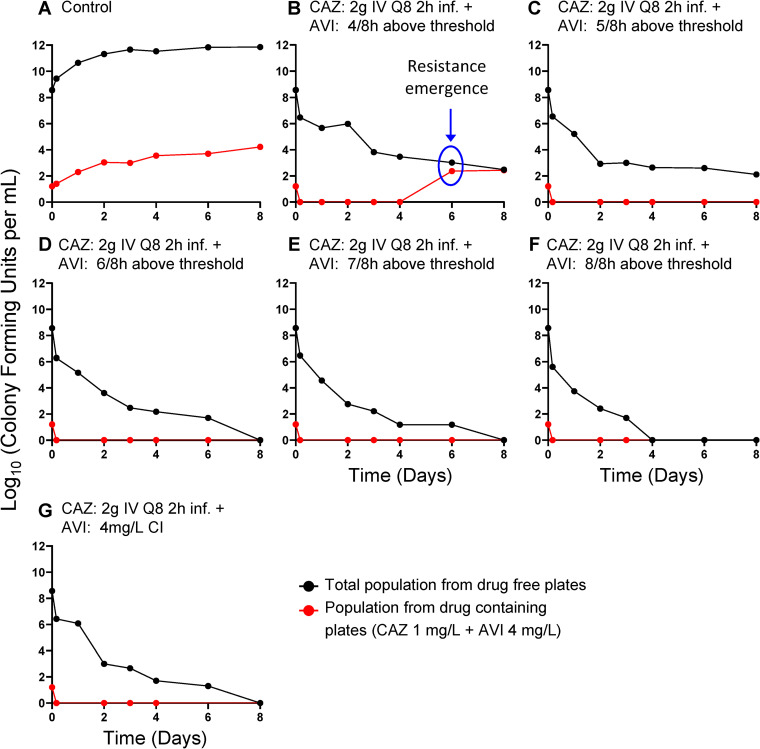
Figure 6 displays the cell kill for the differing times at ≥4 mg/liter of AVI when administered along with 2 g of CAZ every 8 h as a 2-h infusion. In contrast to the first experiment, in which all treatment arms exceeding the AVI threshold of 3.72 mg/liter had maximal rates of bacterial kill, there were differing rates of kill as a function of time at ≥4 mg/liter of AVI. Also in contrast to the first experiment, the only treatment arm in which there was resistance emergence was that in which the AVI concentration exceeded 4 mg/liter for 4.58 h (Fig. 7A to G). All other arms did not display observed resistance emergence for the duration of the experiment. The resistance emergence that did occur was not seen until day 6 (Fig. 7B). When the strain was examined and its MIC value determined, it was 4 times that of the parent isolate (1 mg/liter to 4 mg/liter in the presence of 4 mg/liter of AVI). It is also important to note that the continuous-infusion arm in this experiment (arm G) closely recapitulated the results from the first experiment.
Fig 6.
HFIM experiment in which a stably derepressed Pseudomonas aeruginosa PA01 isolate was exposed to six different AVI exposures by intermittent administration every 8 h. These were intended to produce times with AVI concentrations of ≥4 mg/liter of 4 of 8 h through 8 of 8 h. A no-treatment control was included. In all treatment arms, a CAZ exposure profile simulating 2 g IV every 8 h as a 2-h infusion was employed. CI, continuous infusion.
FIG 7.
Recovery of less-susceptible isolates from all arms of the intermittent AVI experiment. Less-susceptible isolates were selected on agar plates containing 3 times the baseline MIC (1 mg/liter) plus 4 mg/liter of AVI. CI, continuous infusion.
The mechanism of resistance was not due to an Ω-loop deletion. According to the WGS analysis, compared with the original PAO1 isolate (possessing stably derepressed blaPDC), mutations in genes associated with CAZ-AVI resistance, including blaPDC, were not found (Table 3). Additionally, in order to evaluate whether observed phenotypes could be attributed to different levels of expression, RNA-seq (rRNA-depleted transcriptome sequencing) was performed. However, a difference in expression in resistance-associated genes, compared to the original PAO1 isolate (possessing stably derepressed blaPDC), was not observed (see Fig. S1 in the supplemental material).
TABLE 3.
Summary of resistance-associated genes queried in P. aeruginosa isolates
| Gene | Description | Data for straina: |
||||||
|---|---|---|---|---|---|---|---|---|
| ABD11(32) | ABD61(4) | ABD62(4) | ABD63(4) | AED11(32) | ACD21(32) | ACD23(32) | ||
| aph(3′)-II/XV | Aminoglycoside 3′-phosphotransferase (EC 2.7.1.95) | WT | WT | WT | WT | WT | WT | WT |
| catB | Chloramphenicol O-acetyltransferase (EC 2.3.1.28) | WT | WT | WT | WT | WT | WT | WT |
| bla OXA-50 | Class D β-lactamase (EC 3.5.2.6), OXA-50 family | WT | WT | WT | WT | WT | WT | WT |
| fosA | Fosfomycin resistance protein FosA | WT | WT | WT | WT | WT | WT | WT |
| bla PDC | Class C β-lactamase (EC 3.5.2.6), PDC family | Δ208–214 | WT | WT | WT | WT | WT | WT |
| ampDh2 | N-Acetylmuramoyl-l-alanine amidase (EC 3.5.1.28) (1,6-anhydro-N-acetylmuramyl-L-alanine amidase) | WT | WT | WT | WT | WT | WT | WT |
| ampDh3 | N-Acetylmuramoyl-l-alanine amidase (EC 3.5.1.28) | WT | WT | WT | WT | WT | WT | WT |
| ampR | Transcriptional regulator AmpR, LysR family | WT | WT | WT | WT | WT | WT | WT |
| amgS | Alanine racemase (EC 5.1.1.1) | WT | WT | WT | WT | WT | WT | WT |
| clpa | ATP-dependent Clp protease, ATP-binding subunit ClpA | WT | WT | WT | Wt | Δ1–240 | WT | WT |
| clpP | ATP-dependent Clp protease, proteolytic subunit ClpP (EC 3.4.21.92) | WT | WT | WT | WT | WT | WT | WT |
| colR | Two-component transcriptional response regulator, OmpR family | WT | WT | WT | WT | WT | WT | WT |
| colS | Two-component sensor ColS | WT | WT | WT | WT | WT | WT | WT |
| cprS | Putative two-component sensor | WT | WT | WT | WT | WT | FS, ins C at nt 806 | WT |
| ctpA | Carboxyl-terminal processing protease CtpA | WT | WT | WT | WT | WT | WT | WT |
| dacB | PBP-4, d-alanyl-d-alanine carboxypeptidase (EC 3.4.16.4) | Δ464–476 | Δ464–476 | Δ464–476 | Δ464–476 | Δ464–476 | Δ464–476 | Δ464–476 |
| ftsI | PBP-3 | WT | WT | WT | WT | WT | WT | WT |
| dnaJ | Chaperone protein DnaJ | WT | WT | WT | WT | Δ1–205 | WT | WT |
| dnaK | Chaperone protein DnaK | WT | WT | WT | WT | WT | WT | WT |
| flgF | Flagellar basal body rod protein FlgF | WT | WT | WT | WT | WT | WT | WT |
| fusA | Translation elongation factor G | WT | WT | WT | WT | WT | WT | WT |
| glnD | [Protein-PII] uridylyltransferase (EC 2.7.7.59), [protein-PII]-UMP uridylyl-removing enzyme | WT | WT | WT | WT | WT | WT | WT |
| glpt | Glycerol-3-phosphate transporter | WT | WT | WT | WT | WT | WT | WT |
| galU | UTP-glucose-1-phosphate uridylyltransferase (EC 2.7.7.9) | WT | WT | WT | WT | WT | WT | WT |
| grpE | Heat shock protein GrpE | WT | WT | WT | WT | WT | WT | WT |
| gyra | DNA gyrase subunit A (EC 5.99.1.3) | WT | WT | WT | WT | WT | WT | WT |
| gyrB | DNA gyrase subunit B (EC 5.99.1.3) | WT | WT | WT | WT | WT | WT | WT |
| hfq | RNA-binding protein Hfq | WT | WT | WT | WT | WT | WT | WT |
| hmga | Homogentisate 1,2-dioxygenase (EC 1.13.11.5) | WT | WT | WT | WT | WT | WT | WT |
| infB | Translation initiation factor 2 | WT | WT | WT | WT | WT | WT | WT |
| mvaT | Transcriptional regulator MvaT | WT | WT | WT | WT | WT | WT | WT |
| mexA | Multidrug efflux system, membrane fusion component MexA | WT | WT | WT | WT | WT | WT | WT |
| mexB | Multidrug efflux system, inner membrane proton/drug antiporter (RND type) MexB | WT | WT | WT | WT | WT | WT | WT |
| mexR | Multidrug resistance operon repressor MexR, MarR family | WT | WT | WT | WT | WT | WT | WT |
| mexS | Negative regulation of protein secretion | WT | WT | WT | WT | WT | WT | Δ1–23 |
| mexT | Transcriptional regulator MexT | Δ105–112; FS, del G at nt 449 | Δ105–112 | Δ105–112 | Δ105–112 | NA | Δ105–112; FS, del G at nt 449 | Δ105–112; FS, del G at nt 449 |
| mexZ | Transcriptional repressor of mexXY operon MexZ | WT | WT | WT | WT | WT | WT | WT |
| mpl | UDP-N-acetylmuramate:l-alanyl-γ-d-glutamyl-meso-diaminopimelate ligase (EC 6.3.2.-) | WT | WT | WT | WT | WT | WT | WT |
| nalC | Negative regulation of transporter activity | Δ1–150 | WT | WT | WT | Δ1–150 | Δ1–150 | WT |
| nalD | Negative regulation of transport | WT | WT | WT | WT | WT | WT | WT |
| nfxB | Transcriptional regulator | WT | WT | WT | WT | WT | WT | WT |
| oprD | Outer membrane low-permeability porin, OprD family | WT | WT | WT | WT | WT | WT | WT |
| oprM | Multidrug efflux system, outer membrane factor lipoprotein OprM | WT | WT | WT | WT | WT | WT | WT |
| fgtA | Glycosyltransferases involved in cell wall biogenesis | WT | WT | WT | WT | Δ1–78 | WT | WT |
| parC | DNA topoisomerase IV subunit A (EC 5.99.1.3) | FS, ins G at nt 2177 | WT | WT | WT | FS, ins G at nt 2177 | FS, ins G at nt 2177 | WT |
| parE | DNA topoisomerase IV subunit B (EC 5.99.1.3) | WT | WT | WT | WT | WT | WT | WT |
| parR | Two-component response regulator | WT | WT | WT | WT | WT | WT | WT |
| parS | Two-component response regulator | WT | WT | WT | WT | WT | WT | WT |
| pcm | Protein-l-isoaspartate O-methyltransferase (EC 2.1.1.77) | WT | WT | WT | WT | WT | WT | WT |
| pepA | Cytosol aminopeptidase PepA (EC 3.4.11.1) | WT | WT | WT | WT | WT | WT | WT |
| phoQ | Two-component sensor | WT | WT | WT | WT | WT | WT | WT |
| pitA | Low-affinity inorganic phosphate transporter | WT | WT | WT | WT | WT | WT | WT |
| pmrA | Two-component regulator system response regulator | WT | WT | WT | WT | WT | WT | WT |
| pmrB | Two-component regulator system signal sensor kinase | WT | WT | WT | WT | WT | WT | WT |
| ppkA | Type VI secretion system serine/threonine protein kinase | WT | WT | WT | WT | WT | WT | WT |
| rplb | Large subunit ribosomal protein L2p (L8e) | WT | WT | WT | WT | WT | WT | WT |
| rpoB | DNA-directed RNA polymerase beta subunit (EC 2.7.7.6) | del at nt 391–399 | WT | WT | WT | WT | WT | Early stop, del G at nt 384 |
| spoT | Guanosine-3′,5′-bis(diphosphate) 3′-pyrophosphohydrolase | WT | WT | WT | WT | WT | WT | WT |
| yerD | Ferredoxin-dependent glutamate synthase | WT | WT | WT | WT | WT | WT | Δ1–118 |
| PA3271 | Probable two-component sensor | WT | FS, del GG at nt 2167–2168 | WT | WT | WT | WT | WT |
| PA14_45870 | Heavy metal sensor histidine kinase | WT | Δ228–234 | WT | WT | WT | WT | WT |
| PA14_45880 | Two-component response regulator | WT | WT | WT | WT | WT | WT | WT |
| PA14_45890 | Multidrug efflux system MdtABC-TolC, inner-membrane proton/drug antiporter MdtB-like | Δ1–127 | WT | WT | WT | WT | WT | WT |
aWT, wild type; FS, frameshift; ins, nucleotide insertion; del, nucleotide deletion; nt, nucleotide; NA, not applicable.
Intermittent infusion of CAZ-AVI with lower AVI AUC values.
The large AVI AUC values in the previous experiment, relative to the AUC values achieved in the continuous-infusion experiment, leave open the question of the cutoff value for AVI AUC and its independence from the mode of administration. To further elucidate this, we performed an experiment in which both CAZ (2 g every 8 h) and AVI were administered as a 2-h infusion. The nominal AVI doses ranged from 215 mg every 8 h to 613 mg every 8 h. The resultant AUC values are within the 95% confidence interval for AVI AUC values in patients receiving the standard 2 g of CAZ/0.5 g of AVI (9).
The concentrations of CAZ in this experiment exceeded 1.0 mg/liter in all treatment arms of the experiment (data not shown). We examined the concentration-time curves of AVI for the first 48 h of the experiment to determine the AVI AUC values. It was our intent to have three arms generate AVI AUC values less that the breakpoint AVI AUC value (89.3 mg · h/liter) that might allow occurrence of an Ω-loop mutant. We intended two arms to meet or to exceed this value and included a no-treatment control. These data were population modeled. The pre-Bayesian (population) observed-predicted plot was AVI observed concentration = 0.944 × AVI predicted concentration + 0.223 (r2 = 0.986, mean weighted error = 0.0192, bias-adjusted mean weighted squared error = 2.26). For the Bayesian (individual) regression, these values were AVI observed concentration = 0.991 × AVI predicted concentration + 0.0723 (r2 = 0.991, mean weighted error = −0.0819, bias-adjusted mean weighted squared error = 0.999).
We employed the Bayesian parameter estimates to calculate the AVI AUC values for each treatment arm. For the first three arms, the AVI AUC values were 75.9, 87.6, and 109 mg · h/liter. The last arm exceeded the breakpoint value of 89.3 mg · h/liter. The two higher-exposure arms exceeded the breakpoint value and attained exposures of 162 and 199 mg · h/liter of AVI.
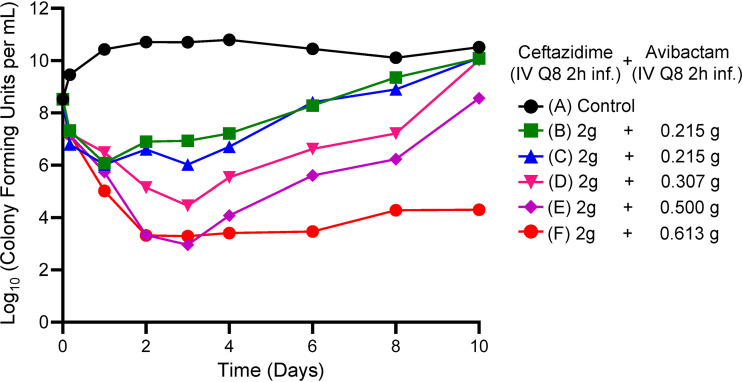
Figure 8 displays the cell kill for the different AVI exposures when AVI was administered along with 2 g of CAZ every 8 h as a 2-h infusion. The measured AVI AUC ranged from below the AVI Ω-loop deletion breakpoint of 89.3 up to 199 mg · h/liter. The higher AVI AUC exposures (arms E and F) yielded nearly maximal kill rates. A sigmoidal maximum effect (Emax) model (using time above an AVI concentration of 4 mg/liter as the independent variable) fit to the bacterial kill numbers on day 1, before confounding due to resistance emergence, had an r2 value of 0.938; the Emax value was 7.46 log10 (CFU/ml), the time above an AVI concentration of 4 mg/liter was 7.07 h, and the Hill constant was 1.06.
FIG 8.
HFIM experiment in which a stably derepressed Pseudomonas aeruginosa PA01 isolate was exposed to five different AVI exposures by intermittent administration every 8 h. AVI exposures ranged from 75.9 to 199 mg · h/liter. A no-treatment control was included. In all treatment arms, a CAZ exposure profile simulating 2 g IV every 8 h as a 2-h infusion was employed.
The fourth and fifth arms of the experiment had AVI concentrations above 4.0 mg/liter for 5.35 of 8 h and 6.05 of 8 h, respectively. These values are quite close to the times above 4.0 mg/liter seen in arms C and D from experiment 2 (intermittent AVI administration). The amounts of bacterial cell kill observed in these experiments were highly concordant. This again indicates that the dynamic driver for bacterial cell kill is the time the AVI concentrations remain at ≥4.0 mg/liter.
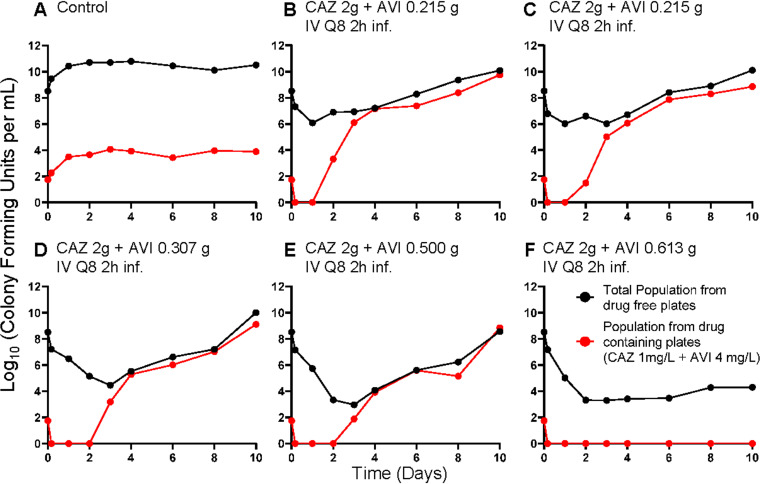
When isolates from the resistance plates (Fig. 9) were examined by WGS, we again focused on early resistance emergence to avoid isolates with multiple acquired resistance mechanisms. We examined isolates from arms B and C (day 2) and arms D and E (day 3). The isolates from arms B and C that had AVI AUC values less than the breakpoint values did not have deletions in the blaPDC gene. The other isolates, with AVI AUC values above the breakpoint, also did not have deletion mutations. Although we performed both WGS and RNA-seq analyses, we were unable to identify a mutation or different expression levels that would explain the 16-fold increase in MIC values.
FIG 9.
Recovery of less-susceptible isolates from all arms of the lower-AUC, intermittent-AVI experiment. Less-susceptible isolates were selected on agar plates containing 3 times the baseline MIC (1 mg/liter) plus 4 mg/liter of AVI.
Direct comparison of intermittent infusion versus continuous infusion of AVI.
We compared nominal AVI AUC values of 24 and 48 mg · h/liter administered as a continuous infusion and by intermittent administration with a 2-h infusion. For all treatment arms, CAZ concentrations exceeded 1 mg/liter at all measured points.
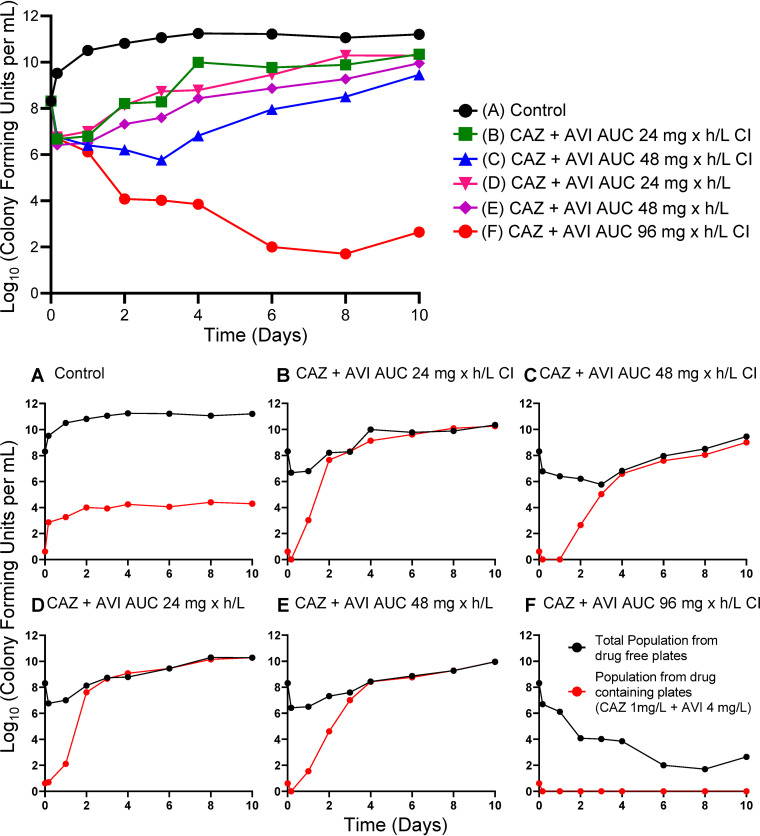
The microbiological activity of these regimens is shown in Fig. 10; the effect on amplification of a less-susceptible subpopulation is displayed in the lower panels. There was emergence of resistance in all treatment arms except for the continuous-infusion arm with a nominal AUC value for AVI of 96 mg · h/liter. Nominal versus measured AVI AUC exposures were as follows: 24-mg · h/liter continuous infusion versus intermittent infusion, 25.0 mg · h/liter versus 27.9 mg · h/liter; 48-mg · h/liter continuous infusion versus intermittent infusion, 52.93 mg · h/liter versus 53.98 mg · h/liter; 96-mg · h/liter continuous infusion, 114.7 mg · h/liter.
FIG 10.
Microbiological effect of 2 g of CAZ plus AVI at AUC nominal exposures of 24 and 48 mg · h/liter administered as a continuous infusion (CI) or as an intermittent administration. An AUC exposure of 96 mg · h/liter as a continuous infusion was also studied. (A) Microbiological effects of all exposures. (B to F) Emergence of resistance.
WGS analysis of the recovered resistant isolates showed that both arms with nominal AVI AUC values of 24 mg · h/liter had the 7-bp deletion mutation in the Ω-loop region seen in the first experiment. These isolates had CAZ-AVI MIC values of 32 and >64 mg/liter (in the presence of 4 mg/liter AVI). Other isolates from the continuous-infusion and intermittent-infusion arms with a nominal value of 48 mg/liter had MIC values of 32 mg/liter and possessed a wild-type blaPDC. RNA-seq evaluation did not elucidate a mechanism for the MIC change (Table 3).
DISCUSSION
Pseudomonas aeruginosa remains a challenging pathogen for patients with serious infections in the intensive care unit, especially with evolving resistance patterns (10). CAZ-AVI is a relatively new addition to clinicians’ therapeutic armamentarium. The bridged DBO BLI AVI provides robust inhibition of class C and many class A β-lactamases (11). However, resistance emergence has been observed. Of interest, some resistance has resulted from alterations of the β-lactamases (3–6), while in other instances the change in MIC value has been attributed to overexpression of efflux pumps or downregulation of porin channels (12).
In order to maintain new additions to our formulary for the longest possible time, understanding the relationship between drug exposure profiles and rate of kill, as well as suppression of resistance (delineation of pharmacodynamic drivers), is critical. In the first experiment, the aim was to identify a breakpoint at which the CAZ-AVI combination would fail. CAZ was administered intermittently while AVI was administered as a continuous infusion. This design separates the effect of the β-lactam from the inhibition of the enzyme. Failure would indicate insufficient enzyme inhibition, resistance emergence, or both.
Figures 1 and 2 demonstrate the impact of adequate enzyme inhibition. When there was failure (three lowest continuous-infusion exposures), the mechanism was by resistance emergence. When inhibition was adequate (five higher continuous-infusion exposures), resistance did not emerge. In this scenario, all exposures resulted in approximately the same rates of kill (Fig. 1 and 2E to I). This is understandable, because the same CAZ exposure was administered in all treatment arms. With adequate enzyme inhibition, the β-lactam could yield the maximal effect associated with that exposure.
In the continuous-infusion arms with lower AVI doses, all of the emergence of resistance was due to deletions in the Ω-loop region of the PDC β-lactamase. These deletions mediated a large increase in MIC values from 1 mg/liter CAZ in the presence of 4 mg/liter AVI to ≥32mg/liter with the AVI (Fig. 5). A question that arises, then, is why the Ω-loop deletion would occur in this circumstance so frequently. It is a question requiring further inquiry, but at least one hypothesis is that structural changes in the β-lactamase do not impose a fitness penalty in the way that overexpression of the β-lactamase, porin downregulation, and overexpression of efflux pumps do. Previous work showed that, in P. aeruginosa, an Ω-loop deletion resulted in an enzyme that was less avid for AVI but more avid for CAZ (6). It has also been suggested that the location preference for such deletions can be explained by the presence of flanking short direct repeats that could result in looping out of the intervening DNA (5). Indeed, the 7-amino-acid deletion in the Ω-loop of PDC in our strains was also flanked by 7-bp direct repeats (see Fig. S2 in the supplemental material), suggesting that the same mechanism contributed to this deletion.
Another conclusion that may be drawn is that resistance suppression through β-lactamase Ω-loop deletion is likely counterselected by AUC when AVI is administered as a continuous infusion or by achieving a steady-state concentration of 3.72 mg/liter. The breakpoint for resistance suppression is approximately 89.3 mg · h/liter (3.72 mg/liter × 24 h).
Once having established a continuous-infusion breakpoint for AVI, we wished to examine how long the AVI concentration needed to be above the identified threshold with regard to both endpoints, i.e., resistance emergence and bacterial cell kill. In Fig. 6, we show the impact on bacterial kill when the AVI was administered intermittently but with different times at ≥4 mg/liter. CAZ profiles were unchanged in all arms. The times at ≥4 mg/liter of AVI were calculated and are displayed in Table 2. As the time at ≥4 mg/liter of AVI increased from 4.58 of 8 h to 7.96 of 8 h, the bacterial kill was markedly increased. As an example, on day 4, the lowest time at ≥4 mg/liter of AVI yielded a colony count with 3.47 log10(CFU/ml), while the highest had 0 colonies/ml. At this time point, none of the treatment arms had any less-susceptible isolates recovered. The bacterial cell kill prior to any resistance emergence was related to the time at ≥4 mg/liter of AVI when it was administered intermittently. It should also be noted that this effect was in the background of having the CAZ concentration always above 1 mg/liter (all CAZ concentrations assayed for all experiments are shown in Table S1). The baseline MIC for CAZ in the presence of 4 mg/liter of AVI was 1.0 mg/liter.
Emergence of resistance did occur in this experiment (Fig. 7) but only in the arm with the shortest time at ≥4 mg/liter (4.58 of 8 h), and this did not occur until day 6. Perhaps of greater interest is that this isolate had an MIC value that exceeded the baseline MIC value by 4-fold. This is in contrast to the deletion mutants recovered above, for which the mutant MIC values were elevated ≥32-fold.
It appears that resistance suppression is more complex than seen in other instances (13–15). The frequent isolation of deletion mutants in the AVI continuous-infusion experiment at values below the critical threshold was unexpected. The mechanism for this is under study. The complete suppression of resistance emergence was achieved in the continuous-infusion experiment at a critical threshold of 3.72 mg/liter. However, when resistance did occur, the step size of resistance was quite large and is associated with the deletion from the β-lactamase molecule around the Ω-loop. In the intermittent-infusion study, there was less resistance emergence. When it occurred, it was associated only with the arm with the shortest time at ≥4 mg/liter AVI. Deletion mutants were not recovered. This may imply that the risk of deletion mutants is associated with the continuous-infusion scenario or may be associated with the relatively low AUC values seen in this experiment (AUC threshold to suppress deletion mutants was 89.3 mg · h/liter). The AUC values for the AVI in the intermittent administration experiment ranged from 338 to 445 mg · h/liter (Table 2).
Our working hypotheses from the first two experiments were that bacterial kill was driven by the time that the AVI concentration was above the critical value of 4 mg/liter in the presence of CAZ concentrations of ≥1 mg/liter, that this driver was also linked to resistance emergence for mechanisms that lowered periplasmic CAZ concentrations (porin deletions, efflux pump overexpression, ampC [PDC] β-lactamase overexpression, or others), and that the probability of an amino acid deletion in the Ω-loop region of the β-lactamase resulting in increased CAZ affinity for the β-lactamase active site and decreased affinity for AVI was linked to either a continuous concentration of 3.72 mg/liter or an AUC of AVI with a critical value of 89.3 mg · h/liter. We prospectively tested these hypotheses (the third experiment) by employing the same CAZ profile but generating AVI exposures that were near but on either side of the proposed breakpoint value of 89.3 mg · h/liter. None of the AVI AUC values in this experiment, whether above or below the value of 89.3 mg · h/liter, had deletion mutants identified. The last two AVI exposures (109 and 199 mg · h/liter) drove the time above 4.0 mg/liter of AVI to 5.85 of 8.0 h and 6.06 of 8.0 h, respectively, which resulted in nearly maximal rates of bacterial kill, in accordance with the earlier experiments, confirming that the time above 4.0 mg/liter of AVI drives bacterial kill. Resistance emergence was seen up to an AVI AUC of 109 mg · h/liter but without deletions in the blaPDC gene being observed. Both WGS and RNA-seq were unable to identify a putative mechanism for resistance emergence in the resistant isolates from experiment 3 (Table 3).
In experiment 4, we directly compared achieving AUC values of less than 89.3 mg · h/liter through administration by continuous infusion or intermittent infusion in the same experiment. We also included a continuous-infusion arm above the breakpoint. Achievement of the target exposures was good (AUC of 24 mg · h/liter was 27.9 mg · h/liter by continuous infusion and 25.01 mg · h/liter by intermittent infusion; AUC of 48 mg · h/liter was 54.0 mg · h/liter by continuous infusion and 52.9 mg · h/liter by intermittent infusion). The same 7-amino-acid deletion mutation as seen in experiment 1 was identified in the two arms. Both had nominal AUC values of 24 mg · h/liter, although they had differing modes of administration.
It should be noted that the PDC deletion mutation was identified five times in the four experiments. In four of those five occurrences, it was in the background of continuous-infusion administration. In all instances, the AVI exposures were below the nominal identified breakpoint of 96 mg · h/liter. We conclude that both continuous-infusion administration and low AVI exposures as indexed to the AUC have a role in selection of this mutation, which results in a large increase in CAZ-AVI MIC values.
We also note that it will be important to continue to conduct basic investigation on the mechanism of resistance to this combination. In multiple isolates, the combination of WGS and RNA-seq was unable to identify a clear mechanism for resistance emergence despite interrogation of a large number of genes and their expression.
A limitation of the study is that a single isolate was examined. Further, this isolate had a relatively low CAZ-AVI MIC (1.0/4.0 mg/liter). The CAZ exposures achieved all had trough concentrations that exceeded 1.0 mg/liter (see Table S1). To be a general phenomenon, more isolates with higher MIC values should be studied. It is highly likely that, as the CAZ-AVI MIC rises, the bacterial cell kill will decline, due to either or both of inadequate CAZ exposure or inadequate AVI exposure.
In summary, CAZ-AVI against P. aeruginosa has a bacterial cell kill driver of the time of AVI concentrations above 4.0 mg/liter. Resistance suppression is also partially linked with this driver, whether the resistance mechanism is classic porin downregulation, efflux pump overexpression, or other mechanisms. Amino acid deletion variants arose from inadequate AVI AUC values and were more commonly observed for continuous-infusion versus intermittent-infusion administration in our hollow-fiber studies. These deletions generally caused large MIC changes and may alter the affinity of both CAZ and AVI for the active site of the β-lactamase.
MATERIALS AND METHODS
Microorganisms.
The isolate of Pseudomonas aeruginosa (a stably derepressed isolate of PA01) was described previously (7). The stable derepression was due to a 13-amino-acid deletion in the dacB gene (see above).
Drugs.
CAZ-AVI was kindly supplied by Allergan, Inc.
In vitro susceptibility testing.
The in vitro susceptibility to CAZ-AVI was determined using the microdilution broth method described by the Clinical and Laboratory Standards Institute (16), in cation-adjusted Mueller-Hinton broth (CA-MHB). The susceptibility testing was performed using serial 2-fold dilutions of CAZ in combination with a fixed concentration of 4 mg/liter of AVI. The MICs were read after the cultures were incubated for 16 to 20 h at 35°C in ambient air.
Mutation frequency.
Overnight broth cultures were quantitatively cultured on drug-free Mueller-Hinton agar (MHA) plates to estimate the total bacterial burden and also on agar supplemented with 3 times the baseline CAZ MIC value of the respective isolate in the presence of 4 mg/liter of AVI. After 48 h of incubation, the colonies on drug-free and antibiotic-supplemented agars were enumerated. The mutation frequency value was calculated by dividing the total number of colonies on drug-supplemented agar by the number of colonies on drug-free agar. To confirm that the colonies that grew on antibiotic-supplemented agars had reduced susceptibilities to the test antibiotics, MIC values were determined for several of the colonies collected from the drug-containing plates.
Hollow-fiber infection model.
A HFIM was used to investigate the pharmacodynamics of CAZ-AVI against a stably derepressed P. aeruginosa isolate (PA01). A peristaltic pump circulated CA-MHB between the central compartment of the hollow-fiber cartridges (FiberCell Systems, Frederick, MD, USA) and the central compartment. CAZ-AVI was administered into the central compartment by a programmable syringe pump. Fresh CA-MHB was pumped from a reservoir into the central compartment, and the same volume of drug-containing medium was removed as waste. The rate was controlled to simulate pharmacokinetic profiles for CAZ-AVI (9). The half-lives of CAZ and AVI have 95% confidence intervals that overlap. Therefore, we used a single value where appropriate. In experiment 2, we changed the AVI half-life to obtain differing times above 4 mg/liter of AVI. The extracapillary space of each HFIM was inoculated with 12 ml of bacterial suspension. The desired inoculum was confirmed with quantitative cultures. The HFIM was incubated at 35°C in ambient air. Over the 10-day experiments, 0.4-ml samples of bacterial suspension were collected from the extracapillary space for each determination. Serial dilutions in 0.1-ml volumes were then quantitatively cultured on both drug-free agar and agar supplemented with 3 times the baseline MIC of CAZ plus 4 mg/liter of AVI, to enumerate the impact of each antibiotic regimen on the total and less-susceptible bacterial populations, respectively.
Study design.
There were four HFIM experiments. In experiment 1, there were nine arms, including a no-treatment control. Treatment arms all had CAZ concentrations simulating a dosage of 2 g every 8 h, as a 2-h intravenous (IV) infusion. AVI was administered by continuous infusion with nominal concentrations ranging from 1.0 through 8.0 mg/liter in unitary steps. For AVI, a small loading dose was given to rapidly attain steady state.
In experiment 2, there were seven arms, with a no-treatment control. The six treatment arms all had CAZ concentrations simulating a dosage of 2 g every 8 h, as a 2-h IV infusion. For AVI, the clearance and volume were altered to approximate AVI profiles in which the drug concentration exceeded 4.0 mg/liter for 4.0 through 8.0 h, in unitary steps. The in vitro concentration-time profile had approximately the same AUC but had an altered volume of distribution to change the AVI half-life to attain the desired time above 4.0 mg/liter of AVI; this was accomplished by employing the approach of Blaser (17).
Experiment 3 evaluated whether administering AVI intermittently in exposures that would be below and above the nominal breakpoint of 96 mg · h/liter (actual value of 89.3 mg · h/liter) would allow resistance by the Ω-loop deletion mutation. This was a six-arm experiment with a no-treatment control. Because experiment 2 had very large AVI AUC values, we wished to examine the impact of lower AVI exposures. AVI exposures simulating dosages of AVI of 215 mg every 8 h (duplicated), 307 mg every 8 h, 500 mg every 8 h (the clinical dose), and 613 mg every 8 h were studied.
Experiment 4 compared continuous infusion of AVI and intermittent infusion at the same AUC values (24 and 48 mg · h/liter) directly within the same experiment. There was a no-treatment control, as well as an arm in which the nominal value for AVI AUC was 96 mg · h/liter.
Each hollow-fiber arm for all experiments was sampled for quantitative cultures of the bacterial densities at baseline (time of 0 h) and at 0.17, 1, 2, 3, 4, 6, 8, and 10 days after therapy initiation for microbiological endpoints (total and less-susceptible P. aeruginosa populations). To confirm that the intended pharmacokinetic profiles were simulated, 12 serial samples of medium were collected from each antibiotic treatment arm over the first 48 h of an experiment and frozen at −80°C until assayed for CAZ and AVI concentrations using a validated liquid chromatography-tandem mass spectrometry (LC-MS/MS) method (see below).
Whole-genome sequencing.
Total DNA was extracted using the MasterPure Gram-positive DNA purification kit (Epicentre, Madison, WI, USA) by following the manufacturer’s instructions. Libraries were prepared for sequencing using the Nextera XT kit (Illumina Inc., San Diego, CA) and were sequenced using an Illumina NextSeq 550 system at the Genomics Core at Case Western Reserve University. De novo assembly and annotation were performed using the Pathosystems Resource Integration Center (PATRIC), which provides integrated data and analysis tools to support biomedical research on bacterial infectious diseases (18). Selected samples were also sequenced on a MinION system (Oxford Nanopore Technologies, Oxford, UK) with the rapid barcoding kit. MinION reads were based called using Guppy v4.2.2 and were assembled and annotated with PATRIC. Additional sequencing was done via OpGen (Gaithersburg, Maryland). HFIM strains were compared with wild-type PAO1, and genes previously associated with CAZ-AVI resistance (e.g., blaPDC, oprD, oprM, mexAB, mexR, dnaJ, pepA, ctpA, glnD, flgF, pcm, and spoT) were queried (13).
RNA sequencing.
Total RNA was extracted using the Qiagen RNeasy Protect bacteria minikit, and sequencing libraries were prepared using NEBNext Ultra II directional RNA library preparation kits in combination with NEBNext rRNA depletion kits specific for bacterial rRNA (New England BioLabs). RNA-seq libraries were sequenced on an Illumina MiSeq system with 2 × 150-base reads. Reads were analyzed with the PATRIC RNA-seq analysis suite, using the PAO1 genome as a reference (18).
Mathematical modeling.
All AVI concentrations for each experiment were modeled simultaneously. Because this was a HFIM experiment, in which the concentration-time profiles were driven by pumps, a one-compartment model with an IV profile was employed. The model was implemented in the program BigNPAG (19, 20).
BigNPAG partitions model error into assay (fixed) and residual (random). The assay error is calculated as an output-dependent standard deviation (SD), SD = A0 + A1[C] + A2[C]2 + A3[C]3, where [C] is the measured output of drug concentration or log10-transformed colony count. There is one set of coefficients, A, for each of the two output equations. Additionally, we used a fitted multiplicative term, γ, such that each observation in the fitting process was weighted by the Fisher information, i.e., 1/(γ × SD2).
Pre-Bayesian (population) regressions were generated employing the population mean parameter vector for generating the predicted output values. Bayesian (individual) regressions were generated using the mean Bayesian posterior parameter values for each of the HFIM experiment arms.
Sigmoidal Emax Modeling was performed using the ADAPT 5 package of programs (21). We used the maximum likelihood estimator in the package to fit the model to the data. ADAPT 5 was also employed for Monte Carlo simulation.
CAZ-AVI LC-MS/MS assay for MHB II.
We have published this method previously (22). Briefly, samples in MHB II were removed from storage at −80°C and allowed to thaw at room temperature. Using 1.5-ml microcentrifuge tubes, 10.0 μl of each sample and 10 μl of internal standard (cefepime, 50.0 μg/ml in water) were added, followed by 0.500 ml of LC/MS-grade water. Each sample was then capped, vortex-mixed well for 30 s, and centrifuged for 10 min at 16,168 × g. After centrifugation, 100 μl of each sample supernatant and 100 μl of LC/MS-grade water were transferred into a 96-well plate (or vial) for analysis by LC-MS/MS.
Determination of CAZ and AVI concentrations was performed using LC-MS/MS with an Acquity I-Class ultra-performance liquid chromatography (UPLC) system (Waters) and an API 5000 triple-quadrupole mass spectrometer (AB Sciex). Separation was achieved using a Kinetex C18 HPLC column (100 by 3.0 mm, 2.6 μm; Phenomenex) at 40°C with a run time of 3.50 min. Mobile phases consisted of 0.1% formic acid in water (solvent A) and 0.1% formic acid in acetonitrile (solvent B), at a flow rate of 0.500 ml/min. The gradient profile was as follows: 0 to 0.5 min, 5% solvent B; 0.5 to 1.5 min, 5 to 40% solvent B; 1.51 to 2.50 min, 95% solvent B; 2.51 to 3.5 min, 95 to 5% solvent B. A 1-μl injection volume was used for analysis.
The mass spectrometer was operated in both positive-ion mode and negative-ion mode using a turbo-ion spray probe interface. Multiple-reaction monitoring (MRM) of m/z 264/95.8 (quantifier) and m/z 264/79.8 (qualifier) was used for AVI, MRM of 547.1/468 (quantifier) and m/z 547.1/166.9 (qualifier) was used for CAZ, and MRM of m/z 481.2/396.2 was used for the internal standard cefepime. API 5000 parameters (arbitrary units) were as follows: collision cell gas setting, 6; curtain plate gas setting, 30; nebulizer gas setting, 60; auxiliary gas setting, 60; ion spray voltage, 5,500 (CAZ) and −4,500 (AVI); temperature of heater gas, 650°C; MRM of m/z 264/95.8: declustering potential (DP), −120; collision cell energy (CE), −42; collision cell exit potential (CXP), −11; dwell time, 200 ms; MRM of m/z 264/79.8: DP, −120; CE, −56; CXP, −9; dwell time, 200 ms; MRM of m/z 547.1/468: DP, 111; CE, 19; CXP, 18; dwell time, 200 ms; MRM of m/z 547.1/166.9: DP, 76; CE, 37; CXP, 24; dwell time, 200 ms; MRM of m/z 481.2/396.2: DP, 81; CE, 19; CXP, 14; dwell time, 200 ms. Calculations were performed using Analyst software v 1.6.2 (AB Sciex).
Linearity for AVI in MHB II with a range of 0.250 to 50.0 μg/ml was demonstrated over four separate runs with a correlation coefficient (r) of ≥0.9979 and linear regression (r2) of ≥0.9958. Intrarun and interrun accuracies for each calibration curve were within ±5.7% and ±3% of nominal concentrations, respectively. Calibration curve intrarun precision ranged from 0.1% to 9.8%, and interrun precision ranged from 2.6% to 4.9%. The quality control (QC) sample intrarun and interrun accuracies were within ±9% and ±5.9% of nominal concentrations, respectively. QC sample intrarun precision ranged from 1.1% to 8.1%, and interrun precision ranged from 3.5% to 6%.
CAZ linearity in MHB II with a range of 1.00 to 200 μg/ml was demonstrated over four separate runs with a correlation coefficient (r) of ≥0.9987 and linear regression (r2) of ≥0.9974. Intrarun and interrun accuracies for each calibration curve were within ±7% and ±5.5% of nominal concentrations, respectively. Calibration curve intrarun precision ranged from 0.7% to 9.6%, and interrun precision ranged from 2.2% to 6.3%. The QC sample intrarun and interrun accuracies were within ±10.8% and ±5.4% of nominal concentrations, respectively. QC sample intrarun precision ranged from 0.8% to 9%, and interrun precision ranged from 2.8% to 8%.
ACKNOWLEDGMENTS
This work was supported by grant R01AI121430 and by the grant R01AI121430 supplement, both from the National Institute of Allergy and Infectious Diseases (to G.L.D.), and by a grant from the National Institutes of Health (grant R01AI090155 to B.N.K.). This work was also supported by grants R01AI100560, R01AI063517, and R01AI072219 (to R.A.B.) from the National Institutes of Health and by funds and/or facilities provided by the Cleveland Department of Veterans Affairs, the Veterans Affairs Merit Review Program, and the Geriatric Research Education and Clinical Center VISN 10 (to R.A.B.).
The content is solely the responsibility of the authors and does not necessarily represent the official views of the National Institutes of Health.
We declare no competing interests.
Footnotes
Supplemental material is available online only.
aac.00124-21-s0001.pdf (751.4KB, pdf)
REFERENCES
- 1.Shields RK, Nguyen MH, Chen L, Press EG, Potoski BA, Marini RV, Doi Y, Kreiswirth BN, Clancy CJ. 2017. Ceftazidime-avibactam is superior to other treatment regimens against carbapenem-resistant Klebsiella pneumoniae bacteremia. Antimicrob Agents Chemother 61:e00883-17. 10.1128/AAC.00883-17. [DOI] [PMC free article] [PubMed] [Google Scholar]
- 2.Dai C, Xiao X, Li J, Ciccotosto GD, Cappai R, Tang S, Schneider-Futschik EK, Hoyer D, Velkov T, Shen J. 2019. Molecular mechanisms of neurotoxicity induced by polymyxins and chemoprevention. ACS Chem Neurosci 10:120–131. 10.1021/acschemneuro.8b00300. [DOI] [PubMed] [Google Scholar]
- 3.Shields RK, Chen L, Cheng S, Chavda KD, Press EG, Snyder A, Pandey R, Doi Y, Kreiswirth BN, Nguyen MH, Clancy CJ. 2017. Emergence of ceftazidime-avibactam resistance due to plasmid-borne blaKPC-3 mutations during treatment of carbapenem-resistant Klebsiella pneumoniae infections. Antimicrob Agents Chemother 61:e02097-16. 10.1128/AAC.02097-16. [DOI] [PMC free article] [PubMed] [Google Scholar]
- 4.Haidar G, Clancy CJ, Shields RK, Hao B, Cheng S, Nguyen MH. 2017. Mutations in blaKPC-3 that confer ceftazidime-avibactam resistance encode novel KPC-3 variants that function as extended-spectrum β-lactamases. Antimicrob Agents Chemother 61:e02534-16. 10.1128/AAC.02534-16. [DOI] [PMC free article] [PubMed] [Google Scholar]
- 5.Slater CL, Winogrodzki J, Fraile-Ribot PA, Oliver A, Khajehpour M, Mark BL. 2020. Adding insult to injury: mechanistic basis for how AmpC mutations allow Pseudomonas aeruginosa to accelerate cephalosporin hydrolysis and evade avibactam. Antimicrob Agents Chemother 64:e00894-20. 10.1128/AAC.00894-20. [DOI] [PMC free article] [PubMed] [Google Scholar]
- 6.Lahiri SD, Walkup GK, Whiteaker JD, Palmer T, McCormack K, Tanudra MA, Nash TJ, Thresher J, Johnstone MR, Hajec L, Livchak S, McLaughlin RE, Alm RA. 2015. Selection and molecular characterization of ceftazidime/avibactam-resistant mutants in Pseudomonas aeruginosa strains containing derepressed AmpC. J Antimicrob Chemother 70:1650–1658. 10.1093/jac/dkv004. [DOI] [PubMed] [Google Scholar]
- 7.Louie A, Bied A, Fregeau C, Van Scoy B, Brown D, Liu W, Bush K, Queenan AM, Morrow B, Khashab M, Kahn JB, Nicholson S, Kulawy R, Drusano GL. 2010. Impact of different carbapenems and regimens of administration on resistance emergence for three isogenic Pseudomonas aeruginosa strains with differing mechanisms of resistance. Antimicrob Agents Chemother 54:2638–2645. 10.1128/AAC.01721-09. [DOI] [PMC free article] [PubMed] [Google Scholar]
- 8.Moya B, Dötsch A, Juan C, Blázquez J, Zamorano L, Haussler S, Oliver A. 2009. β-Lactam resistance response triggered by inactivation of a nonessential penicillin-binding protein. PLoS Pathog 5:e1000353. 10.1371/journal.ppat.1000353. [DOI] [PMC free article] [PubMed] [Google Scholar]
- 9.Li J, Zhou D, Das S, Lovern MR, Green ML, Chiu JS, Riccobene TA, Carrothers TJ, Al-Huniti N. 2015. Population PK modeling for ceftazidime-avibactam in patients with complicated intra-abdominal infection and complicated urinary tract infection. Am Assoc Pharm Sci Annu Meet Expos, Orlando, Florida, 25 to 29 October 2015. [Google Scholar]
- 10.MacVane SH. 2017. Antimicrobial resistance in the intensive care unit: a focus on Gram-negative bacterial infections. J Intensive Care Med 32:25–37. 10.1177/0885066615619895. [DOI] [PubMed] [Google Scholar]
- 11.Coleman K. 2011. Diazabicyclooctanes (DBOs): a potent new class of non-β-lactam β-lactamase inhibitors. Curr Opin Microbiol 14:550–555. 10.1016/j.mib.2011.07.026. [DOI] [PubMed] [Google Scholar]
- 12.Castanheira M, Doyle TB, Smith CJ, Mendes RE, Sader HS. 2019. Combination of MexAB-OprM overexpression and mutations in efflux regulators, PBPs and chaperone proteins is responsible for ceftazidime/avibactam resistance in Pseudomonas aeruginosa clinical isolates from US hospitals. J Antimicrob Chemother 74:2588–2595. 10.1093/jac/dkz243. [DOI] [PubMed] [Google Scholar]
- 13.Papp-Wallace KM, Mack AR, Taracila MA, Bonomo RA. 2020. Resistance to novel β-lactam-β-lactamase inhibitor combinations: the “price of progress.” Infect Dis Clin North Am 34:773–819. 10.1016/j.idc.2020.05.001. [DOI] [PMC free article] [PubMed] [Google Scholar]
- 14.Wang Y, Wang J, Wang R, Cai Y. 2020. Resistance to ceftazidime-avibactam and underlying mechanisms. J Glob Antimicrob Resist 22:18–27. 10.1016/j.jgar.2019.12.009. [DOI] [PubMed] [Google Scholar]
- 15.Ho S, Nguyen L, Trinh T, MacDougall C. 2019. Recognizing and overcoming resistance to new beta-lactam/beta-lactamase inhibitor combinations. Curr Infect Dis Rep 21:39. 10.1007/s11908-019-0690-9. [DOI] [PubMed] [Google Scholar]
- 16.Clinical and Laboratory Standards Institute. 2012. Methods for dilution antimicrobial susceptibility tests for bacteria that grow aerobically; approved standard, 9th ed.CLSI document M07-A9. Clinical and Laboratory Standards Institute, Wayne, PA. [Google Scholar]
- 17.Blaser J. 1985. In-vitro model for simultaneous simulation of the serum kinetics of two drugs with different half-lives. J Antimicrob Chemother 15(Suppl A):125–130. 10.1093/jac/15.suppl_a.125. [DOI] [PubMed] [Google Scholar]
- 18.Davis JJ, Wattam AR, Aziz RK, Brettin T, Butler R, Butler RM, Chlenski P, Conrad N, Dickerman A, Dietrich EM, Gabbard JL, Gerdes S, Guard A, Kenyon RW, Machi D, Mao C, Murphy-Olson D, Nguyen M, Nordberg EK, Olsen GJ, Olson RD, Overbeek JC, Overbeek R, Parrello B, Pusch GD, Shukla M, Thomas C, VanOeffelen M, Vonstein V, Warren AS, Xia F, Xie D, Yoo H, Stevens R. 2020. The PATRIC Bioinformatics Resource Center: expanding data and analysis capabilities. Nucleic Acids Res 48:D606–D612. 10.1093/nar/gkz943. [DOI] [PMC free article] [PubMed] [Google Scholar]
- 19.Leary RH, Jelliffe R, Schumitzky A, Van Guilder M. 2001. An adaptive grid nonparametric approach to population pharmacokinetic/dynamic (PK/PD) population models, p 389–394. In Proceedings of the 14th IEEE Symposium on Computer-Based Medical Systems. IEEE, New York, NY. [Google Scholar]
- 20.Neely MN, van Guilder MG, Yamada WM, Schumitzky A, Jelliffe RW. 2012. Accurate detection of outliers and subpopulations with Pmetrics, a nonparametric and parametric pharmacometric modeling and simulation package for R. Ther Drug Monit 34:467–476. 10.1097/FTD.0b013e31825c4ba6. [DOI] [PMC free article] [PubMed] [Google Scholar]
- 21.D’Argenio DZ, Schumitzky A, Wang X. 2009. ADAPT 5 user’s guide: pharmacokinetic/pharmacodynamic systems analysis software. Biomedical Simulations Resource, Los Angeles, CA. [Google Scholar]
- 22.Drusano GL, Shields RK, Mtchedlidze N, Nguyen MH, Clancy CJ, Vicciarelli M, Louie A. 2019. Pharmacodynamics of ceftazidime plus avibactam against KPC-2 bearing isolates of Klebsiella pneumoniae in a hollow fiber infection model. Antimicrob Agents Chemother 63:e00462-19. 10.1128/AAC.00462-19. [DOI] [PMC free article] [PubMed] [Google Scholar]


