Abstract
The presence of iron in circulating monocytes is well known as they play an essential role in iron recycling. It has been demonstrated that the iron content of blood cells can be measured through their magnetic behavior; however, the magnetic properties of different monocyte subtypes remain unknown. In this study we report, for the first time, the magnetic behavior of classical, intermediate and non-classical monocytes, which may be related to their iron storage capacity. The magnetic properties of monocytes were compared to other blood cells, such as lymphocytes and red blood cells in the oxyhemoglobin and methemoglobin states, and a cancer cell type. For this analysis, we used an instrument referred to as Cell Tracking Velocimetry (CTV), which quantitatively characterizes the magnetic behavior of biological entities. Our results demonstrate that significant fractions of the intermediate and non-classical monocytes (up to 59% and 65% depending on the sample, respectively) have paramagnetic properties, suggesting their higher iron storage capacities. Moreover, our findings have implications for the immunomagnetic separation industry; we propose that negative magnetic isolation techniques for recovering monocytes from blood should be used with caution, as it is possible to lose magnetic monocytes when using this technique.
Keywords: monocytes, magnetic susceptibility, cell tracking velocimetry, immunomagnetic separation
Graphical Abstract
INTRODUCTION
Monocytes are circulating blood cells that account for fewer than 10% of the total number of leukocytes (Sprangers et al., 2016). Despite their low concentration in blood, they play important roles in the immune system (Kratofil et al., 2017), and their isolation with high purity is necessary for many research applications. Some of the techniques used to separate them from other cells in the blood are magnetic-based (Bhattacharjee et al., 2017), and rely on the assumption that these cells are “non-magnetic”. However, caution needs to be taken when separating monocytes with magnetic fields because the presence of iron in monocytes is well known as they are involved in iron recycling (Weiss, 2009). In our previous report (Kim et al., 2019), we characterized for the first time the magnetic behavior of CD14+ monocytes, presenting a new way to quantify iron storage through magnetic mobility, which has the potential to provide new insights into iron recycling pathways in clinical samples. By measuring the magnetic properties of human monocytes, platelets, and red blood cells (RBCs) in the oxyhemoglobin (oxyHb-RBCs) and methemoglobin (metHb-RBCs) states, we demonstrated that a monocyte fraction reported high magnetic mobility, suggesting the magnetic behavior of a monocyte subpopulation.
In humans, three circulating monocyte subsets are classified based on the expression levels of CD14 and CD16: classical (CD14++ CD16−), intermediate (CD14++ CD16+) and non-classical (CD14+ CD16++), with relative proportions of 85%, 5% and 10%, respectively. These subsets have distinct features: different half-lives in circulation, phagocytic activity, and production of inflammatory cytokines (Kawamura & Ohteki, 2018). As a result of these different phenotypes, their role in iron storage and recycling is presumably different. Nevertheless, the magnetic properties of the different monocyte subtypes remain unknown.
It has been suggested that it is possible that monocytes can be contaminated with attached platelets during CD14 sorting in a flow cytometer. In our previous work (Kim et al., 2019), we demonstrated that we could, in fact, by fluorescence-activated cell sorting (FACS), separate the monocytes into subfractions with and without attached platelets. Nevertheless, we independently separated platelets and demonstrated that platelets are not magnetic and no difference in the magnetic susceptibility was observed in these two subtypes (i.e. with and without attached platelets). Finally, it has also been suggested that, at least, one type of the monocyte subtypes, the non-classical, can be contaminated with NK and B cells during sorting if they are not gated out with appropriate markers (Marimuthu et al., 2018).
In this work, we report the magnetic behavior of the three monocyte subsets, which may be related to their ability to store iron, and further characterize these subtypes. Further, we compare the magnetic susceptibility of these monocyte subtypes to the magnetic susceptibility of other blood cells as well as a number of cancer cell types. We also discuss the implications of these magnetic susceptibilities to their separation using common magnetic cell separation systems, such as magnetic columns packed with spherical steel balls (i.e. MACS® Columns from Miltenyi Biotec).
EXPERIMENTAL SECTION
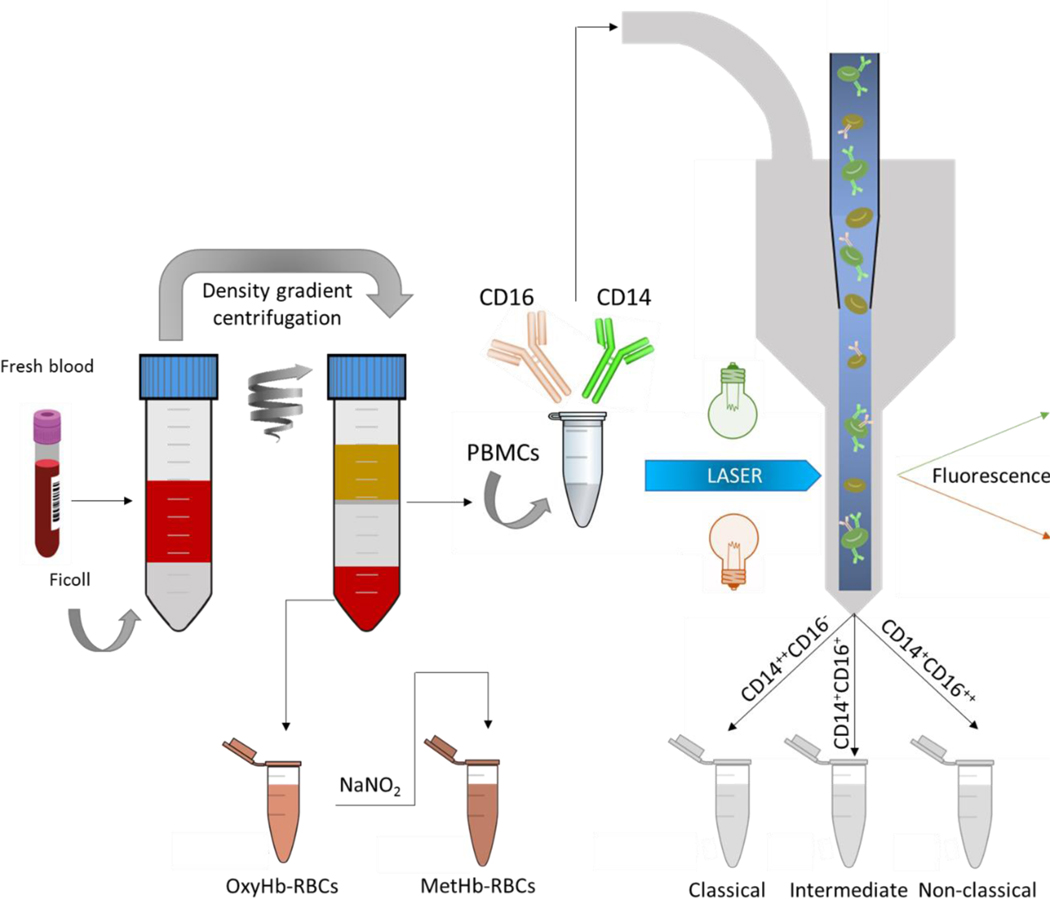
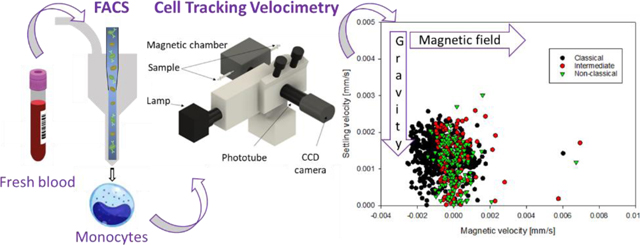
For the monocyte subset study, blood from five healthy subjects (two females and three males) was collected with informed consents according to a protocol approved by the Institutional Review Board from The Ohio State University (protocol 2018H0268). Peripheral blood mononuclear cells (PBMCs) and RBCs were collected from 40 mL of whole blood by performing a Ficoll density gradient centrifugation. RBCs were washed with phosphate buffered saline (PBS) and converted into metHb-RBCs via incubation with sodium nitrite (NaNO2), as presented in Figure 1.
Figure 1.
Sample preparation procedure. First, human fresh whole blood was separated into three fractions by density gradient centrifugation: i) plasma, ii) RBCs (oxyhemoglobin RBCs), and iii) PBMCs. The PBMCs were further processed by FACS targeting for monocyte subsets based on their different CD14 and CD16 expression levels. MetHb-RBCs were obtained by treating the oxyHb-RBCs with NaNO2. Afterward, the different populations were magnetically characterized on CTV. The samples were processed within 6 h of blood draw.
The three monocyte subsets were isolated from PBMCs by fluorescence-activated cell sorting using a BD FACS ARIA. Briefly, PBMCs (containing around 20 million monocytes) were washed with PBS and incubated with fluorochrome-conjugated antibodies: Alexa Fluor® 488 Mouse Anti-Human CD14 and PE-CF594 Mouse Anti-Human CD16. The three subsets were separated based on their CD14 and CD16 expression levels (Figure 1).
After flow sorting, and within 6 hours of blood draw, the magnetic behavior of the monocytes and the metHb-RBCs was assessed in an instrument referred to as Cell Tracking Velocimetry (CTV) (Jin et al., 2008). CTV characterizes the magnetically induced velocity (um) and gravity induced settling velocity (us) in a region of interest, where a high, and well characterized magnetic gradient in the horizontal direction is created. Once the cells are injected, horizontal and vertical velocities are measured, which can be related to specific cellular and magnetic field properties. More specifically, the magnetically and gravitationally induced velocities, um and us, can be described as follows:
| (1) |
| (2) |
where the subscripts cell and fluid refer to the cell and the suspending fluid, χ is the magnetic susceptibility, ρ is the density, D and V are the diameter and volume of a cell (particle), is the viscosity of the suspending fluid and g is the acceleration due to gravity (9.8 m/s2). Sm, the magnetic energy gradient, is defined by:
| (3) |
where μ0 and B are the permeability of free space and the magnetic flux density at the source. When Equation (1) is divided by Equation (2), one obtains:
| (4) |
Note that this ratio is no longer a function of the size (volume and diameter) of the cell nor the fluid viscosity (Park et al., 2019). Further rearranging leads to:
| (5) |
As presented in Equation (5), the magnetic susceptibility of a cell is the sum of the magnetic susceptibilities of its constituents (χi) multiplied by the volume fraction of those constituents, ∅i. Whereas the cell is primarily composed of water and biomass, certain constituents, such as Fe2+, Fe3+, ferritin, etc., can increase the susceptibility of the cell such that the cell could experience positive magnetophoresis when suspended in PBS and in the presence of a magnetic field gradient.
Thus, in this work, after introducing the different monocyte subsets and the metHb-RBCs into the CTV, images of the cells’ movement were captured and processed using an in-house analysis program for calculating um and us. With these data, the cell magnetic susceptibility was also calculated.
The purity of the sorted monocytes was assessed on CTV for one sample, by using dark field and fluorescence (with a 480 nm filter, to target the CD14 antibody conjugated to Alexa Fluor® 488) microscopy (Figure S1). More specifically, the magnetic behavior of CD14+ cells, bound with the anti-CD14 fluorochrome conjugate and observed under fluorescence, was compared to the cells tracked in dark field. Moreover, to determine if any NK and B cells contaminated the non-classical subfraction, a sample was incubated with APC Mouse Anti-Human HLA-DR (Figure S2) and further analyzed on CTV (Figure S3).
Additionally, previous works (Kim et al., 2019; Chalmers et al., 2010; Park et al., 2019; Melnik et al., 2001; Comella et al., 2001) that reported the magnetic properties of other cell types using CTV (lymphocytes, RBCs both in oxyHb and metHb state, cancer cells and magnetically labeled cells) are collected for analyzing and comparing the magnetic behavior of monocytes from other cells. Finally, differences in the magnetic velocity between the cell fractions were evaluated using Mann-Whitney U tests and ANOVA on ranks tests (SigmaPlot, Systat Software, San Jose, CA). These non-parametric tests were selected after performing normalcy tests (Shapiro-Wilk) on our data.
RESULTS & DISCUSSION
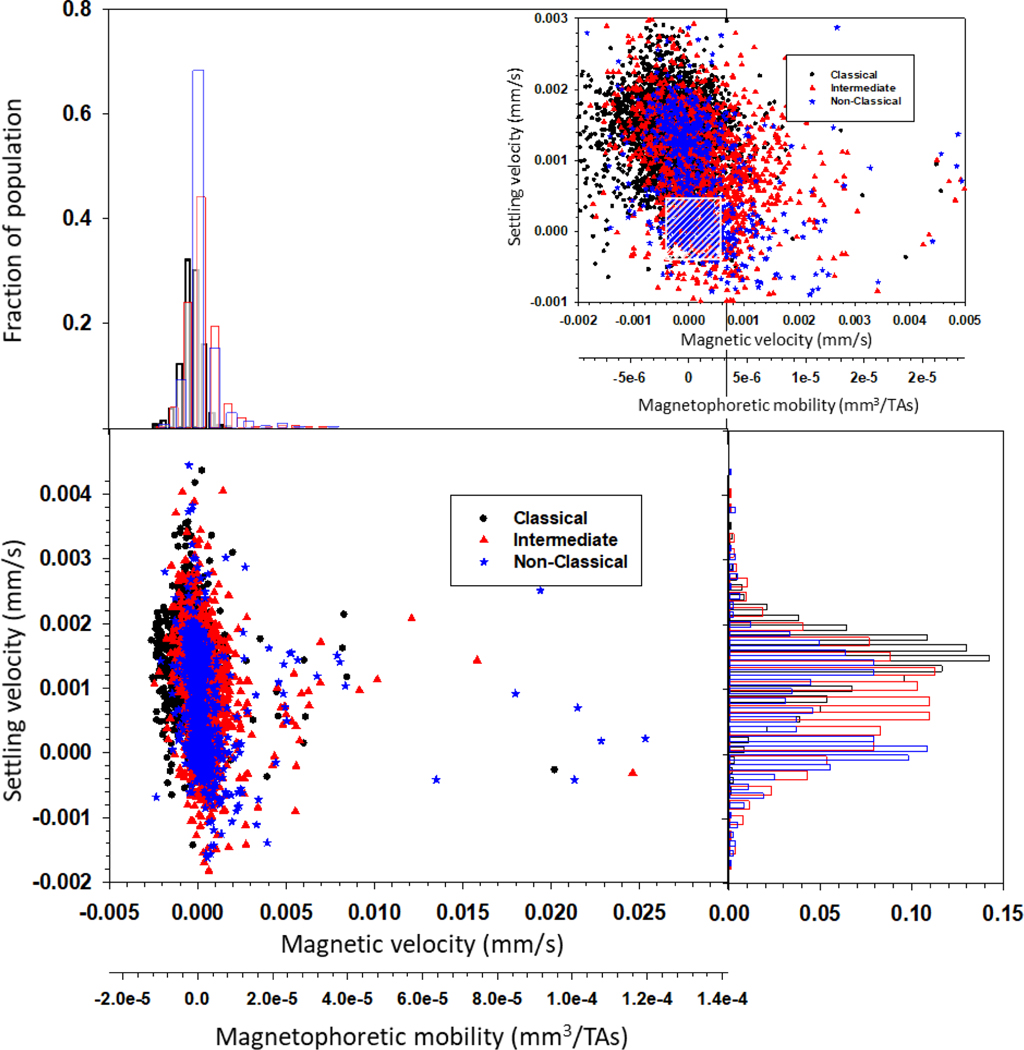
Figure 2 presents a dot plot for each of the three monocyte subtypes for the 5 donors, in terms of settling velocity versus magnetic velocity, and a secondary axis of magnetophoretic mobility. It should first be noted that the magnetophoretic mobility is a method to “normalize” a specific experiment by dividing the measured magnetic velocity by the specific value of Sm (the driving force) used in the experiment. Above and on the right hand side of the dot plot, histograms of the data are presented. Also, an enlarged range is presented surrounding the highest number density of cells. Moreover, Table 1 presents the comparisons between um and us for the monocyte subsets obtained from the five donors in this current study (Sample # 1–5). Inspection of the data for each donor indicates a significant variability in the mean magnetic velocity of the intermediate and non-classical monocytes; in contrast, the mean magnetic velocity of the classical monocytes is more consistent, and lower (presumably containing less iron) than the other two subtypes. The paramagnetic behavior of human monocyte subpopulations and the variability in the magnetic velocity between donors are consistent with our previous observations. The magnetic and gravitational settling velocities of human CD14+ monocytes from 10 donors (Sample # S1-S10; data modified from Kim et al. (2019)) are presented in Table S1. The magnetic velocities of the monocytes reported in Table S1 are also positive, and for some donors, slightly higher than the values reported in Table 1, which could be due to the different cell types presented in both tables. More specifically, Table S1 reports the values of CD14+ cells, and these represent a combination of classical, intermediate and non-classical monocytes and the ratios between these subsets are not known (and presumably very different from donor to donor). On the contrary, the cell samples reported in Table 1 represent the different subsets, which are previously sorted and then analyzed on CTV.
Figure 2.
CTV analysis of the monocyte subtypes. Dot plot showing the magnetic and settling velocities of individual cells, as well as the magnetophoretic mobility. Histograms are presented above and on the right of the dot plot. On the right top of the figure, an enlarged range is presented surrounding the highest number density of cells (the cross hatched box indicates the range of velocities where the standard error is the highest).
Table 1.
Magnetic (um) and gravitational settling (us) velocities of human monocyte subsets, classical, intermediate and non-classical (Sample # 1–5).
| Sample # | Classical (3385 cells) | Intermediate (1461 cells) | Non-classical (847 cells) | |||
|---|---|---|---|---|---|---|
| um ± SD (μm/s) | us ± SD (μm/s) | um ± SD (μm/s) | us ± SD (μm/s) | um ± SD (μm/s) | us ± SD (μm/s) | |
| 1 | −0.24 ± 0.58 | 1.5 ± 0.63 | 0.19 ± 1.13 | 1.02 ± 0.77 | | −0.13 ± 0.58 | 1.14 ± 0.89 |
| 2 | −0.17 ± 1.49 | 1.53 ± 0.51 | 0.35 ± 1.59 | 0.58 ± 0.79 | 0.63 ± 1.58 | 0.34 ± 0.57 |
| 3 | −0.7 ± 0.98 | 1.36 ± 0.51 | 0.23 ± 1.47 | 1.21 ± 0.83 | 0.66 ± 3.79 | 0.97 ± 0.80 |
| 4 | −0.37 ± 0.61 | 1.22 ± 0.50 | 0.49 ± 1.16 | 0.52 ± 0.76 | 0.38 ± 1.04 | 0.54 ± 0.86 |
| 5 | −0.16 ± 0.41 | 1.38 ± 0.53 | 1.19 ± 3.47 | 0.77 ± 1.41 | 2.16 ± 7.69 | −0.07 ± 1.05 |
| Average | −0.30 ± 0.76 | 1.39 ± 0.56 | 0.39 ± 1.75 | 0.89 ± 0.92 | 0.47 ± 2.59 | 0.68 ± 0.88 |
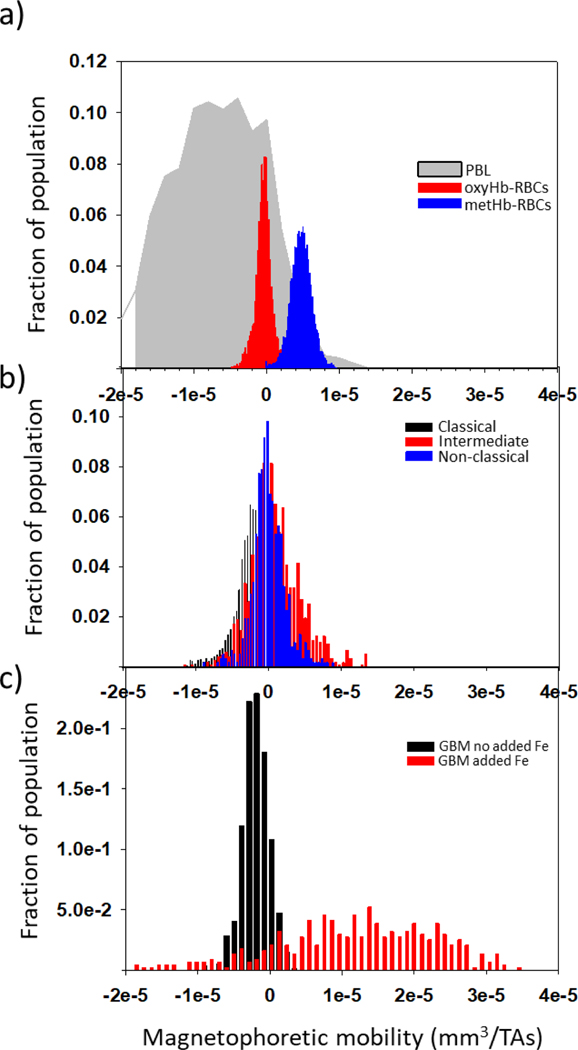
To provide a perspective on the value of these magnetic velocities/magnetophoretic mobilities to other cell types, Figure 3 is presented. Figure 3 a) presents previously published values of the magnetophoretic mobility of peripheral blood lymphocytes, PBL, oxyHb-RBCs, and metHb-RBCs (Chalmers et al., 2010; Kim et al., 2019). Figure 3 b) presents histograms of the three types of monocytes collected for this study, and Figure 3 c) presents the mobility of specimens of human glioblastoma (GBM) cells cultured in specific media (GBM no added Fe), and cultured with elevated iron concentrations (GBM added Fe) (Park et al., 2019). It can be observed that a fraction of the intermediate and non-classical monocytes have magnetophoretic mobilities equivalent to metHb-RBCs. Moreover, the results obtained from our statistical analysis (Tables S2 and S3) suggest that all blood cell types obtained from healthy donors (RBCs, lymphocytes and monocytes, including the individual monocyte subsets) are statistically different in terms of magnetic velocity (p<0.05).
Figure 3.
Magnetophoretic mobilities of blood cells obtained from healthy donors and cancer cells cultured in different media. a) Lymphocytes (PBL), oxyHb-RBCs, and metHb-RBCs; b) Subsets of monocytes collected for this study; c) Glioblastoma (GBM) cells cultured in a media containing and not containing iron.
With respect to settling velocity (i.e. size), an unusual observation (both in this study, and in our previously published study (Kim et al., 2019)) was made (dot plot and histograms from Figure 2). We found that, while the classical monocytes are the expected size, there are more than one size population of intermediate and non-classical monocytes. While at first thought a very low settling velocity is hard to interpret, we have previously published that, for the operating conditions and equipment used in our current CTV (i.e. the magnetic energy gradient, the magnification, the pixel density of the CCD camera, and other operational settings), the standard error will increase significantly when the velocity value of a tracked cell/particle is in the range between 0.0005 mm/s and −0.0005 mm/s. To highlight this range in velocities, a cross hatched box was added to Figure 2. Nakamura et al. (2001) experimentally demonstrated that this degradation of accuracy of the CTV tracking algorithm occurs when the cell/particle movement approaches one pixel during the specific tracking interval. For the current experiments this corresponds, approximately, to the area highlighted in the box.
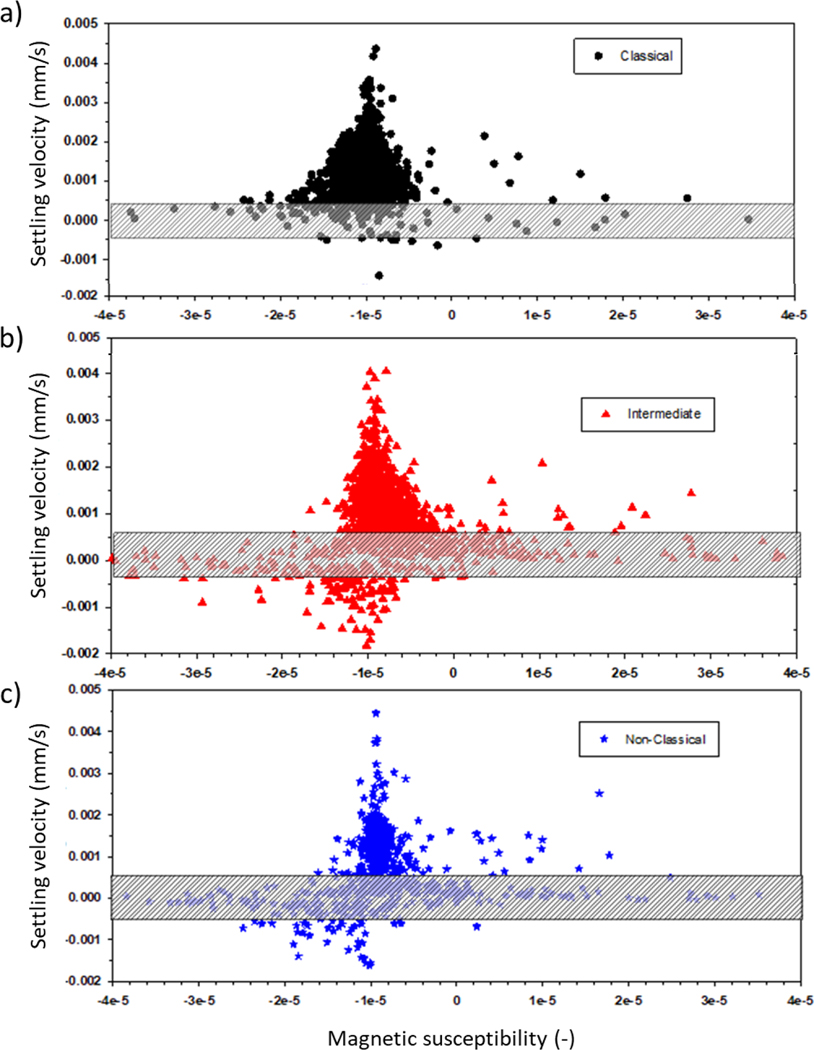
While the actual size of entities within the box is indeterminate, similar small entities were found in our previous work, reported by Kim et al. (2019), after CD14 flow cytometry sorting using a Coulter Counter size/concentration analyzer. Since many of these smaller entities still had significant magnetic velocity, (Equation 5) was used to determine the magnetic susceptibility (volume susceptibility, which is dimensionless in SI units) of all of the cells and these small entities. It should be noted that the magnetic susceptibility is independent to the cell/entity size, and only a function of the concentration of the magnetic material within the cells/entity. Figure 4 presents dot plots of the settling velocity as a function of the magnetic susceptibility of the cell/entity. It is quite clear that, for many but not all of the intermediate and non-classical monocytes, as the cell gets smaller, the average magnetic susceptibility increases. As stated above, care needs to be taken in interpreting these results since the performance of the CTV reporting settling velocity increases as the cell/particle travels more pixels in a given time. In fact, the lowest, non-zero velocity that CTV can detect is a velocity in which the center of the particle/cell moves 1 pixel over 5 sequential frames. To facilitate identifying this region of settling velocity, a shaded box is added to each of the panels reported in Figure 4. Nevertheless, a clear trend is apparent.
Figure 4.
Settling velocity (proportional to the size of the cells) as a function of the volumetric magnetic susceptibility. a) Classical monocytes; b) Intermediate monocytes; c) Non-classical monocytes. The cross hatched boxes indicate the range of velocities where the standard error is the highest.
On the other hand, Table 2 presents the value obtained for the magnetic susceptibility difference between the three monocyte subsets and the PBS in which they are suspended (Samples 1–5). This table also reports the percentage of cells in each fraction with positive Δχ or (χcell - χfluid) > 0. Whereas this percentage is not particularly high for the classical subtype, it reaches high values for the intermediate and non-classical subtypes, being higher than 50% in some cases. This implies that these cells will experience positive magnetophoresis when suspended in PBS in the presence of a magnetic field and a magnetic field gradient, and therefore, they are susceptible to be separated magnetically.
Table 2.
Magnetic susceptibility difference (Δχ) between the human monocyte subsets and the surrounding fluid (PBS). Whereas all the cell types report negative magnetic susceptibilities (χcell <0), Δχ (χcell − χfluid) is positive for some of the intermediate and non-classical subsets. This implies that these cells will experience positive magnetophoresis when suspended in PBS and in the presence of a magnetic field and a magnetic field gradient. The percentage of cells with susceptibilities higher than that of the fluid is also reported.
| Sample # | Classical | Intermediate | Non-classical | |||
|---|---|---|---|---|---|---|
| Δχ × 106 | % of cells with Δχ > 0 | Δχ × 106 | % of cells with Δχ > 0 | Δχ × 106 | % of cells with Δχ > 0 | |
| 1 | −0.58 | 24.8 | −1.59 | 55.5 | −3.81 | 24.5 |
| 2 | −1.54 | 33.6 | 22.25 | −36.23 | 64.7 | |
| 3 | −2.24 | 24.3 | 0.52 | 45.6 | 3.24 | 42.0 |
| 4 | −1.32 | 22.5 | 4.19 | 44.1 | 8.08 | 41.2 |
| 5 | −0.78 | 34.1 | −3.24 | 58.9 | −2.05 | 35.9 |
| Average | −1.12 | 27.9 | 1.26 | 53.4 | −3.47 | 42.2 |
Regarding the possible contamination of monocyte subsets with other cell types, such as lymphocytes, Figure S1 presents a comparison between the reported velocities of sorted monocytes using CTV on dark field and fluorescence mode (with a 480 nm filter, to target the anti-CD14 antibody conjugated to Alexa Fluor® 488). It can be seen that CTV measured nearly identical um for cells under dark field and fluorescence imaging modes (5% discrepancy in the magnetic velocity). This result implies that the cells injected in the system were monocytes. Moreover, Figure S3 presents an additional sample incubated with HLA-DR (to ensure that there was no contamination of non-classical cells with lymphocytes, as presented in Figure S2). This figure reveals the same results, that non-classical cells possess the highest magnetic velocity, followed by intermediate monocytes.
A comparison of the magnetic velocity between the monocyte subtypes and the metHb-RBCs obtained from the same blood samples was additionally carried out. The results (Figure S4) suggest that the magnetic velocity of the metHb-RBCs is similar for all the samples, with an average velocity of 1 μm/s. Although for some samples (such as sample #5, see Table 1), the non-classical monocytes reported a magnetic velocity as high as 2 μm/s, a high non-classical monocyte um is not correlated to a high metHb-RBCs velocity. Thus, there might not exist a relationship between the amount of iron in RBCs and the magnetic behavior of the monocyte subsets. Based on these observations, and our recent publication on further characterization of the mobility of RBCs (Kim et al., 2020), we suggest that these subsets have different magnetic and settling velocities due to their different physical properties; however, the RBC populations from the different donors report similar characteristics.
Our findings suggesting the paramagnetic behavior of monocytes in PBS have implications for the immunomagnetic separation industry. A fundamental criteria for any identification and/or separation technology is the ability to distinguish between the signal of the targeted entity and the background noise. In the case of magnetic separations, especially when one is labeling the targeted cell with an antibody conjugated to a magnetic particle (i.e. MACS® MicroBead Technology from Miltenyi Biotec), one assumes that the targeted, labeled cell has a higher magnetic mobility than the unlabeled cells. We have previously evaluated, and attempted to optimize, immunomagnetic labeling for both commercial magnetic cell separation systems (Miltenyi MACS system), as well as our own, flow-through separation systems (Comella et al., 2001; Melnik et al., 2001; Chosy et al., 2003; Lara et al., 2006; Zhang et al., 2006).
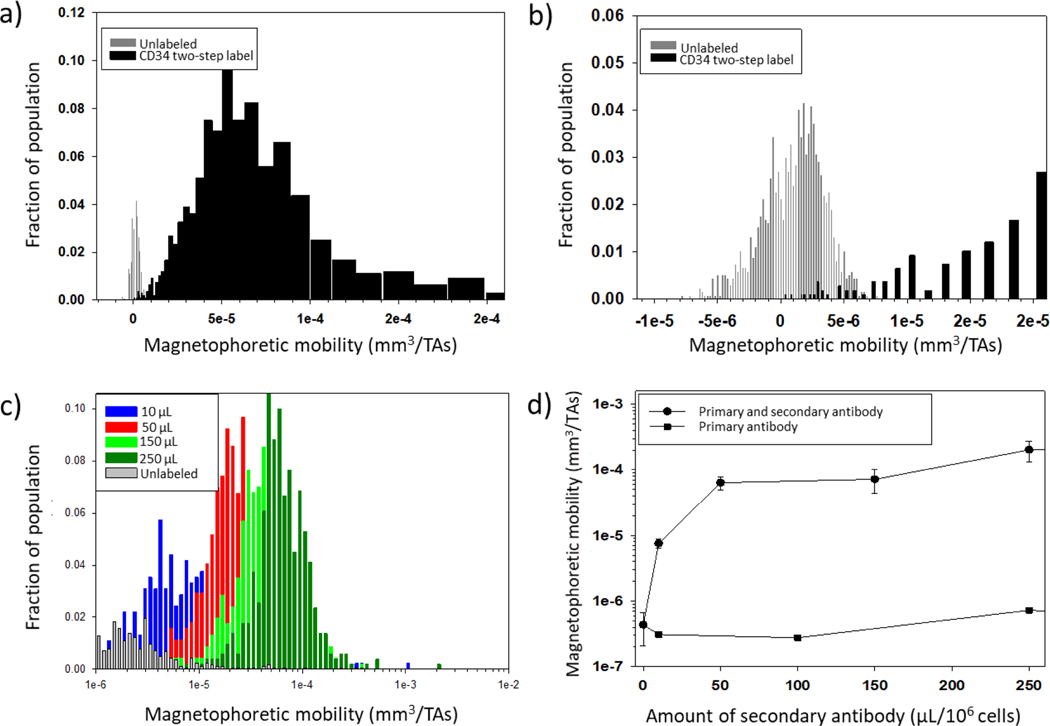
In fact, in the study reported by Melnik et al. (2001), which used fresh, human cord blood, and followed Miltenyi Biotec (Auburn, CA) protocols, it was recognized that the performance of the enrichment/recovery/purity of rare CD34+ cells from cord blood was inconsistent, and not optimal, when the results were evaluated using flow cytometry analysis of the feed and the separated fractions. A number of reasons were suggested at the time for this suboptimum performance, including incomplete magnetic labeling of the targeted cells and monocytes phagocytosing the magnetic particles (another study has reported significant magnetic mobilities of macrophages after phagocytizing magnetic particles (Pamme & Wilhelm, 2006)). Figures 5 a) and b) present histograms of the magnetophoretic mobility of the unlabeled cord blood and the mobility of a positive fraction (twice separated in a MACS column) of the immunomagnetically labeled CD34 cells. It can be noticed, especially in the enlarged inset in Figure 5 b), that an overlap in mobilities in the histograms of unlabeled and magnetically labeled cells exists. It is highly likely that magnetic monocytes were in the magnetically labeled fraction, which would then have stained negative for the CD34 flouroprobe when evaluated with flow cytometry.
Figure 5.
Implication of the presence of magnetic monocytes in the immunomagnetic separation of other cells. a) and b) Immunomagnetic separation of CD34 positive cells, adapted from Melnik et al. (2001): histograms of the magnetophoretic mobility of unlabeled (gray) and immunomagnetic labeled cells after separation (note the overlap in mobilities); c) and d) CD56 separation from PBLs (Comella et al., 2001): the amount of the secondary label (anti-PE MACS bead conjugate), in μL/106 cells is presented. Since the magnetophoretic mobility is greatly increased as the amount of label is increased, the x-axis in Figure 5 c) and y-axis in Figure 5 d) are presented in log scale.
Another striking observation is the study by Comella et al. (2001). In this study, CD56+ cells were targeted in human peripheral blood lymphocytes, PBLs, using a two-step antibody labeling protocol; primary antibody: anti-CD56-PE conjugate, and a secondary anti-PE MACS bead conjugate (at the time Miltenyi Biotec did not have a commercially available anti-CD56 MACS bead conjugate). Figure 5 c) presents histograms of unlabeled PBLs, and various secondary antibody labeling amounts (per 106 cells). Figure 5 d) presents the resultant magnetophoretic mobility as a function of the used amount of the secondary antibody. One can clearly observe from Figure 5 c) that the peak of the immunomagnetically labeled cells moves to the right with increasing labeling amounts. In fact, the shift is so significant that a logarithmic scale on the x-axis is used. Several notable observations should be made. First, just as with the cord blood presented in Figures 5 a) and b), the unlabeled cells have a small, but noticeable positive magnetic mobility populations, of similar mobility to the populations presented in this current study (Figure 2). Second, only when a high level of antibody-bead conjugate (much higher than what is typically recommended) is used, is the overlap in mobilities removed.
These results demonstrate that care should be taken when interpreting immunomagnetic separations. Obviously, immunomagnetic separations are widely popular, and in general, very effective. However, these data suggest that, depending on the type of separation conducted, “magnetic monocytes” could be present when one expects only magnetically labeled cells. Conversely, one might “lose” magnetic monocytes to the magnetic fraction when expecting to recover all of the monocytes in the negative separation fraction (i.e. a depletion separation). Nevertheless, these “magnetic” monocytes present, on average, lower magnetic mobilities than a labeled cell (see Figure 5). Moreover, since monocytes are a relatively small fraction of all the nucleated cells in blood, this potential “magnetic monocyte” contamination is typically a small fraction of the targeted cell population. For example, Darabi & Guo (2006) reported a fraction of lost cells when trying to recover monocytes by using negative magnetic isolation techniques (they did not label the monocytes and assumed that they would be in the negative fraction), and this loss was more pronounced when the magnetic force was high (in comparison to the hydrodynamic drag force), which would be consistent with our current findings. While one might consider a Miltenyi MACS® column a low magnetic force separation, in fact, there are small zones within the column packing that have very high magnetic energy gradients, strong enough to be able to separate RBCs without magnetic labeling, which would easily capture the magnetic monocytes that we have documented in this report. In a different study, Bhattacharjee et al. (2017) reported that monocytes isolated with negative and positive magnetic sorting techniques showed different molecular characteristics and immunophenotypic behavior. They suggested that positive isolation affects functionality, but a comparison of the CD14/CD16 levels in the recovered cells between the two methods was not carried out. In contrast, a different study has suggested that the subset distribution does not significantly differ after monocytes are separated by negative depletion (Fendl et al., 2019). Since only a small percentage of monocytes are intermediate and non-classical, and only a fraction of these are slightly more magnetic than PBS (see Table 2), it is likely that the subset distribution does not vary much after negative depletion if low magnetic fields and low magnetic field gradients are employed.
CONCLUSION
It is known that human monocytes are involved in iron recycling, but very little attention has been paid to their magnetic properties. In fact, monocytes have been considered “non-magnetic”, and different magnetic isolation techniques have been developed based on this assumption. In this study, we report the magnetic character of human monocytes by using CTV, which has the ability to track the movement of thousands of individual cells in response to an applied magnetic field. Our results confirm that the only monocyte subset that can be considered “non-magnetic” (i.e. its average magnetic susceptibility is not greater than that of water) is the classical subset, implying that non-classical and intermediate monocytes have higher iron storage capacities. This could, potentially, be attributed to at least two factors: i) the longer circulating half-lives of non-classical and intermediate monocytes, since they spend more time in circulation accumulating more iron from senescent RBCs (Kawamura & Ohteki, 2018), and/or ii) their inability to release iron for recycling. Regarding the second argument, a recent study has reported that classical monocytes expressed by far the highest levels of the surface protein ferroportin (the sole known mammalian iron export protein) among monocyte subpopulations (Haschka et al., 2019).
Our findings demonstrating the paramagnetic behavior of monocytes have implications for the immunomagnetic separation of cells from blood. First, these results suggest that, when performing immunomagnetic labeling for the separation of non-monocyte cells from blood, “magnetic monocytes” could be present when one expects only magnetically labeled non-monocytic cells. Second, paramagnetic monocytes might be lost to the magnetic fraction when performing negative isolation separations. Another question to address is whether the magnetic properties of monocytes change for patients with blood diseases. The most important iron uptake mechanism of monocytes is phagocytosis of senescent RBCs (Kim et al., 2019). Thus, monocytes may contain higher iron concentration in patients suffering from RBC diseases, such as sickle cell anemia and β-thalassemia. Future studies will focus on addressing these questions and on the analysis of monocytes obtained from patients suffering from blood-related diseases.
ACKNOWLEDGMENTS
We wish to thank the National Heart, Lung, and Blood Institute (1R01HL131720-01A1) for financial assistance.
Footnotes
Publisher's Disclaimer: This is a PDF file of an unedited manuscript that has been accepted for publication. As a service to our customers we are providing this early version of the manuscript. The manuscript will undergo copyediting, typesetting, and review of the resulting proof before it is published in its final form. Please note that during the production process errors may be discovered which could affect the content, and all legal disclaimers that apply to the journal pertain.
The magnetic behavior of the three human monocyte subsets is reported
The only subset that can be considered diamagnetic is the classical subtype
The non-classical and intermediate monocytes have high magnetic susceptibilities
REFERENCES
- Bhattacharjee J, Das B, Mishra A, Sahay P, & Upadhyay P. (2017). Monocytes isolated by positive and negative magnetic sorting techniques show different molecular characteristics and immunophenotypic behavior. F1000Research, 6, Article 2045. doi: 10.12688/f1000research.12802.3 [DOI] [PMC free article] [PubMed] [Google Scholar]
- Chalmers JJ, Xiong Y, Jin X, Shao M, Tong X, Farag S, & Zborowski M. (2010). Quantification of non-specific binding of magnetic micro- and nanoparticles using cell tracking velocimetry: Implication for magnetic cell separation and detection. Biotechnology and Bioengineering, 105, 1078–1093. doi: 10.1002/bit.22635 [DOI] [PMC free article] [PubMed] [Google Scholar]
- Chosy EJ, Nakamura M, Melnik K, Comella K, Lasky LC, Zborowski M, & Chalmers JJ (2003). Characterization of antibody binding to three cancer-related antigens using flow cytometry and cell tracking velocimetry. Biotechnology and Bioengineering, 82, 340–351. 10.1002/bit.10581 [DOI] [PubMed] [Google Scholar]
- Comella K, Nakamura M, Melnik K, Chosy J, Zborowski M, Cooper MA, Fehniger TA, Caligiuri MA, & Chalmers JJ (2001). Effects of antibody concentration on the separation of human natural killer cells in a commercial immunomagnetic separation system. Cytometry, 45, 285–293. [DOI] [PubMed] [Google Scholar]
- Darabi J, & Guo C. (2016). Continuous isolation of monocytes using a magnetophoretic-based microfluidic chip. Biomedical Microdevices, 18, Article 77. doi: 10.1007/s10544-016-0105-8 [DOI] [PubMed] [Google Scholar]
- Fendl B, Weiss R, Eichhorn T, Spittler A, Fischer MB, & Weber V. (2019). Storage of human whole blood, but not isolated monocytes, preserves the distribution of monocyte subsets. Biochemical and Biophysical Research Communications, 517, 709–714. 10.1016/j.bbrc.2019.07.120 [DOI] [PubMed] [Google Scholar]
- Haschka D, Petzer V, Kocher F, Tschurtschenthaler C, Schaefer B, Seifert M, Sopper S, Sonnweber T, Feistritzer C, Arvedson TL, Zoller H, Stauder R, Theurl I, Weiss G, & Tymoszuk P. (2019). Classical and intermediate monocytes scavenge non-transferrin-bound iron and damaged erythrocytes. JCI Insight, 4, Article e98867. doi: 10.1172/jci.insight.98867 [DOI] [PMC free article] [PubMed] [Google Scholar]
- Jin X, Zhao Y, Richardson A, Moore L, Williams PS, Zborowski M, & Chalmers JJ (2008). Differences in magnetically induced motion of diamagnetic, paramagnetic, and superparamagnetic microparticles detected by cell tracking velocimetry. Analyst, 133, 1767–1775. 10.1039/B802113A [DOI] [PMC free article] [PubMed] [Google Scholar]
- Kawamura S, & Ohteki T. (2018). Monopoiesis in humans and mice. International Immunology, 30, 503–509. 10.1093/intimm/dxy063 [DOI] [PubMed] [Google Scholar]
- Kim J, Gómez-Pastora J, Weigand M, Potgieter M, Walters NA, Reátegui E, Palmer AF, Yazer M, Zborowski M, & Chalmers JJ (2019). A subpopulation of monocytes in normal human blood has significant magnetic susceptibility: Quantification and potential implications. Cytometry Part A, 95, 478–487. 10.1002/cyto.a.23755 [DOI] [PMC free article] [PubMed] [Google Scholar]
- Kim J, Gómez-Pastora J, Gilbert CJ, Weigand M, Walters NA, Reátegui E, Palmer AF, Yazer M, Zborowski M, & Chalmers JJ (2020). Quantification of the mean and distribution of hemoglobin content in normal human blood using cell tracking velocimetry. Analytical Chemistry, 92, 1956–1962. 10.1021/acs.analchem.9b04302 [DOI] [PubMed] [Google Scholar]
- Kratofil RM, Kubes P, & Deniset JF (2017). Monocyte conversion during inflammation and injury. Arteriosclerosis, Thrombosis, and Vascular Biology, 37, 35–42. 10.1161/ATVBAHA.116.308198 [DOI] [PubMed] [Google Scholar]
- Lara O, Tong X, Zborowski M, Farag SS, & Chalmers JJ (2006). Comparison of two immunomagnetic separation technologies to deplete T cells from human blood samples. Biotechnology and Bioengineering, 94, 66–80. DOI: 10.1002/bit.20807 [DOI] [PubMed] [Google Scholar]
- Marimuthu R, Francis H, Dervish S, Li SCH, Medbury H, & Williams H. (2018). Characterization of human monocyte subsets by whole blood flow cytometry analysis. Journal of Visualized Experiments, 140, Article e57941. doi: 10.3791/57941 [DOI] [PMC free article] [PubMed] [Google Scholar]
- Melnik K, Nakamura M, Comella K, Lasky LC, Zborowski M, & Chalmers JJ (2001). Evaluation of eluents from separations of CD34+ cells from human cord blood using a commercial, immunomagnetic cell separation system. Biotechnology Progress, 17(5), 907–916. 10.1021/bp010079r [DOI] [PubMed] [Google Scholar]
- Nakamura M, Zborowski M, Lasky LC, Margel S, & Chalmers JJ (2001). Theoretical and experimental analysis of the accuracy and reproducibility of cell tracking velocimetry. Experiments in Fluids, 30, 371–380. 10.1007/s003480000211 [DOI] [Google Scholar]
- Pamme N, & Wilhelm C. (2006). Continuous sorting of magnetic cells via on-chip free-flow magnetophoresis. Lab on a Chip, 6, 974–980. DOI: 10.1039/b604542a [DOI] [PubMed] [Google Scholar]
- Park KJJ, Kim J, Testoff T, Adams J, Poklar M, Zborowski M, Venere M, & Chalmers JJ (2019). Quantitative characterization of the regulation of iron metabolism in glioblastoma stem‐like cells using magnetophoresis. Biotechnology and Bioengineering, 116, 1644–1655. doi: 10.1002/bit.26973 [DOI] [PMC free article] [PubMed] [Google Scholar]
- Sprangers S, de Vries TJ, & Everts V. (2016). Monocyte heterogeneity: Consequences for monocyte-derived immune cells. Journal of Immunology Research, 2016, Article 1475435. doi: 10.1155/2016/1475435 [DOI] [PMC free article] [PubMed] [Google Scholar]
- Weiss G. (2009). Iron metabolism in the anemia of chronic disease. Biochimica et Biophysica Acta, 1790, 682–693. doi: 10.1016/j.bbagen.2008.08.006 [DOI] [PubMed] [Google Scholar]
- Zhang H, Williams PS, Zborowski M, & Chalmers JJ (2006). Binding affinities/avidities of antibody-antigen interactions: Quantification and scale-up implications. Biotechnology and Bioengineering, 95, 812–829. DOI: 10.1002/bit.21024 [DOI] [PubMed] [Google Scholar]


