

Abstract
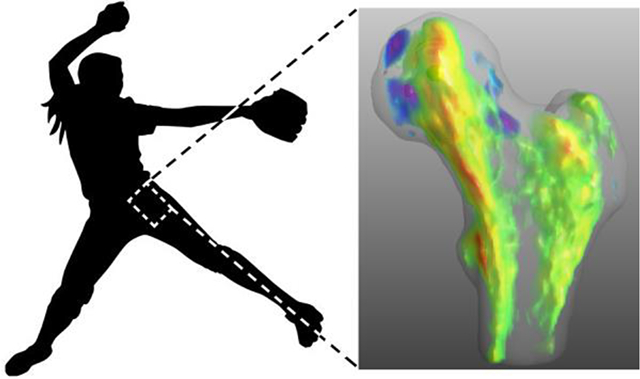
Physical activity enhances proximal femur bone mass, but it remains unclear whether the benefits translate into an enhanced ability to resist fracture related loading. We recently used baseball pitchers as a within-subject controlled model to demonstrate physical activity induced proximal femur adaptation in regions associated with weight bearing and increased strength under single-leg stance loading. However, there was no measurable benefit to resisting common injurious loading (e.g. a fall onto the greater trochanter). A lack of power and a small physical activity effect size may have contributed to the latter null finding. Softball pitchers represent an alternative within-subject controlled model to explore adaptation of the proximal femur to physical activity, exhibiting greater dominant-to-nondominant (D-to-ND) leg differences than baseball pitchers. The current study used quantitative computed tomography, statistical parametric mapping, and subject-specific finite element (FE) modeling to explore adaptation of the proximal femur to physical activity in female softball pitchers (n=25). Female cross-country runners (n=15) were included as symmetrically loaded controls, showing very limited D-to-ND leg differences. Softball pitchers had D-to-ND leg differences in proximal femur, femoral neck, and trochanteric volumetric bone mineral density and content, and femoral neck volume. Voxel-based morphometry analyses and cortical bone mapping showed D-to-ND leg differences within a large region connecting the superior femoral head, inferior femoral neck and medial intertrochanteric region, and within the greater trochanter. FE modeling revealed pitchers had 19.4% (95%CI, 15.0 to 23.9%) and 4.9% (95%CI, 1.7 to 8.2%) D-to-ND leg differences in predicted ultimate strength under single-leg stance loading and a fall onto the greater trochanter, respectively. These data affirm the spatial and strength adaptation of the proximal femur to weight bearing directed loading and demonstrate that the changes can also have benefits, albeit smaller, on resisting loads associated with a sideways fall onto the greater trochanter.
Keywords: exercise, falls, femoral neck fracture, osteoporosis, finite element analysis, statistical parametric mapping
Graphical Abstract
INTRODUCTION
Osteoporotic fractures of the proximal femur remain a significant problem. Optimizing peak bone mass when young may reduce osteoporotic fracture risk, with fracture risk doubling for each standard deviation of bone lost from mean peak values.1 Physical activity is advocated to optimize peak bone mass;2 however, it remains unclear whether the bone mass benefits of physical activity translate into an enhanced ability of the proximal femur to resist fracture related loading.3
The proximal femur is most susceptible to fracture during impact from a fall onto the greater trochanter.4,5 During such a fall, the strain pattern within the proximal femur is reversed from that experienced during typical locomotor activities. During gait, the thick inferior cortex of the femoral neck experiences greater compressive strains than those experienced at the thinner superior cortex.6–8 In contrast, during a sideways fall the superior cortex of the femoral neck is exposed to greatest strain,7–10 with in vitro simulated falls onto the greater trochanter causing fracture initiation within the superior neck region.11,12
Studies using three-dimensional (3D) imaging techniques have explored adaptation of the superior femoral neck to physical activity, but findings remain inconclusive.13–17 Some studies suggested physical activity may positively influence the superior femoral neck,13,14 whereas others reported no effect.15–17 We recently compared the dominant (D) (i.e. leg contralateral to the throwing arm) and nondominant (ND) legs in baseball pitchers finding that volumetric bone mineral density (vBMD) in the D leg was increased along a line connecting the superomedial femoral head, inferior femoral neck, and medial intertrochanteric regions.17 These regions are thought to support and transmit weight-bearing directed loads,6–8 with pitchers exhibiting enhanced estimated strength to loading in a single-leg stance direction.17 However, pitchers showed no measurable adaptation at the superior cortex of the femoral neck or benefit to estimated ultimate strength under impact from a fall.17 It is possible our initial study was underpowered and the magnitude of D-to-ND leg differences in baseball pitchers were below measurable levels. From an engineering perspective, adaptation at the inferior femoral neck should confer strength benefits when bending the femoral neck even in the absence of adaptation at the superior neck by helping to support the stress inferiorly.
The current study aimed to further explore adaptation of the proximal femur to physical activity by exploring D-to-ND leg differences in softball pitchers. Softball pitchers are exposed to greater D-to-ND leg differences in loading than baseball pitchers18 and exhibit greater and distinct D-to-ND leg differences in dual-energy x-ray absorptiometry (DXA) derived femoral neck bone properties.19 We theorized the greater and distinct adaptation of the proximal femur in softball pitchers compared to baseball pitchers would more optimally reveal the benefit of this physical activity. Outcomes included quantitative computed tomography (QCT) derived bone parameters, statistical parametric mapping (SPM) to localize D-to-ND differences in bone properties, and subject-specific finite element (FE) modeling to estimate proximal femur strength under loads during single-leg stance and a fall onto the greater trochanter. In addition, D-to-ND leg differences in bone parameters at the proximal femoral diaphysis were assessed. Athletic control subjects (cross-country runners) were included to assess for D-to-ND leg differences in individuals who do not differentially load the lower extremities.
MATERIALS AND METHODS
Study design and participants
A within-subject controlled cross-sectional study design was used to compare bilateral proximal femur properties in female softball pitchers (‘pitchers’) and cross-country runners (‘controls’). Individuals were eligible if they were aged 18–25 years, in good general health, and currently competing or practicing in National Collegiate Athletic Association (Division I, II or III level) softball or cross-country. Controls were included if they did not have a past history of participating more than twice per month for >6 months in an activity that may expose the lower extremities to asymmetrical loading (e.g. soccer, fencing, ten-pin bowling, baseball, softball, etc.). Exclusion criteria for both groups were: 1) known bone disease; 2) history of a femoral fracture or stress fracture, and; 3) exposure to lower extremity immobilization for more than 2 weeks within the past 2 years. Leg dominance was defined as the leg opposite the pitching arm (pitchers) or preferred throwing arm (controls). Height (to the nearest 0.1 cm) and weight (to the nearest 0.1 kg) were measured without shoes using a calibrated stadiometer (Seca 264; Seca GmbH & Co., Hamburg, Germany) and scale (MS140-300; Brecknell, Fairmont, MN), respectively. Age of menarche was self-reported. The study was approved by the Institutional Review Board and Machine Produced Radiation Safety Committee of Indiana University, and participants provided written informed consent.
Dual-energy x-ray absorptiometry (DXA)
A whole-body DXA scan (Discovery-W machine with Apex v2.3 software; Hologic, Inc., Waltham, MA, USA) was performed using the manufacturer’s standard scan and positioning protocol to acquire whole-body areal BMD (g/cm2), and whole-body lean (kg) and percent fat (%) mass.
Quantitative computed tomography
Bilateral proximal femurs were imaged during a single pelvic scan on a multislice CT scanner (Biograph128 mCT; Siemens Healthcare, Knoxville, TN) operating at 120 kVp, 320 mAs, 128×0.6 collimation, and pitch 0.8. The scan region spanned from 1 cm superior to the acetabulum to 5 cm distal to the lesser trochanter. A calibration phantom was included containing calcium hydroxyapatite standards embedded in water-equivalent resin (QCT-Bone Mineral Phantom; Image Analysis, Inc., Columbia, KY). Images were axially reconstructed at 1.0 mm slice thickness using a B60s convolution kernel, 512×512 matrix, and reconstruction diameter of 50 cm (reconstructed voxel size = 0.976 × 0.976 × 1.0 mm3). The linear relationship between Hounsfield Units and densities of the standards within the phantom were used to determine voxel bone mineral density values (mg/cm3).
Proximal femur properties
Proximal femur vBMD, bone mineral content (BMC), and volume were computed using semi-automated software.20 QCT images were reformatted along the femoral neck axis, and a region growing algorithm applied to extract the proximal femur from the surrounding tissue. Three measurement regions were automatically defined encompassing the total proximal femur (minus femoral head), femoral neck, and lesser and greater trochanters. Integral (i.e., cortical + trabecular), cortical, and trabecular vBMD, BMC, and volume were computed within each region. We have observed root mean square coefficients of variation (RMS-CVs) of ≤1.83% for CT-based measures of vBMD and volume for duplicate scans in 22 individuals.21
Proximal femur voxel- and vertex-based analyses
Statistical parametric mapping was used to assess for localized D-to-ND leg differences in the spatial distribution of bone properties in pitchers. Voxel-based morphometry was used for vBMD,22 and cortical bone mapping for cortical vBMD (Ct.vBMD), cortical thickness (Ct.Th),21 and vBMD in a layer adjacent to the endosteal surface (EndoTb.vBMD).23 Proximal femur images from the nondominant leg were mirrored to the dominant leg, and the segmented bones spatially normalized to a minimum deformation template. The spatial normalizations reduced the anatomical variability among the femora, effectively establishing anatomical correspondences locally. The computed transformations were then applied to the vBMD maps and surface-based maps of Ct.vBMD, Ct.Th and EndoTb.vBMD enabling voxel-wise and vertex-wise D-to-ND leg comparisons. Registrations to build the minimum deformation template and for the spatial normalizations included affine and nonlinear transformations. We measured RMS-CVs of <4% and small absolute precision errors for surface-based mean Ct.vBMD and Ct.Th for duplicate scans in 22 individuals.21
Proximal femur finite element modeling
Proximal femur strength in pitchers under load conditions of single-leg stance and a fall onto the posterolateral aspect of the greater trochanter were estimated using FE models, as previously described.24–29 Heterogeneous linear elastic and nonlinear post-yield material properties computed from the CT-measured vBMD were used to describe the stress-strain relationship for each 3-mm cube of bone represented by a linear hexahedral finite element.25,29 Ultimate strength was estimated by incrementally applying displacement to the femoral head while allowing motion in the direction perpendicular to the displacement. The distal end was fully constrained. For stance loading, displacement was applied within the coronal plane at 20 degrees to the shaft axis. For fall loading, displacement was applied at 35 degrees to the coronal plane and 80 degrees to the shaft axis. The surface of the greater trochanter opposite to the loaded surface of the femoral head was constrained in the direction of displacement while allowing motion perpendicular to the displacement. As displacement on the femoral head was incrementally applied, element stress and strain were computed using the individual element’s stress-strain relationship in conjunction with the von Mises yield criterion. The reaction force on the femoral head was computed at each increment, which resulted in a computed force versus displacement curve for the proximal femur. According to established engineering principles, the FE-computed proximal femur strength was the maximum FE-computed force on the femoral head. To more deeply evaluate the fracture process under fall loading, the yield strength under fall loading was obtained by applying force to the femoral head and identifying the force at which 15 contiguous nonsurface elements had yielded according to the von Mises yield criterion.27,28 We previously identified RMS-CVs of 3.5–3.6% for stance and fall loading bone strength for duplicate scans in 22 individuals.21
Proximal femoral diaphysis properties
The proximal femoral diaphysis was analyzed 4 cm distal to the lesser trochanter by importing images into ImageJ v1.52a (National Institutes of Health, Bethesda, MD) and using the BoneJ plugin.30 A single slice was analyzed using a threshold of 400 mg/cm3 to locate the outer bone edge and to separate the cortical and medullary compartments. Parameters obtained were: Ct.vBMD (mg/cm3), BMC (mg/cm), total area (Tt.Ar, cm2), cortical area (Ct.Ar, cm2), medullary area (Me.Ar, cm2), Ct.Th (mm), polar moment of inertia (IP, cm4), and the minimum (IMIN) and maximum (IMAX) second moments of area (cm4).
Statistical analyses
Two-tailed analyses with α=0.05 were performed with IBM SPSS Statistics (v27; IBM Corporation, Armonk, NY). Demographic and anthropometric characteristics, and femur properties in the ND leg were compared between groups using a one-way ANOVA, with whole-body lean mass used as a covariate in the comparisons of whole-body areal BMD and ND leg properties.
D-to-ND leg differences for proximal femur vBMD, BMC, volume, and estimated strength, and proximal femoral diaphysis properties were assessed by calculating mean percent differences ([D–ND]/ND × 100%) and their 95% confidence intervals (CI). 95% CIs not crossing zero were statistically significant, as determined by single sample t-tests (population mean = 0%). D-to-ND leg percent difference values were compared between groups using unpaired t-tests.
Voxel- and vertex-wise D-to-ND leg differences were determined using linear mixed-effects models with a random intercept, allowing for age, height, weight, and shape as follows:
where: bone property = vBMD, Ct.vBMD, Ct.Th or EndoTb.vBMD; leg = 0 for nondominant and 1 for dominant; age, height and weight were the same for both legs as comparisons were within-subject; and PC1Shape-PC5Shape were computed for each leg and represented the first 5 modes of shape,31,32 which explained more than 90% of the variance. The local comparisons performed with the above equation yielded a Student’s t-test map (t-map) for b1 and its corresponding P-value map, which was corrected for multiple comparisons using false discovery rate correction (q=0.05).33 Significant voxels after correction indicated significant differences in vBMD, while significant vertices after false discovery rate correction indicated significant D-to-ND leg differences in Ct.vBMD, Ct.Th or EndoTb.vBMD.
RESULTS
Participant characteristics
There were 25 pitchers and 15 controls (Table 1). Pitchers were taller and heavier, and possessed a greater BMI and greater whole-body areal BMD, lean mass, and fat mass than controls (all p<0.01). These between group differences in whole-body measures are normalized when determining D-to-ND leg differences and not considered to influence within-subject proximal femur asymmetry. There were no differences between the ND legs of pitchers and controls for any properties in the proximal femur (Supplemental table 1) or femoral diaphysis (Supplemental table 2), when whole-body fat free lean mass was included as a covariate (all p=0.08–0.93).
Table 1.
Demographic and anthropometric characteristics of controls and softball pitchers†
| Characteristic | Controls | Softball | |
|---|---|---|---|
| n | 15 | 25 | |
| Demographics | |||
| Age (yr) | 20.6 ± 1.3 | 20.4 ± 1.4 | |
| Dominant leg (R/L) | 1/14 | 3/22 | |
| Self-reported age of menarche (yr) | 13.2 ± 1.8 | 12.8 ± 1.2 | |
| Age started playing (yr) | — | 6.8 ± 1.8 | |
| Years playing before menarche (yr) | — | 6.0 ± 1.7 | |
| Total years playing (yr) | — | 13.6 ± 2.2 | |
| Whole-body anthropometry | |||
| Height (m) | 1.64 ± 0.08 | 1.75 ± 0.06* | |
| Mass (kg) | 58.1 ± 6.7 | 80.1 ± 10.6* | |
| Body mass index (kg/m2) | 21.1 ± 1.1 | 26.1 ± 3.3* | |
| Areal bone mineral density (g/cm2)# | 0.94 ± 0.06 | 1.10 ± 0.08* | |
| Fat free lean mass (kg)§ | 39.2 ± 4.7 | 43.8 ± 4.1* | |
| Fat mass (%) | 26.9 ± 4.1 | 34.2 ± 5.2* |
Data are mean ± SD, except for frequencies
ANCOVA adjusted values, adjusted for age and whole-body fat free lean mass
ANCOVA adjusted values, adjusted for age and height
p<0.001 compared to control
Proximal femur vBMD, BMC and volume
Controls had lower integral and trochanter trabecular vBMD in their D leg compared to ND leg (all p=0.02, Supplementary Table 1). There were no other D-to-ND leg differences in vBMD, BMC, or volume in controls (all p=0.15 to 0.98).
Pitchers had D-to-ND leg differences of 6.2% (95%CI, 4.6 to 7.7%) for integral vBMD in the total proximal femur, with significant D-to-ND leg differences present at both the femoral neck and trochanter subregions (all p<0.001, Fig. 1A). D-to-ND leg differences in both cortical (Fig. 1B) and trabecular (Fig. 1C) compartment vBMD contributed to the D-to-ND leg differences in integral vBMD at the total proximal femur (all p<0.001). The D-to-ND leg differences for integral, cortical, and trabecular vBMD at all regions were significantly greater in pitchers than controls (all p<0.001).
Figure 1.
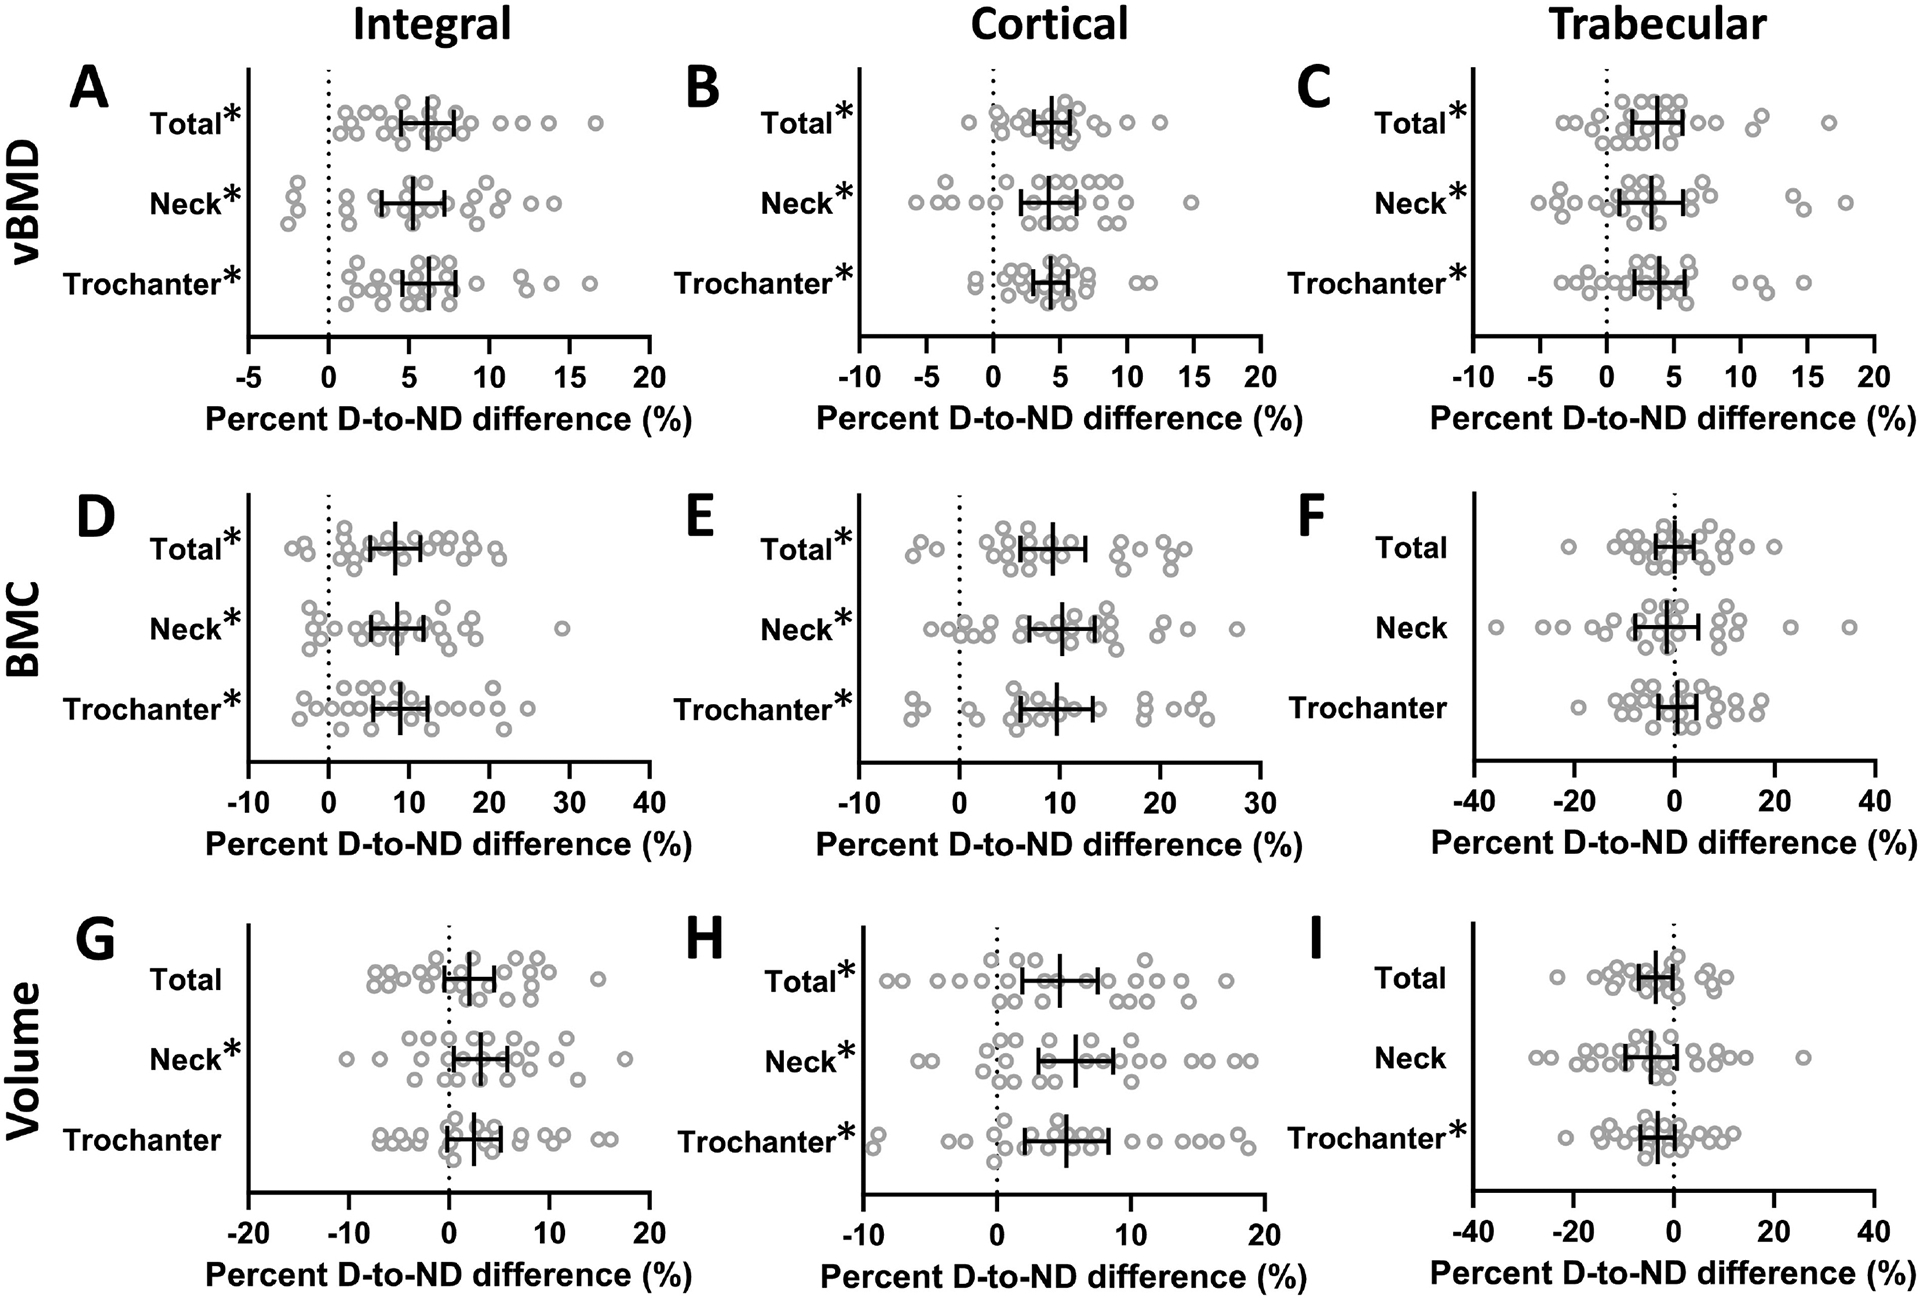
Percent dominant-to-nondominant (D-to-ND) leg differences for integral (i.e., cortical + trabecular), cortical, and trabecular vBMD (A–C), BMC (D–F), and volume (G–I) in the total proximal femur, and femoral neck and trochanteric subregions in softball pitchers. Data represent mean D-to-ND leg percent difference, with error bars indicating 95% confidence intervals. Confidence intervals not crossing 0% indicate significant (*) D-to-ND leg differences. Open circles indicate D-to-ND leg differences in individual pitchers.
Greater BMC contributed to the D-to-ND leg differences in vBMD in pitchers. Pitchers had 8.3% (95%CI, 5.4 to 11.3%) D-to-ND leg differences for integral BMC in the total proximal femur, with significant D-to-ND leg differences present in both the femoral neck and trochanter subregions (all p<0.001, Fig. 1D). The greater BMC was due to D-to-ND leg differences in cortical compartment BMC in each region (all p<0.001, Fig. 1E), as opposed to D-to-ND leg differences in trabecular compartment BMC (all p=0.62 to 0.97, Fig. 1F). The D-to-ND leg differences for integral and cortical BMC in all regions were significantly greater in pitchers than in controls (all p<0.01). There were no D-to-ND leg differences between pitchers and controls for trabecular BMC in any region (all p=0.21 to 0.96).
There were no D-to-ND leg differences in pitchers for integral volume in the total proximal femur or trochanteric subregion (all p=0.07 to 0.10, Fig. 1G). However, pitchers had 3.2% (95%CI, 0.6 to 5.6%) D-to-ND leg differences in integral femoral neck volume (p=0.02, Fig. 1G). There was greater volume of the cortical compartment in the D leg compared to ND leg in pitchers at the total proximal femur, and femoral neck and trochanter subregions (all p<0.01, Fig. 1H). Pitchers had reduced trabecular volume at total proximal femur in their D leg compared to ND leg (all p=0.04, Fig. 1I), but not within the femoral neck or trochanter subregions (all p=0.07 to 0.09, Fig. 1I). When compared to D-to-ND leg differences in controls, only cortical compartment volume in each region remained statistically significant (all p<0.05).
Voxel-wise distribution of vBMD
Voxel- and vertex-wise spatial differences in bone properties, and estimated strength outcomes were not assessed in controls due to their general lack of D-to-ND differences in proximal femur vBMD, BMC, and volume.
Pitchers exhibited D-to-ND leg differences (positive t-values) for vBMD in a large number of voxels along a line connecting the superior femoral head, inferior femoral neck and medial intertrochanteric region (Fig 2). Pitchers also had D-to-ND leg differences for vBMD within the greater trochanter.
Figure 2.

Anterior and posterior views of the 3D t-map indicating voxels with significant differences in vBMD between the dominant and nondominant legs in softball pitchers. Voxels with positive and negative t-values indicate significantly higher and lower vBMD in dominant legs compared to contralateral nondominant legs, respectively. Voxels where there were no statistical differences between dominant and nondominant legs are rendered transparent.
Greatest t-values for D-to-ND leg differences in pitchers were observed in the infero-posterior aspect of the greater trochanter, antero-inferior aspect of the femoral neck, and anterior aspect of the lesser trochanter. There were small regions within the medial femoral head and superior aspect of the femoral neck exhibiting lower vBMD (negative t-values) in the D leg compared to ND leg in pitchers.
Vertex-wise distribution of cortical vBMD, Ct.Th and EndoTb.vBMD
Pitchers had areas of increased D-to-ND leg differences (positive t-values) in cortical vBMD at the greater trochanter and inferior femoral neck (Fig. 3A). Larger areas of D-to-ND leg difference were observed for Ct.Th (Fig. 3B) and EndoTb.vBMD (Fig. 3C) in the inferior femoral neck and greater trochanter. There was a small patch of reduced cortical vBMD, Ct.Th, and EndoTb.vBMD (negative t-values) in the D leg compared to ND leg at the superoposterior femoral neck.
Figure 3.

Surface-based t-maps indicating vertices with significant differences between dominant and nondominant legs in softball pitchers for cortical vBMD (A), Ct.Th (B), and EndoTb.vBMD (C). Vertices with positive and negative t-values indicate significantly greater and lesser properties within dominant legs compared to contralateral nondominant legs, respectively. Vertices where there were no statistical differences between dominant and nondominant legs are rendered white. The femoral head was excluded from the analyses due to its thin cortical bone.
Estimated strength of the proximal femur
Pitchers had 19.4% (95%CI, 15.0 to 23.9%) D-to-ND leg differences in ultimate strength under single-leg stance loading (p<0.001; Fig. 4). Under loading from a fall onto the greater trochanter, pitchers had 11.0% (95%CI, 5.2 to 16.7%) and 4.9% (95%CI, 1.7 to 8.2%) D-to-ND leg differences in yield strength and ultimate strength, respectively (all p≤0.007) (Fig. 4).
Figure 4.

Percent dominant-to-nondominant (D-to-ND) leg differences in softball pitchers for proximal femur ultimate strength under single-leg stance loading, and yield and ultimate strength under loading associated with a fall onto the posterolateral greater trochanter. Data represent mean percent D-to-ND leg difference, with error bars indicating 95% confidence intervals. Confidence intervals not crossing 0% indicate significant (*) D-to-ND leg differences. Open circles indicate D-to-ND leg differences in individual pitchers.
Proximal femoral diaphysis properties
There were no D-to-ND leg differences for any proximal femoral diaphysis outcome in controls (all p=0.17 to 0.94, Supplementary Table 2). The proximal femoral diaphysis in the D leg of softball pitchers was larger (greater Tt.Ar) with greater BMC and Ct.Ar than in the ND leg (all p<0.001, Fig. 5). There was lower Me.Ar in the D leg when absolute differences were analyzed (p=0.02, Supplementary Table 2), but not when analyzing D-to-ND leg percent differences (p=0.07, Fig. 5). The D-to-ND differences in bone size and mass contributed to 5.7% (95%CI, 1.9 to 9.5%), 9.8% (6.2 to 13.3%), and 8.0% (4.9 to 11.0%) D-to-ND leg differences in IMIN, IMAX, and IP in pitchers, respectively (all p<0.01, Fig. 5). The D-to-ND leg differences for BMC, Tt.Ar, Ct.Ar, IMAX, and IP were significantly greater in pitchers than in controls (all p<0.02).
Figure 5.

Mean percent dominant-to-nondominant (D-to-ND) leg differences in softball pitchers for proximal femoral diaphysis vBMD, BMC, total area (Tt.Ar), cortical area (Ct.Ar), medullary area (Me.Ar), cortical thickness (Ct.Th), minimum (IMIN) and maximum (IMAX) second moments of area, and polar moment of inertia (IP),. Error bars indicate 95% confidence intervals. Confidence intervals not crossing 0% indicate significant (*) D-to-ND leg differences. Open circles indicate D-to-ND leg differences in individual pitchers.
DISCUSSION
The current data further our understanding of adaptation of the proximal femur to mechanical loading associated with physical activity. Using softball pitchers as a within-subject controlled model of chronic asymmetrical lower extremity loading, we found the D leg (i.e., leg contralateral to the throwing arm) had enhanced vBMD and BMC compared with the contralateral ND leg. The femoral neck subregion in the D leg also had heightened volume/size. These data confirm the presence of D-to-ND leg asymmetry in softball pitchers shown using DXA-derived outcomes19 and are consistent with heightened loading of the D leg during pitching.18,34 Mapping the spatial distribution of the adaptation, we found heightened vBMD principally occurred within a large volume connecting the superior femoral head, inferior femoral neck, and medial intertrochanteric region. There was also a large volume of heightened vBMD within the greater trochanter, as well as bone mass and size adaptation of the proximal femoral diaphysis. These combined D-to-ND leg differences contributed to the D leg having greater strength in the loading directions of both single-leg stance and a posterolateral fall onto the greater trochanter.
The physical activity-induced increase in ultimate strength under a fall onto the greater trochanter is novel. Others have either not observed a benefit of physical activity on FE estimated strength under fall loading15,35 or demonstrated benefits using a cross-sectional study design comparing different athlete groups which cannot account for selection bias or inherited and systemic traits.13,36 In our previous within-subject controlled study using baseball pitchers we found a D-to-ND leg difference in yield strength under fall loading, a finding confirmed in the current study and hypothesized to reflect adaptation of the greater trochanter to resist damage initiation and plastic deformation.17 However, we did not find a D-to-ND leg difference in ultimate strength to a posterolateral fall onto the greater trochanter in baseball pitchers.17 The spatial distributions of D-to-ND leg differences in vBMD in baseball and softball pitchers were similar, with adaptation principally in regions thought to support and transmit weight-bearing directed loads. However, softball pitchers exhibited a much broader number of voxels that exhibited D-to-ND leg differences, and had D-to-ND leg differences in BMC and femoral neck volume/size. The latter findings were not present in baseball pitchers.
The greater D-to-ND leg differences at the proximal femur in softball pitchers in weight bearing regions contributed to this group having heightened strength to loading in the direction of single-leg stance. Softball pitchers had over 4.5 fold greater D-to-ND leg difference in single-leg stance strength compared to baseball pitchers (19.1% vs. 4.1%). The D-to-ND leg difference in softball pitchers is similar to the 18.7% racquet-to-nonracquet arm difference in distal radius strength observed in the established upper extremity within-subject controlled model of female tennis players,37 confirming the utility of softball pitchers as a model of lower extremity asymmetrical loading.
The more extensive adaptation in the D leg of softball pitchers compared to baseball pitchers contributed to an enhanced ability to resist loading to a simulated posterolateral fall onto the greater trochanter. The later benefit occurred despite a general absence of adaptation in the superior neck region, with the region actually showing some small areas of reduced vBMD in the D leg. The superior neck region is thought to be clinically relevant to fractures associated with a fall as it is exposed to greatest stress/strain during impact from a fall onto the greater trochanter;7–10 femoral neck fractures appear to initiate in this region during a sideways fall;11,12 this region experiences greater bone loss during aging compared to the more preserved inferior femoral neck,22,38 and; deficits in this region are associated with incident femoral neck fracture.23,32,39,40 The lack of measurable adaptation at the superior neck region implies that the adaptation in regions associated with more stereotypical weight-bearing were able to indirectly protect the superior neck (as discussed in the introduction).
Although softball pitchers exhibited D-to-ND leg differences in proximal femur strength to fall loading, the smaller magnitude of the D-to-ND leg difference compared to that for single-leg stance loading (4.9% vs. 19.1%) confirms the directional-specific adaptation of bone to mechanical loads. It also continues to raise the question of how to more specifically load, adapt and strengthen the proximal femur to resist loading in less habitual directions, such as from a fall onto the greater trochanter.3 One approach may be to perform activities requiring multi-directional loading. However, previous studies mapping proximal femur adaptation to physical activity reported a general lack of benefit on the superior femoral neck despite including odd impacts, multidirectional hopping, and hip abduction/adduction exercises.13–16,36
The reason for greater adaptation at the proximal femur in female collegiate-level softball pitchers than previously reported in male professional-level baseball pitchers is unknown. There is potential for differences in bone loading due to sex differences in hip geometry and possibly sex differences in mechanosensitivity. However, we hypothesize there are two predominant factors contributing to the greater adaptation in female softball pitchers. First, D-to-ND leg differences in vertical ground reaction forces and their rate of development are greater in softball pitching than baseball pitching.18 External force measures may not always directly equate with loading at the bone tissue level; however, there is likely a relationship and bone more robustly responds to higher strain magnitudes and rates. Second, our softball pitchers were likely exposed to more loading repetitions and bouts when younger. We did not assess retrospective or current training volumes to explore unilateral loading dose effects; however, differences in pitch counts between baseball and softball pitchers are known. Junior baseball pitchers are regulated by pitch count limits which prescribe the maximum number of pitches per game and the number of rest days required between games. The same regulations do not currently exist for softball pitchers. Softball teams typically carry a lesser proportion of pitchers on their rosters than baseball teams resulting in more games and innings pitched, and it is not uncommon for softball pitchers to pitch up to 100 times within a single game, and to pitch in multiple games per day and on consecutive days.41–43
Our study had a number of strengths, including the: 1) use of a within-subject controlled model to control selection bias and minimize the impact of inherited and systemic factors; 2) inclusion of a control group not exposed to unilaterally elevated loads to assess for any normal crossed symmetry, and; 3) study of females who are at greater risk of proximal femur fracture than males. However, this study also possesses limitations. We did not quantify the pattern of proximal femur loading during softball pitching to correlate with the observed adaptation patterns. CT partial volume effects may have influenced our ability to identify small changes, particularly at the relatively thin superior femoral neck; however, our cortical bone thickness quantification method takes into consideration partial volume effects.21 Changes in bone thickness could have been smaller than the 3 mm finite elements used in our FE models; however, any increase in thickness would have been included in the calculation of an element’s material properties, thereby influencing its mechanical properties. Finally, our FE models explored bone strength under only two load conditions. The possibility for different outcomes under alternative loading conditions (including boundary conditions that may more accurately represent real life falls) cannot be excluded.
In summary, the current data confirm the spatial and strength adaptation of the proximal femur to weight bearing directed loading and demonstrate the changes also have benefits, albeit smaller, on resisting loads associated with a fall onto the posterolateral greater trochanter. The bone strength benefits of physical activity occurred despite a lack of measurable adaptation at the superior femoral neck, a region thought to be important to resisting loading during a sideways fall. To enhance the benefit of physical activity on fall-related loading, activities that better target the superior femoral neck should be explored.
Supplementary Material
HIGHLIGHTS.
Physical activity adapts the proximal femur, but is it stronger?
Softball pitchers are a within-subject controlled model of unilateral loading
The proximal femur opposite the throwing arm had enhanced mass and structure
Changes enhanced strength to single-leg stance and a fall on the greater trochanter
Data demonstrate physical activity can enhance resistance to fracture-related loads
ACKNOWLEDGEMENTS
This contribution was made possible by support from the National Institutes of Health (P30 AR072581, R01 AR057740, and R01 AR068456).
Footnotes
Publisher's Disclaimer: This is a PDF file of an unedited manuscript that has been accepted for publication. As a service to our customers we are providing this early version of the manuscript. The manuscript will undergo copyediting, typesetting, and review of the resulting proof before it is published in its final form. Please note that during the production process errors may be discovered which could affect the content, and all legal disclaimers that apply to the journal pertain.
DISCLOSURES
All authors state that they have no conflicts of interest.
REFERENCES
- 1.Johnell O, Kanis JA, Oden A, et al. Predictive value of BMD for hip and other fractures. J Bone Miner Res 2005;20(7):1185–94. [DOI] [PubMed] [Google Scholar]
- 2.Weaver CM, Gordon CM, Janz KF, et al. The National Osteoporosis Foundation’s position statement on peak bone mass development and lifestyle factors: a systematic review and implementation recommendations. Osteoporos Int 2016;27(4):1281–386. [DOI] [PMC free article] [PubMed] [Google Scholar]
- 3.Fuchs RK, Kersh ME, Carballido-Gamio J, et al. Physical activity for strengthening fracture prone regions of the proximal femur. Curr Osteoporos Rep 2017;15(1):43–52. [DOI] [PMC free article] [PubMed] [Google Scholar]
- 4.Parkkari J, Kannus P, Palvanen M, et al. Majority of hip fractures occur as a result of a fall and impact on the greater trochanter of the femur: a prospective controlled hip fracture study with 206 consecutive patients. Calcif Tissue Int 1999;65(3):183–7. [DOI] [PubMed] [Google Scholar]
- 5.Nevitt MC, Cummings SR. Type of fall and risk of hip and wrist fractures: the study of osteoporotic fractures. The Study of Osteoporotic Fractures Research Group. J Am Geriatr Soc 1993;41(11):1226–34. [DOI] [PubMed] [Google Scholar]
- 6.Kersh ME, Martelli S, Zebaze R, et al. Mechanical loading of the femoral neck in human locomotion. J Bone Miner Res 2018;33(11):1999–2006. [DOI] [PubMed] [Google Scholar]
- 7.Lotz JC, Cheal EJ, Hayes WC. Stress distributions within the proximal femur during gait and falls: implications for osteoporotic fracture. Osteoporos Int 1995;5(4):252–61. [DOI] [PubMed] [Google Scholar]
- 8.Zani L, Erani P, Grassi L, et al. Strain distribution in the proximal human femur during in vitro simulated sideways fall. J Biomech 2015;48(10):2130–43. [DOI] [PubMed] [Google Scholar]
- 9.Kersh ME, Pandy MG, Bui QM, et al. The heterogeneity in femoral neck structure and strength. J Bone Miner Res 2013;28(5):1022–8. [DOI] [PubMed] [Google Scholar]
- 10.Verhulp E, van Rietbergen B, Huiskes R. Load distribution in the healthy and osteoporotic human proximal femur during a fall to the side. Bone 2008;42(1):30–5. [DOI] [PubMed] [Google Scholar]
- 11.de Bakker PM, Manske SL, Ebacher V, et al. During sideways falls proximal femur fractures initiate in the superolateral cortex: evidence from high-speed video of simulated fractures. J Biomech 2009;42(12):1917–25. [DOI] [PubMed] [Google Scholar]
- 12.Juszczyk MM, Cristofolini L, Salva M, et al. Accurate in vitro identification of fracture onset in bones: failure mechanism of the proximal human femur. J Biomech 2013;46(1):158–64. [DOI] [PubMed] [Google Scholar]
- 13.Abe S, Narra N, Nikander R, et al. Exercise loading history and femoral neck strength in a sideways fall: a three-dimensional finite element modeling study. Bone 2016;92:9–17. [DOI] [PubMed] [Google Scholar]
- 14.Allison SJ, Poole KE, Treece GM, et al. The influence of high-impact exercise on cortical and trabecular bone mineral content and 3D distribution across the proximal femur in older men: a randomized controlled unilateral intervention. J Bone Miner Res 2015;30(9):1709–16. [DOI] [PubMed] [Google Scholar]
- 15.Lang TF, Saeed IH, Streeper T, et al. Spatial heterogeneity in the response of the proximal femur to two lower-body resistance exercise regimens. J Bone Miner Res 2014;29:1337–45. [DOI] [PMC free article] [PubMed] [Google Scholar]
- 16.Nikander R, Kannus P, Dastidar P, et al. Targeted exercises against hip fragility. Osteoporos Int 2009;20(8):1321–8. [DOI] [PubMed] [Google Scholar]
- 17.Warden SJ, Carballido-Gamio J, Weatherholt AM, et al. Heterogeneous spatial and strength adaptation of the proximal femur to physical activity: a within-subject controlled cross-sectional study. J Bone Miner Res 2020;35(4):681–90. [DOI] [PMC free article] [PubMed] [Google Scholar]
- 18.Blankenship MJ, Frisk HL, Martin EM, et al. Sex-based analysis of the biomechanics of pitching. 38th International Society of Biomechanics in Sport Conference ISBS Proceedings Archive 2020;38(1):92–95. [Google Scholar]
- 19.Fuchs RK, Thompson WR, Weatherholt AM, et al. Baseball and softball pitchers are distinct within-subject controlled models for exploring proximal femur adaptation to physical activity. Calcif Tissue Int 2019;104:373–81. [DOI] [PMC free article] [PubMed] [Google Scholar]
- 20.Lang T, LeBlanc A, Evans H, et al. Cortical and trabecular bone mineral loss from the spine and hip in long-duration spaceflight. J Bone Miner Res 2004;19(6):1006–12. [DOI] [PubMed] [Google Scholar]
- 21.Carballido-Gamio J, Bonaretti S, Saeed I, et al. Automatic multi-parametric quantification of the proximal femur with quantitative computed tomography. Quant Imaging Med Surg 2015;5(4):552–68. [DOI] [PMC free article] [PubMed] [Google Scholar]
- 22.Carballido-Gamio J, Harnish R, Saeed I, et al. Proximal femoral density distribution and structure in relation to age and hip fracture risk in women. J Bone Miner Res 2013;28(3):537–46. [DOI] [PMC free article] [PubMed] [Google Scholar]
- 23.Yu A, Carballido-Gamio J, Wang L, et al. Spatial differences in the distribution of bone between femoral neck and trochanteric fractures. J Bone Miner Res 2017;32:1672–80. [DOI] [PMC free article] [PubMed] [Google Scholar]
- 24.Keyak JH. Improved prediction of proximal femoral fracture load using nonlinear finite element models. Med Eng Phys 2001;23(3):165–73. [DOI] [PubMed] [Google Scholar]
- 25.Keyak JH, Kaneko TS, Tehranzadeh J, et al. Predicting proximal femoral strength using structural engineering models. Clin Orthop Relat Res 2005(437):219–28. [DOI] [PubMed] [Google Scholar]
- 26.Keyak JH, Koyama AK, LeBlanc A, et al. Reduction in proximal femoral strength due to long-duration spaceflight. Bone 2009;44(3):449–53. [DOI] [PubMed] [Google Scholar]
- 27.Keyak JH, Rossi SA, Jones KA, et al. Prediction of femoral fracture load using automated finite element modeling. J Biomech 1998;31(2):125–33. [DOI] [PubMed] [Google Scholar]
- 28.Keyak JH, Sigurdsson S, Karlsdottir G, et al. Male-female differences in the association between incident hip fracture and proximal femoral strength: a finite element analysis study. Bone 2011;48(6):1239–45. [DOI] [PMC free article] [PubMed] [Google Scholar]
- 29.Keyak JH, Sigurdsson S, Karlsdottir GS, et al. Effect of finite element model loading condition on fracture risk assessment in men and women: the AGES-Reykjavik study. Bone 2013;57(1):18–29. [DOI] [PMC free article] [PubMed] [Google Scholar]
- 30.Doube M, Klosowski MM, Arganda-Carreras I, et al. BoneJ: Free and extensible bone image analysis in ImageJ. Bone 2010;47(6):1076–9. [DOI] [PMC free article] [PubMed] [Google Scholar]
- 31.Gee AH, Treece GM. Systematic misregistration and the statistical analysis of surface data. Med Image Anal 2014;18(2):385–93. [DOI] [PubMed] [Google Scholar]
- 32.Treece GM, Gee AH, Tonkin C, et al. Predicting hip fracture type with cortical bone mapping (CBM) in the Osteoporotic Fractures in Men (MrOS) Study. J Bone Miner Res 2015;30(11):2067–77. [DOI] [PMC free article] [PubMed] [Google Scholar]
- 33.Genovese CR, Lazar NA, Nichols T. Thresholding of statistical maps in functional neuroimaging using the false discovery rate. Neuroimage 2002;15(4):870–8. [DOI] [PubMed] [Google Scholar]
- 34.Kwon YH, Shim J, Shim JK, et al. , eds. Ground reaction force analysis of softball windmill pitch. International Conference on Biomechanics in Sport; 2008; Seoul, Korea. [Google Scholar]
- 35.O’Rourke D, Beck BR, Harding AT, et al. Assessment of femoral neck strength and bone mineral density changes following exercise using 3D-DXA images. J Biomech 2021;119:110315. [DOI] [PubMed] [Google Scholar]
- 36.Abe S, Narra N, Nikander R, et al. Impact loading history modulates hip fracture load and location: A finite element simulation study of the proximal femur in female athletes. J Biomech 2018;76:136–43. [DOI] [PubMed] [Google Scholar]
- 37.Warden SJ, Wright CS, Fuchs RK. Bone microarchitecture and strength adaptation to physical activity: a within-subject controlled, HRpQCT study. Med Sci Sports Exerc 2021;5:1179–1187 [DOI] [PubMed] [Google Scholar]
- 38.Poole KE, Mayhew PM, Rose CM, et al. Changing structure of the femoral neck across the adult female lifespan. J Bone Miner Res 2010;25(3):482–91. [DOI] [PubMed] [Google Scholar]
- 39.Johannesdottir F, Poole KE, Reeve J, et al. Distribution of cortical bone in the femoral neck and hip fracture: a prospective case-control analysis of 143 incident hip fractures; the AGES-REYKJAVIK Study. Bone 2011;48(6):1268–76. [DOI] [PMC free article] [PubMed] [Google Scholar]
- 40.Poole KES, Skingle L, Gee AH, et al. Focal osteoporosis defects play a key role in hip fracture. Bone 2017;94:124–34. [DOI] [PMC free article] [PubMed] [Google Scholar]
- 41.Corben JS, Cerrone SA, Soviero JE, et al. Performance demands in softball pitching: a comprehensive muscle fatigue study. Am J Sports Med 2015;43(8):2035–41. [DOI] [PubMed] [Google Scholar]
- 42.Skillington SA, Brophy RH, Wright RW, et al. Effect of pitching consecutive days in youth fast-pitch softball tournaments on objective shoulder strength and subjective shoulder symptoms. Am J Sports Med 2017;45(6):1413–19. [DOI] [PMC free article] [PubMed] [Google Scholar]
- 43.Smith MV, Davis R, Brophy RH, et al. Prospective player-reported injuries in female youth fast-pitch softball players. Sports health 2015;7(6):497–503. [DOI] [PMC free article] [PubMed] [Google Scholar]
Associated Data
This section collects any data citations, data availability statements, or supplementary materials included in this article.