

Abstract
The structured life-course modeling approach (SLCMA) is a theory-driven analytical method that empirically compares multiple prespecified life-course hypotheses characterizing time-dependent exposure-outcome relationships to determine which theory best fits the observed data. In this study, we performed simulations and empirical analyses to evaluate the performance of the SLCMA when applied to genomewide DNA methylation (DNAm). Using simulations (n = 700), we compared 5 statistical inference tests used with SLCMA, assessing the familywise error rate, statistical power, and confidence interval coverage to determine whether inference based on these tests was valid in the presence of substantial multiple testing and small effects—2 hallmark challenges of inference from -omics data. In the empirical analyses (n = 703), we evaluated the time-dependent relationship between childhood abuse and genomewide DNAm. In simulations, selective inference and the max-|t|-test performed best: Both controlled the familywise error rate and yielded moderate statistical power. Empirical analyses using SLCMA revealed time-dependent effects of childhood abuse on DNAm. Our findings show that SLCMA, applied and interpreted appropriately, can be used in high-throughput settings to examine time-dependent effects underlying exposure-outcome relationships over the life course. We provide recommendations for applying the SLCMA in -omics settings and encourage researchers to move beyond analyses of exposed versus unexposed individuals.
Keywords: Avon Longitudinal Study of Parents and Children, DNA methylation, life course, -omics, postselection inference, structured approach
Abbreviations
- ALSPAC
Avon Longitudinal Study of Parents and Children
- ARIES
Accessible Resource for Integrated Epigenomic Studies
- CpG
cytosine-phosphate-guanine
- DNAm
DNA methylation
- FWER
familywise error rate
- LASSO
least absolute shrinkage and selection operator
- SLCMA
structured life-course modeling approach
Epidemiologists have long been interested in whether and how exposures incurred over the life course affect later health outcomes. Guided by theories developed in life-course epidemiology (Table 1), researchers are moving beyond simple comparisons of the presence versus absence of exposure to characterize time-dependent exposure-outcome relationships (1). Prior work in life-course epidemiology has conceptualized timing effects in numerous ways, examining the roles of the developmental timing of exposure (the sensitive-period hypothesis), the number of exposure occasions across time (the accumulation-of-risk hypothesis), proximity in time to exposure (the recency hypothesis), and change in exposure status across time (the mobility hypothesis). Researchers have adopted this life-course perspective, uncovering mechanistic insights that have advanced many subfields of public health and medicine (2–6). Because different life-course hypotheses correspond to distinct theories of disease etiology, efforts to formally compare competing hypotheses and identify those best supported by empirical data are needed to guide prevention and intervention planning.
Table 1.
Commonly Tested Life-Course Theories Characterizing Time-Dependent Relationships Between Exposures and Health Outcomes
| Hypothesis | Life-Course Theory | Definition | Encoding a | Example b |
|---|---|---|---|---|
| Sensitive period | The developmental timing of exposure X has the strongest effect on the outcome at a specific time point due to heightened levels of plasticity or reprogramming. | Exposure at a particular time point  is associated with the outcome. is associated with the outcome. |

|
Abuseperiod 1 ( ) = exposed (1) vs. unexposed (0) in time period 1 ) = exposed (1) vs. unexposed (0) in time period 1 |
| Accumulation | Every additional time point of exposure affects the outcome in a dose-response manner, independent of the exposure timing. | The accumulated sum of the number of exposure occasions (A) is linearly associated with the outcome. |
|
Abuseaccumulation (A) = number of time periods exposed to abuse (range, 0–6) |
| Recency | More proximal exposures (those that happen closer in time to the measurement of the outcome) are more strongly linked to the outcome than are more distal exposures. | The weighted sum (R) of the number of exposure occasions is linearly associated with the outcome such that the weight of each exposure is proportional to the age at the time of measurement. |
|
Abuserecency (R) = abuseperiod 1 exposed (1) vs. unexposed (0) × (ageperiod 1) + … + abuseperiod 6 exposed (1) vs. unexposed (0) × (ageperiod 6) |
| Mobility | The change in exposure status between 2 time periods, rather than the absolute state at each individual time point, affects the outcome. | The unidirectional change ( ) between 2 measurement occasions (from jth to kth) is associated with the outcome. ) between 2 measurement occasions (from jth to kth) is associated with the outcome. |
Positive change:  Negative change: Negative change: 
|
Abusemobility+, period 1–2 ( ) = (1 − exposed (1) in time period 1) × exposed (1) in time period 2 ) = (1 − exposed (1) in time period 1) × exposed (1) in time period 2 |
a Notation is based on the description of hypotheses by Smith et al. (9). Let X1, …, Xm be a set of m repeated binary measures of exposure (0 = unexposed; 1 = exposed) and T1 … Tm the corresponding age at the time of measurement. Xj represents the measurement taken on the jth measurement occasion.
b This column shows examples of how the life-course theories, which were tested in empirical analyses of the epigenomewide structured life-course modeling approach to examine exposure to physical or sexual abuse in childhood, could be encoded. Notably, the accumulation models can also be parameterized differently, such as with nonlinear effects (“U-shaped” or “J-shaped” relationships). However, for simplicity, we provide the simplest definition of accumulation, which is also the most frequently tested.
To address the need for systematic comparisons of life-course theories, Mishra et al. (7) introduced the structured life-course modeling approach (SLCMA). The SLCMA allows researchers to compare a set of a priori–specified life-course theories and use goodness-of-fit criteria to determine which theory is best supported by empirical data. Smith et al. (8) later extended this approach with an alternative statistical model selection strategy that uses least-angle regression, accommodates both binary and continuous exposures (9, 10), and improves the accuracy of selecting the correct hypothesis. More recently, Madathil et al. (11) proposed a Bayesian approach to life-course modeling that does not perform variable selection but rather estimates the posterior probability corresponding to each theoretical hypothesis while assessing the relative importance of a series of life-course theories. Since its inception, the SLCMA has been applied in a wide range of non-omics epidemiologic studies, including those examining the time-dependent impacts of childhood trauma, physical activity, or socioeconomic position on psychological, metabolic, and disease outcomes (12–18). Compared with other approaches that consider alternative classifications of the exposure, the SLCMA is better positioned to compare competing life-course hypotheses simultaneously. By requiring that life-course hypotheses be specified a priori on the basis of theory, it prevents post-hoc hypothesis-generation following exploratory analyses. Moreover, its model selection feature allows a structured assessment of hypotheses without requiring a saturated model.
The growing availability of high-dimensional biological and phenotypic data from longitudinal cohort studies has created new opportunities to assess time-varying exposures in epigenomics, transcriptomics, metabolomics, and other -omics settings (19–21). While large cross-sectional -omics studies have identified associations between biological differences and various traits (22), applications of the SLCMA to longitudinal data and high-dimensional outcomes allow researchers to answer more complex questions about disease mechanisms. For example, Dunn et al. (23) applied the SLCMA in a longitudinal birth cohort study to model timing effects of childhood adversity on DNA methylation (DNAm), which is a widely studied epigenetic mechanism that could give rise to altered gene expression and phenotypic changes. Using the SLCMA, they found that differences in DNAm were largely explained by age at exposure, with the first 3 years of life appearing to be a sensitive period associated with more DNAm differences. Their results also showed that the SLCMA could identify associations not identified by an epigenomewide association study of persons exposed to childhood adversity versus those unexposed (23), underscoring the importance of alternative exposure classifications.
In this study, we aimed to extend these findings with methodological contributions that outline the structured life-course modeling framework and its application in -omics settings. As discussed in Dunn et al. (23), application of the SLCMA to -omics data presents unique challenges not yet systematically investigated. First, it remains unknown whether theoretical properties of statistical inference, such as type I error (i.e., the familywise error rate (FWER) in the presence of multiple testing) or confidence interval coverage, are valid in -omics data. Second, it is unclear whether the SLCMA is sufficiently powered to detect the small effects commonly found in -omics settings. Third, questions exist on how to balance decision-making regarding research evidence, because -omics studies often rely on P values and accurate statistical inference has become increasingly important. Moreover, epidemiologists and other researchers increasingly prioritize other statistical evidence, such as effect sizes and confidence intervals (24, 25). We therefore performed simulations and empirical analyses to assess the performance of the SLCMA when applied to -omics data. We illustrate how the SLCMA can be applied to evaluate the time-dependent role of childhood abuse in genomewideDNAm.
METHODS
Overview of the SLCMA
The SLCMA has been described in detail elsewhere (7, 9, 10). In brief, the SLCMA is a 2-stage method that compares a set of life-course hypotheses describing the relationship between exposures assessed over time and some outcome of interest. In the first stage of the SLCMA, each life-course hypothesis is encoded into a predictor or set of predictor variables. Table 1 shows examples of predictors representing commonly studied life-course hypotheses. A variable selection procedure is then used to select the subset of predictors that explains the greatest proportion of outcome variation. While it is possible for multiple predictors to be selected, the high dimensionality of the -omics setting makes consideration of simple life-course hypotheses (meaning those in which the exposure-outcome association is represented by a single predictor) more feasible. Therefore, in this study, we focused on statistical inference regarding the single predictor explaining the greatest variation in the outcome.
In the second stage of the SLCMA, postselection inference is performed to obtain point estimates and confidence intervals for the model identified in the first stage. Postselection inference methods are used to derive unbiased test statistics because they account for the multiple testing that occurs when comparing multiple hypotheses (meaning the multiple testing occurring at the first stage, instead of the number of outcomes examined), as the SLCMA iteratively works to select the variable with the strongest association with the outcome. Four inference methods that account for this “selective nature” are 1) Bonferroni correction, 2) the max-|t|-test (26), 3) the covariance test (27, 28), and 4) selective inference (29, 30). These approaches are described in detail in Web Appendix 1 and Web Table 3 (available online at https://doi.org/10.1093/aje/kwaa246).
Simulation analyses
We conducted simulations to examine the performance of these 4 postselection inference methods as compared with a naive calculation (summarized in Table 2). To build these simulations in the context of real-world applications, we modeled the simulation strategy based on the genomewide SLCMA study performed by Dunn et al. (23). We evaluated each postselection inference method with respect to 3 statistical properties: the FWER (the probability of making 1 or more false discoveries out of multiple tests), statistical power (the probability of correctly selecting the predictor with a true association with the outcome), and confidence interval coverage (the probability that a 95% confidence interval contains the true effect estimate). Assessing these properties enabled us to determine whether inference based on these tests was valid in the presence of multiple testing and small effect sizes, which are 2 hallmarks of high-dimensional data. Mathematical definitions of the test statistics and the procedure for constructing confidence intervals, as well as example R code, are included in Web Appendices 1 and 2 and are available on GitHub (31). All postselection inference methods, including the naive calculations, involved multiple testing correction for the number of cytosine-phosphate-guanine (CpG) sites tested using a Bonferroni correction (i.e., the P value threshold was P < 1 ×10⁻⁷).
Table 2.
Setup of a Simulation Study Assessing the Performance of 5 Statistical Inference Tests Used With the Structured Life-Course Modeling Approacha
| Simulation Parameter | ||
|---|---|---|
| Under the Null (FWER) | Outcome | No. of Tests |
| Normal outcomes |
|
485,000 |
| Empirical outcomes | Resampled DNAm values | 485,000 |
|
Under the Alternative
(Power and CI Coverage) |
Outcome | Effect Size b |
| Normal outcomes | Simulated normal variables associated with the first predictor (earliest sensitive period) | R 2: 0.01–0.1 |
| Empirical outcomes | Simulated β variables associated with the first predictor (earliest sensitive period) |
 0.05–0.5
 |
Abbreviations: CI, confidence interval; DNAm, DNA methylation; FWER, familywise errorrate.
a The table shows 2 different approaches to simulations of life-course modeling in the -omics context under the null and alternative settings: To assess the FWER, we simulated the exposures and outcomes to have no association with each other (i.e., under the null hypothesis) and ran a single simulation of 485,000 tests to examine the distributions of observed P values as compared with the expected distribution. To assess statistical power and CI coverage under the alternative hypothesis, we ran 2,000 simulation experiments to allow the CI of the assessed metrics (i.e., power and CI coverage) to have a radius (i.e., margin of error) of 1%, setting α to 5%. The 2 metrics of effect sizes were different with normal versus empirical outcomes because of the difference in the underlying data-generating processes. The sample size was set to n = 700 in all simulations based on the sample size of the empirical study. For all simulation analyses, the predictors were simulated on the basis of exposure to childhood abuse from the Avon Longitudinal Study of Parents and Children (England, 1991–2000). The analyses included 7 variables encoding sensitive period, accumulation, and recency hypotheses.
b
R
2: variance of the outcome explained by the selected predictor;  difference in average DNAm levels between exposed and unexposed individuals.
Setup of simulations
We considered 2 scenarios, which differed in terms of the simulated outcome. In both scenarios, we simulated exposure to childhood sexual or physical abuse based on empirical data collected during 1991–2000 in the Avon Longitudinal Study of Parents and Children (ALSPAC), a population-based study of an English birth cohort (32–34). Pregnant women with estimated delivery dates between April 1991 and December 1992 were invited to be part of ALSPAC. We analyzed data from an ALSPAC subsample, the Accessible Resource for Integrated Epigenomic Studies (ARIES). We set our sample size to 700 to be consistent with ARIES. Simulations were based on 485,000 tests corresponding to an analysis of Illumina Infinium HumanMethylation450K BeadChip data (Illumina, Inc., San Diego, California). In scenario 1, the outcome (i.e., DNAm) was simulated from a normal distribution. In scenario 2, we resampled the outcomes under the null to more closely resemble “β” values, which represent the proportion of cells in which the cytosine at the locus is methylated and range from 0 to 1. To assess statistical power and confidence interval coverage, we simulated the outcome from a beta distribution, as proposed by Tsai and Bell (32). In both scenarios, the effect sizes were selected to illustrate a wide range of statistical power based on previous epigenomewide association studies examining different exposures (33, 34).
To assess model misspecification, we also conducted simulations in which 1) the outcome variable was correlated with a variable encoding an alternative hypothesis (ever exposed vs. never exposed) not included in the prespecified set of hypotheses tested and 2) the outcome variable was correlated with 2 predictors (a compound life-course hypothesis). We also varied the sample size to investigate its effect on statistical power.
Full details of the simulations are provided in Web Appendix 1.
Measurement of power and confidence interval coverage
Conceptually, bias might arise from the SLCMA analysis in 2 ways. First, at the first stage, the model most supported by the sample data may not be the model most supported in the population. At the second stage, even if the model has been correctly selected, inference based on that model may be biased. In our simulations, we considered both uncertainties residing in model selection and inference: Power was calculated as the percentage of times that the first (variable selection) stage correctly selected the model and the second (inference) stage identified it as a below-threshold hit. Similarly, confidence interval coverage was calculated as the percentage of times that the first stage correctly selected the model and the confidence interval contained the true value. Alternatively, if the first stage selected the wrong model but the confidence interval contained 0, we considered that the true effect (since there should be no effect) was captured by the confidence interval.
Empirical analyses
To illustrate how the SLCMA and the different corresponding postselection inference methods work in practice, we reanalyzed the data used by Dunn et al. (23). Briefly, we compared the effects of sensitive period, accumulation, and recency hypotheses for the associations between exposure to sexual or physical abuse and genomewide DNAm at age 7 years among ALSPAC participants (n = 703). Sample characteristics and adversity measures are described in Web Appendix 3. Building from that study, which used only the covariance test, we additionally applied the other postselection inference methods summarized above.
The most widely used covariate adjustment strategy in the SLCMA is to regress the exposures on the covariates and enter the residuals into variable selection, which decreases the likelihood that observed associations are due to measured confounders. We also tested a new method for covariate adjustment that could be used alongside any postselection inference method. Based on the Frisch-Waugh-Lovell theorem, this method also regresses the outcome on covariates and enters the residuals into the model selection procedure (35–37). A thorough description of this method and the full list of covariates are available in Web Appendix 1. Notably, the SLCMA requires a common set of confounders to be prespecified for all hypotheses; thus, bias may arise from time-varying or hypothesis-dependent confounding.
RESULTS
Simulation analyses
Table 3 summarizes the main findings from the simulation analyses regarding the statistical properties and implementation of the assessed methods.
Table 3.
Statistical Properties of Postselection Inference Methods (Main Findings) in Simulated Epigenomewide Analyses of the Time-Dependent Relationship Between Childhood Abuse and DNA Methylation (n = 700)a
| Method | FWER ( Figures 1 and 2 ) |
Statistical Power
( Figure 3 ) |
CI Coverage
( Figure 4 ) |
Software Availability | Computation Time for an Epigenomewide Analysis b |
|---|---|---|---|---|---|
| Naive calculation | Inflated P values and FWER | Biased due to inflated FWER | Lower-than-expected coverage when effect size is small (9) | Widely available | Fast (24 minutes) |
| Bonferroni correction | Controlled at any level | Comparable | Overly conservative (i.e., above expected coverage) | Widely available | Fast (24 minutes) |
| Max-|t|-test | Controlled at any level | Comparable | Lower-than-expected coverage when effect size is small | R code provided in Web Appendix 2 | Slow (11 hours and 51 minutes) |
| Covariance test | Inflated P values and FWER | Biased due to inflated FWER | Expected coverage (9); interval not necessarily contiguous | R package archived (28) | Moderate (1 hour and 19 minutes) |
| Selective inference | Controlled at any level | Comparable | Expected coverage | R package available (30); possible to implement generalized linear models as well | Slow (14 hours and 13 minutes) |
Abbreviations: CI, confidence interval; FWER, familywise errorrate.
a Simulations were based on data obtained from the Avon Longitudinal Study of Parents and Children (England, 1991–2000).
b Computation time was based on analyses running under R 3.4.0 (R Foundation for Statistical Computing, Vienna, Austria) using a high-performance computer cluster with 8 GB of random access memory and a maximum of 6 central processing unit cores allotted.
Familywise error rate
Because of the high computational burden of genomewide association studies, we illustrated FWER control of each inference test using a single simulation with m = 485,000 tests. As Figures 1 and 2 show, when compared against the expected P-value distribution under the null hypothesis, the P values obtained from naive calculations appeared to be too liberal in both scenarios, as suggested by the systematic upward departure from the diagonal line. P values from the covariance test were also smaller than expected across scenarios.
Figure 1.
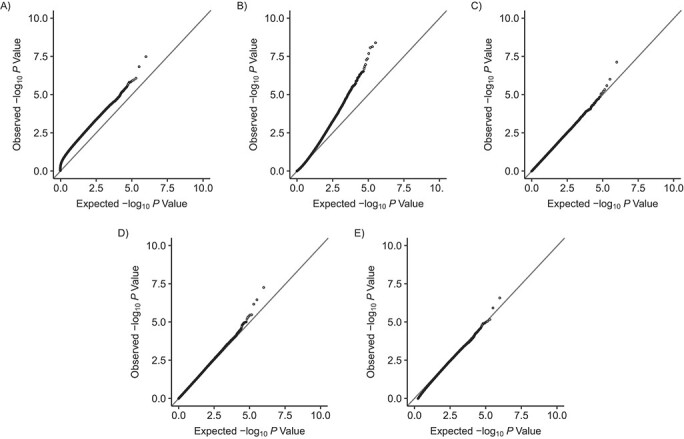
Q-Q plots comparing the expected P values with the observed P values simulated under the null for naive calculations and 4 postselection inference methods (n = 700) with normal outcomes, where the outcome variables were simulated to follow a normal distribution (scenario 1). A) Naive calculations; B) covariance test (27); C) selective inference (29); D) max-|t|-test (26); E) Bonferroni correction. Simulations were based on data obtained from the Avon Longitudinal Study of Parents and Children (England, 1991–2000).
Figure 2.
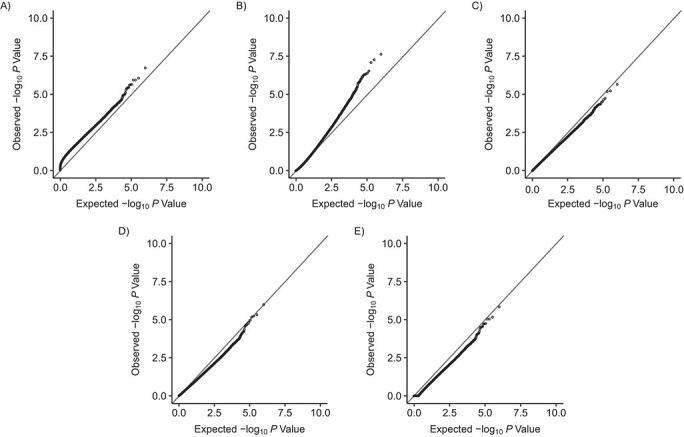
Q-Q plots comparing the expected P values with the observed P values simulated under the null for naive calculations and 4 postselection inference methods (n = 700) with empirical outcomes, where the outcome variables were resampled from observed DNA methylation values (scenario 2). A) Naive calculations; B) covariance test (27); C) selective inference (29); D) max-|t|-test (26); E) Bonferroni correction. Simulations were based on data obtained from the Avon Longitudinal Study of Parents and Children (England, 1991–2000).
With normally distributed outcomes in scenario 1, the P values from the Bonferroni correction, the max-|t|-test, and the selective inference method followed the expected distributions closely (Figure 1). With empirical DNAm outcomes in scenario 2, P values from the 3 methods seemed conservative (Figure 2). Transforming the DNAm (β) values to M values did not affect the results (Web Figure 1). Together, these findings suggest that 3 methods adequately controlled the FWER: Bonferroni correction, the max-|t|-test, and the selective inference method. Web Appendix 1 and Web Table 4 show estimates of FWER obtained from repeated simulation experiments when the number of tests ranged from m = 1 to m = 1,000.
Statistical power and confidence interval coverage
We assessed the statistical power of the 3 methods that adequately controlled FWER. We did not evaluate the performance of the covariance test or naive calculation, as these methods would have their statistical power unfairly inflated by their tendency to fail to reject the null hypothesis.
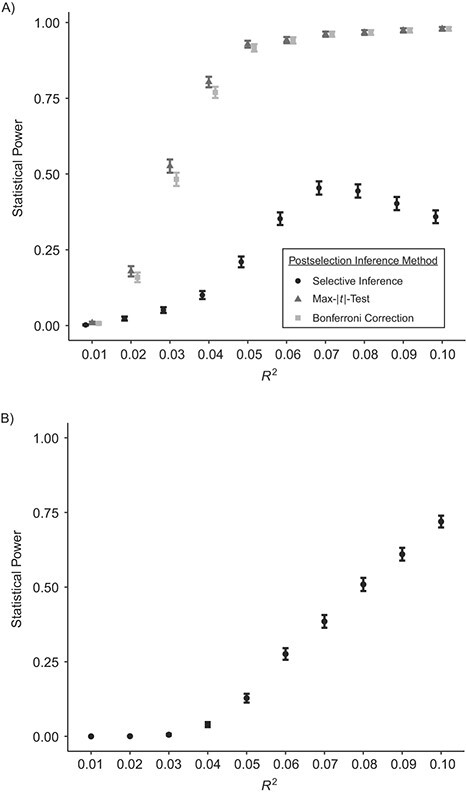
Results suggested there was very little difference in statistical power between the 3 methods (Figure 3); they all had ideal statistical power (over 80%) when the effects were moderate to large (R2 > 0.06 in scenario 1; ΔDNAm > 0.25 in scenario 2). With normal outcomes, selective inference achieved ideal confidence interval coverage (around 95%) across all effect sizes with sample size n = 700; the max-|t|-test had slightly lower coverage when the effect size was small (R2 < 0.03). With outcomes simulated from beta distributions, the confidence interval coverage probabilities were below the desired level (95%) when the between-group difference (ΔDNAm) was below 0.3, though they exceeded 95% as the effect size increased. Bonferroni-corrected confidence intervals were overly conservative across effect sizes and scenarios, as expected (Figure 4).
Figure 3.
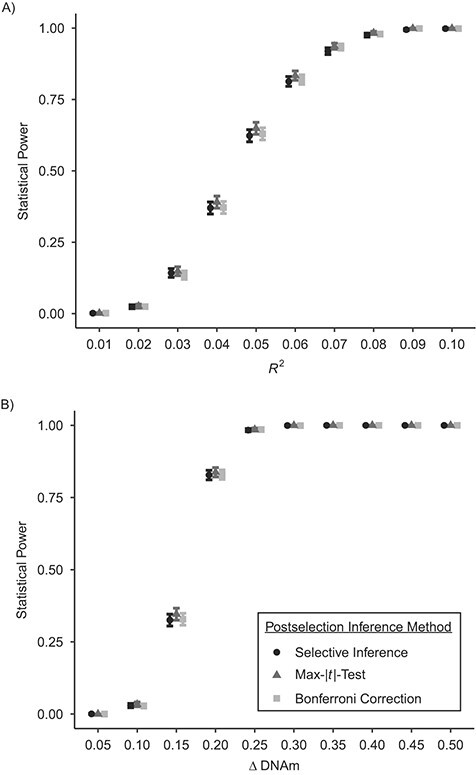
Estimated statistical power in simulated epigenomewide analyses of the time-dependent relationship between childhood abuse and DNA methylation (n = 700), with varying effect sizes. A) Normal outcomes; B) beta-distributed outcomes. Technical details about selective inference (29) and the max-|t|-test (26) are provided in Web Appendix 1. Simulations were based on data obtained from the Avon Longitudinal Study of Parents and Children (England, 1991–2000). Bars, 95% confidence intervals. DNAm, DNA methylation.
Figure 4.
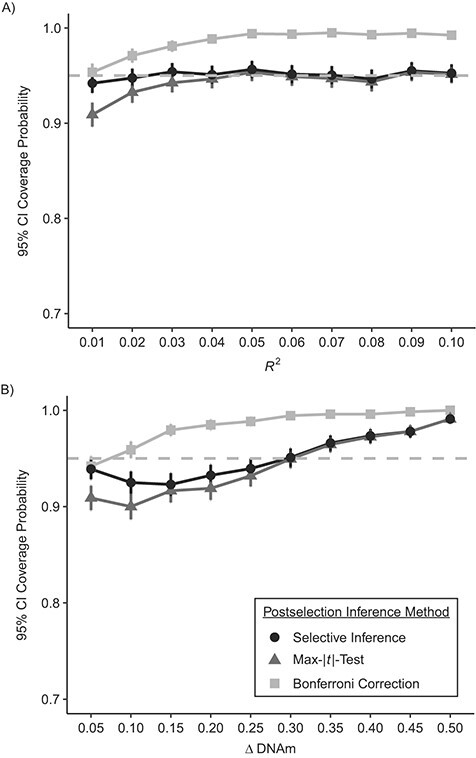
Estimated confidence interval (CI) coverage probability in simulated epigenomewide analyses of the time-dependent relationship between childhood abuse and DNA methylation (n = 700), with varying effect sizes. The gray dashed line corresponds to the prespecified coverage probability (95%). A) Normal outcomes; B) beta-distributed outcomes. Technical details about selective inference (29) and the max-|t|-test (26) are provided in Web Appendix 1. Simulations were based on data obtained from the Avon Longitudinal Study of Parents and Children (England, 1991–2000). Bars, 95% CIs. DNAm, DNA methylation.
Robustness to model misspecification
If none of the predictors represent the true underlying life-course hypothesis, a misspecified model may be selected. In our simulations of this case, we found that the accumulation or recency model was often selected, because these models were highly correlated with the true predictor—ever being exposed versus never being exposed (raccumulation = 0.89, rrecency = 0.82). However, the power was reduced in comparison with a correctly specified model (Web Figure 2). If the true hypothesis is represented by 2 or more predictors (i.e., a compound hypothesis), the power to select 1 of these predictors may be diminished. In our simulations, the power to select 1 predictor was lower for selective inference (Figure 5). However, selective inference is the only method available for postselection inference on the second predictor that does not inflate the FWER. Statistical power increased with sample size for all methods considered (Web Figure 3).
Figure 5.
Estimated statistical power in simulated epigenomewide analyses of the time-dependent relationship between childhood abuse and DNA methylation (n = 700), with varying effect sizes, when the true causal relationship was represented by 2 hypotheses working in combination. A) Statistical power of selection of the first hypothesis (n = 700), when the true hypothesis is a compound hypothesis; B) statistical power of selection of the second hypothesis (n = 700), when the true hypothesis is a compound hypothesis. Technical details about selective inference (29) and the max-|t|-test (26) are provided in Web Appendix 1. Simulations were based on data obtained from the Avon Longitudinal Study of Parents and Children (England, 1991–2000). Bars, 95% confidence intervals.
Empirical analyses
Using the covariance test, Dunn et al. (23) identified 5 CpG sites in ALSPAC that showed differential methylation profiles at age 7 years following exposure to physical or sexual abuse in childhood; the “sensitive period” model was the selected life-course theory for these 5 sites. We performed the genomewide SLCMA analyses using 2 other postselection inference methods that showed no inflation in FWER and desired confidence interval coverage: the max-|t|-test and the selective inference method. Results are shown in Web Table 1. While neither method identified any CpG site as significantly associated using a stringent Bonferroni-corrected P value threshold of P < 1 ×10⁻⁷, the CpG site with the smallest P value from the covariance test (cg06430102) remained the CpG with the smallest P value (out of the 485,000 CpG sites tested) for the 2 alternative methods (Web Table 1). The confidence intervals calculated on the basis of the covariance test, selective inference, and the max-|t|-test substantially overlapped (Figure 6; Web Table 1). On a genomewide level, concordance between the liberal covariance test and the recommended selective inference method was high, implying that both methods agreed on the loci that had the strongest associations with exposure (Web Table 2).
Figure 6.
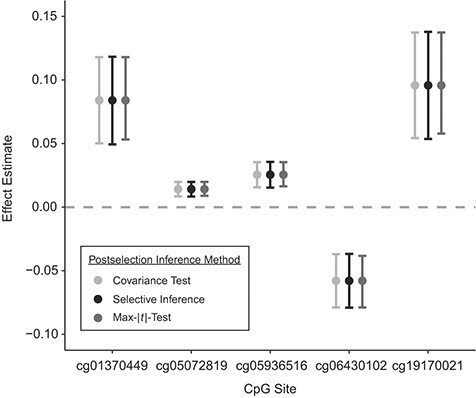
Overlap between confidence intervals based on the covariance test, selective inference, and the max-|t|-test in the empirical example examining the time-dependent relationship between childhood abuse and genomewide DNA methylation, showing the top 5 loci. Technical details about the covariance test (27), selective inference (29), and the max-|t|-test (26) are provided in Web Appendix 1. Simulations were based on data obtained from the Avon Longitudinal Study of Parents and Children (England, 1991–2000). Bars, 95% confidence intervals. CpG, cytosine-phosphate-guanine.
After we applied the Frisch-Waugh-Lovell theorem to additionally adjust for covariates, the P values decreased at all 5 loci (Web Figure 4), suggesting that the approach improved statistical power while retaining control for confounding (Web Figure 5).
DISCUSSION
As the availability of longitudinal biological and phenotypic data grows in the era of “big data,” combining -omics technologies with rigorous epidemiologic methods can reveal critical new knowledge about biological mechanisms (38–40). Specifically, methods from life-course epidemiology can be translated to “harness the ‘omics’ revolution” (2, p. 984) and provide insights into how exposures become biologically embedded. We showed that, under a set of untestable assumptions, one such method—the SLCMA—can be used to directly compare life-course theories and can be scaled up to answer nuanced questions about time-dependent exposure-omics relationships. For example, if an early childhood sensitive-period hypothesis was selected for a locus known to be implicated in circadian rhythms, this finding could point to ways in which the biological clock is influenced by exposures during periods of heightened plasticity. If the accumulation hypothesis was selected for most of the loci implicated in inflammation, this finding could suggest dose-response relationships between the exposure and inflammatory responses.
Importantly, not all SLCMA methods for statistical inference are suitable in high-throughput applications. Our findings recommend the selective inference method and the max-|t|-test for postselection inference in -omics applications. Our simulations also showed that statistical power to detect effects depended on effect size but not necessarily on the postselection inference method used. When deciding between these 2 inference methods, researchers will need to consider several factors, including analytical goals and study-specific contexts, as both methods have strengths and limitations in these areas (Web Appendix 1). The simulation analyses highlight the value of using simulations in scientific research (41, 42), especially when theoretical assumptions may be violated in a new-application setting.
The empirical example presented in this paper extended the analyses performed by Dunn et al. (23), using 1 of the exposures and the same DNAm data (Web Appendix 3). However, these analyses differed by considering 2 alternative postselection inference methods (selective inference and the max-|t|-test) in the simulations. Comparing the covariance test with these 2 methods, we showed that statistical significance based on P values may differ across methods. The main reason for the discordance between the max-|t|-test and the 2 least absolute shrinkage and selection operator (LASSO)-based tests is that the max-|t|-test considers only the first predictor selected, whereas the selected inference is based on LASSO models that also consider subsequent predictors. Researchers should assess P values in parallel with effect estimates and confidence intervals, as decision rules of significance based on P values of 1 method may be biased due to inflation or overcorrection. Triangulating evidence from multiple sources and methods may suggest directions for future replication (43). For example, a CpG that was identified as the top site by multiple methods and showed substantial changes in methylation levels between exposed and unexposed individuals may be more likely to capture effects of the exposure and worth pursuing in experimental validation.
Like any statistical method aspiring to address causal questions, the SLCMA relies on the usual assumptions that the model is correctly specified and that there is no unmeasured confounding (44). In simulations, we showed that when the model is misspecified, the SLCMA will identify hypothesized models with predictors that are correlated with the true model’s predictors, but with reduced power. Therefore, SLCMA users must recognize that the selected hypothesis simply explains the most variation out of the (combinations of) candidate hypotheses considered, and there may be another (or nontested) theoretical model that explains more variation. Thus, careful formulation of the hypotheses is critical to capture the most plausible causal relationship based on prior literature or reasoning; consideration of alternative hypotheses (beyond those already selected) is also needed as research evidence grows. We would also emphasize that the selection of life-course models is based both on proper specification of the relevant hypothesis and on the set of candidate hypotheses included. For example, in our set of candidate hypotheses, we considered 1 sensitive period per time point when the exposure was measured. This approach may be inappropriate when the measurements are assessed close together in time: For example, for some exposure-outcome pairs, we might not claim to distinguish a sensitive period at 1.5 years from one at 2.5 years. In such cases, we recommend possibly condensing measurements into longer sensitive periods, taking the average exposure over all measurements in a time period defined by prior literature or reasoning. Such an approach increases the statistical power of variable selection procedures by reducing the number of and correlation between predictors.
The SLCMA has some limitations beyond the usual assumptions: In the current study, we assumed that the true hypothesis was represented by a single predictor (i.e., a simple hypothesis). Identifying more complicated exposure-outcome relationships in -omics settings may be of interest but will require large sample sizes to achieve sufficient power. Moreover, the SLCMA currently does not accommodate time-varying confounding. It also does not allow for a different set of confounders for each hypothesis. In the empirical analyses, we tried to include a comprehensive set of baseline covariates based on prior literature that may be related to both childhood abuse and epigenetic changes. In light of these issues, the current results should be interpreted as suggestive evidence of loci that warrant future examination and replication in other data sets. Efforts to incorporate time-varying confounding into the SLCMA, such as marginal structural models (45, 46), are also needed.
Several other limitations of the current study are notable. First, although we varied the effect size and compared normal distributions of the outcome variable with empirical distributions of the outcome variable, we did not vary the distribution or correlation of the exposures, because of the number of possible combinations of these parameters. Thus, we encourage researchers to perform their own simulations to better understand the statistical properties of the SLCMA in their specific research context. Second, we restricted our analyses to linear-regression–based model selection; a brief discussion on the possibility of implementing postselection inference methods for generalized linear models is included in Web Appendix 1. Third, as suggested by the simulations, a typical longitudinal epigenetic study with a sample size under 1,000 is probably underpowered to detect small effects. In particular, when studying psychosocial exposures such as childhood abuse, we would not expect the exposure to have a large effect on DNAm at a single locus. For instance, power would likely be under 50% and confidence interval coverage may be lower than 95% when the outcome variation explained is below 5%, which has been common in previous epigenomewide association studies. One approach for improving statistical power is to combine data or summary results from multiple samples and perform a mega-/meta-analysis; development of methods for meta-analyzing results from SLCMA analyses is an important goal of future work. Another approach is to use the Frisch-Waugh-Lovell theorem for covariate adjustment, which leads to improvement in power, as we have shown in this paper. Fourth, the current SLCMA framework in the -omics setting does not restrict or penalize any loci based on their biological significance. One promising direction of future research is to leverage functional or regulatory information about the genomic regions under consideration (47, 48), especially when developmental stage-specific knowledge is available, in order to improve power and gain biological insights.
In conclusion, the SLCMA is a useful approach that brings the life-course perspective into the -omics context. Compared with an analysis that only categorizes exposure status as exposed versus unexposed, the SLCMA not only offers additional mechanistic insights about exposure mechanisms but also increases statistical power when the true underlying exposure-outcome relationship is more nuanced (23). As a field, epidemiology should move beyond analyses of the presence versus absence of exposure and make full use of repeatedly measured phenotypic and -omics data to generate knowledge that improves human health over the life course.
Supplementary Material
ACKNOWLEDGMENTS
Author affiliations: Center for Genomic Medicine, Massachusetts General Hospital, Boston, Massachusetts, United States (Yiwen Zhu, Alexandre A. Lussier, Erin C. Dunn); School of Mathematics, Statistics and Applied Mathematics, National University of Ireland, Galway, Ireland (Andrew J. Simpkin); MRC Integrative Epidemiology Unit, School of Social and Community Medicine, University of Bristol, Bristol, United Kingdom (Matthew J. Suderman, Esther Walton); Department of Psychiatry, Harvard Medical School, Boston, Massachusetts, United States (Alexandre A. Lussier, Erin C. Dunn); Department of Psychology, Faculty of Humanities and Social Sciences, University of Bath, Bath, United Kingdom (Esther Walton); Stanley Center for Psychiatric Research, Eli and Edythe L. Broad Institute of MIT and Harvard, Cambridge, Massachusetts, United States (Erin C. Dunn); Henry and Alison McCance Center for Brain Health, Massachusetts General Hospital, Boston, Massachusetts, United States (Erin C. Dunn); and Applied Statistics Group, University of the West of England, Bristol, United Kingdom (Andrew D. A. C. Smith).
Both senior authors (E.C.D. and A.D.A.C.S.) contributed equally to thiswork.
This work was supported by the National Institute of Mental Health, US National Institutes of Health (grant R01MH113930 awarded to E.C.D.). E.W. was supported by the Cohort and Longitudinal Studies Enhancement Resources (CLOSER) Consortium, which is funded by the Economic and Social Research Council and the Medical Research Council (MRC) (grant ES/K000357/1). The MRC and the Wellcome Trust (grant 102215/2/13/2) and the University of Bristol provide core support for the Avon Longitudinal Study of Parents and Children (ALSPAC). Creation of the Accessible Resource for Integrated Epigenomic Studies (ARIES), comprising a subsample of ALSPAC participants, was funded by the Biotechnology and Biological Sciences Research Council (grants BBI025751/1 and BB/I025263/1). Supplementary funding for generation of DNA methylation data, which were included in ARIES, was obtained from the MRC, the Economic and Social Research Council, the National Institutes of Health, and other sources. ARIES is maintained under the auspices of the MRC Integrative Epidemiology Unit at the University of Bristol (grants MC_UU_12013/2 and MC_UU_12013/8). A comprehensive list of funding grants is available on the ALSPAC website (http://www.bristol.ac.uk/alspac/external/documents/grant-acknowledgements.pdf).
The content of this article is solely the responsibility of the authors and does not necessarily represent the official views of the National Institutes of Health. The funders played no role in the design, execution, analysis, or interpretation of the data or in the writing of the manuscript. This publication is the work of the authors, each of whom serves as a guarantor for the contents of this paper.
We are extremely grateful to all of the families who took part in the ALSPAC Study, the midwives for their help in recruiting them, and the whole ALSPAC team, which includes interviewers, computer and laboratory technicians, clerical workers, research scientists, volunteers, managers, receptionists, and nurses.
This paper was partly presented in poster form at the 35th Annual Meeting of the International Society for Traumatic Stress Studies, Boston, Massachusetts, November 14–16, 2019. It was also presented as a poster at the 53rd Annual Meeting of the Society for Epidemiologic Research, held virtually on December 16–18, 2020.
Conflict of interest: none declared.
REFERENCES
- 1. De Stavola BL, Nitsch D, Santos Silva I, et al. Statistical issues in life course epidemiology. Am J Epidemiol. 2006;163(1):84–96. [DOI] [PubMed] [Google Scholar]
- 2. Ben-Shlomo Y, Cooper R, Kuh D. The last two decades of life course epidemiology, and its relevance for research on ageing. Int J Epidemiol. 2016;45(4):973–988. [DOI] [PMC free article] [PubMed] [Google Scholar]
- 3. Kuh D, Cooper R, Hardy R, et al., eds. A Life Course Approach to Healthy Ageing. Oxford, United Kingdom: Oxford University Press; 2013. [Google Scholar]
- 4. Ben-Shlomo Y, Kuh D. A life course approach to chronic disease epidemiology: conceptual models, empirical challenges and interdisciplinary perspectives. Int J Epidemiol. 2002;31(2):285–293. [PubMed] [Google Scholar]
- 5. Kuh D. A Life Course Approach to Chronic Disease Epidemiology. Oxford, United Kingdom: Oxford University Press; 1997:344. [Google Scholar]
- 6. Koenen KC, Rudenstine S, Susser E, et al., eds. A Life Course Approach to Mental Disorders. Oxford, United Kingdom: Oxford University Press; 2013. [Google Scholar]
- 7. Mishra G, Nitsch D, Black S, et al. A structured approach to modelling the effects of binary exposure variables over the life course. Int J Epidemiol. 2009;38(2):528–537. [DOI] [PMC free article] [PubMed] [Google Scholar]
- 8. Efron B, Hastie T, Johnstone I, et al. Least angle regression. Ann Stat. 2004;32(2):407–499. [Google Scholar]
- 9. Smith ADAC, Heron J, Mishra G, et al. Model selection of the effect of binary exposures over the life course. Epidemiology. 2015;26(5):719–726. [DOI] [PMC free article] [PubMed] [Google Scholar]
- 10. Smith ADAC, Hardy R, Heron J, et al. A structured approach to hypotheses involving continuous exposures over the life course. Int J Epidemiol. 2016;45(4):1271–1279. [DOI] [PMC free article] [PubMed] [Google Scholar]
- 11. Madathil S, Joseph L, Hardy R, et al. A Bayesian approach to investigate life course hypotheses involving continuous exposures. Int J Epidemiol. 2018;47(5):1623–1635. [DOI] [PMC free article] [PubMed] [Google Scholar]
- 12. Dunn EC, Soare TW, Raffeld MR, et al. What life course theoretical models best explain the relationship between exposure to childhood adversity and psychopathology symptoms: recency, accumulation, or sensitive periods? Psychol Med. 2018;48(15):2562–2572. [DOI] [PMC free article] [PubMed] [Google Scholar]
- 13. Cooper R, Mishra GD, Kuh D. Physical activity across adulthood and physical performance in midlife: findings from a British birth cohort. Am J Prev Med. 2011;41(4):376–384. [DOI] [PMC free article] [PubMed] [Google Scholar]
- 14. Evans J, Melotti R, Heron J, et al. The timing of maternal depressive symptoms and child cognitive development: a longitudinal study. J Child Psychol Psychiatry. 2012;53(6):632–640. [DOI] [PubMed] [Google Scholar]
- 15. Wills AK, Black S, Cooper R, et al. Life course body mass index and risk of knee osteoarthritis at the age of 53 years: evidence from the 1946 British birth cohort study. Ann Rheum Dis. 2012;71(5):655–660. [DOI] [PMC free article] [PubMed] [Google Scholar]
- 16. Bann D, Kuh D, Wills AK, et al. Physical activity across adulthood in relation to fat and lean body mass in early old age: findings from the Medical Research Council National Survey of Health and Development, 1946–2010. Am J Epidemiol. 2014;179(10):1197–1207. [DOI] [PMC free article] [PubMed] [Google Scholar]
- 17. Dunn EC, Crawford KM, Soare TW, et al. Exposure to childhood adversity and deficits in emotion recognition: results from a large, population-based sample. J Child Psychol Psychiatry. 2018;59(8):845–854. [DOI] [PMC free article] [PubMed] [Google Scholar]
- 18. Nicolau B, Madathil SA, Castonguay G, et al. Shared social mechanisms underlying the risk of nine cancers: a life course study. Int J Cancer. 2019;144(1):59–67. [DOI] [PubMed] [Google Scholar]
- 19. Huang JY, Gavin AR, Richardson TS, et al. Accounting for life-course exposures in epigenetic biomarker association studies: early life socioeconomic position, candidate gene DNA methylation, and adult cardiometabolic risk. Am J Epidemiol. 2016;184(7):520–531. [DOI] [PMC free article] [PubMed] [Google Scholar]
- 20. Hughes A, Smart M, Gorrie-Stone T, et al. Socioeconomic position and DNA methylation age acceleration across the life course. Am J Epidemiol. 2018;187(11):2346–2354. [DOI] [PMC free article] [PubMed] [Google Scholar]
- 21. Everson TM, Marsit CJ. Integrating -omics approaches into human population-based studies of prenatal and early-life exposures. Curr Environ Health Rep. 2018;5(3):328–337. [DOI] [PMC free article] [PubMed] [Google Scholar]
- 22. Visscher PM, Wray NR, Zhang Q, et al. 10 years of GWAS discovery: biology, function, and translation. Am J Hum Genet. 2017;101(1):5–22. [DOI] [PMC free article] [PubMed] [Google Scholar]
- 23. Dunn EC, Soare TW, Zhu Y, et al. Sensitive periods for the effect of childhood adversity on DNA methylation: results from a prospective, longitudinal study. Biol Psychiatry. 2019;85(10):838–849. [DOI] [PMC free article] [PubMed] [Google Scholar]
- 24. Amrhein V, Greenland S, McShane B. Scientists rise up against statistical significance. Nature. 2019;567(7748):305–307. [DOI] [PubMed] [Google Scholar]
- 25. Wasserstein RL, Schirm AL, Lazar NA. Moving to a world beyond “p < 0.05”. Am Stat. 2019;73(suppl 1):1–19. [Google Scholar]
- 26. Buja A, Brown L. Discussion: a significance test for the lasso. Ann Stat. 2014;42(2):509–517. [DOI] [PMC free article] [PubMed] [Google Scholar]
- 27. Lockhart R, Taylor J, Tibshirani RJ, et al. A significance test for the lasso. Ann Stat. 2014;42(2):413–468. [DOI] [PMC free article] [PubMed] [Google Scholar]
- 28. Lockhart R, Taylor J, Tibshirani R, et al. Package ‘covTest’. (R package, version 1.02). https://cran.r-project.org/web/packages/covTest/index.html. Published August 14, 2013. Accessed January 23, 2019.
- 29. Tibshirani RJ, Taylor J, Lockhart R, et al. Exact post-selection inference for sequential regression procedures. J Am Stat Assoc. 2016;111(514):600–620. [Google Scholar]
- 30. Tibshirani R, Tibshirani R, Taylor J, et al. Package ‘selectiveInference’. (R package, version 1.2.0). https://cran.r-project.org/web/packages/selectiveInference/selectiveInference.pdf. Published September 7, 2019. Accessed October 4, 2017.
- 31. thedunnlab . simulations. https://github.com/thedunnlab/simulations. Published October 11, 2019. Accessed March 16, 2021. [Google Scholar]
- 32. Tsai P-C, Bell JT. Power and sample size estimation for epigenome-wide association scans to detect differential DNA methylation. Int J Epidemiol. 2015;44(4):1429–1441. [DOI] [PMC free article] [PubMed] [Google Scholar]
- 33. Richmond RC, Simpkin AJ, Woodward G, et al. Prenatal exposure to maternal smoking and offspring DNA methylation across the lifecourse: findings from the Avon Longitudinal Study of Parents and Children (ALSPAC). Hum Mol Genet. 2015;24(8):2201–2217. [DOI] [PMC free article] [PubMed] [Google Scholar]
- 34. Sharp GC, Lawlor DA, Richmond RC, et al. Maternal pre-pregnancy BMI and gestational weight gain, offspring DNA methylation and later offspring adiposity: findings from the Avon Longitudinal Study of Parents and Children. Int J Epidemiol. 2015;44(4):1288–1304. [DOI] [PMC free article] [PubMed] [Google Scholar]
- 35. Frisch R, Waugh FV. Partial time regressions as compared with individual trends. Econometrica. 1933;1(4):387–401. [Google Scholar]
- 36. Lovell MC. Seasonal adjustment of economic time series and multiple regression analysis. J Am Stat Assoc. 1963;58(304):993–1010. [Google Scholar]
- 37. Yamada H. The Frisch–Waugh–Lovell theorem for the lasso and the ridge regression. Commun Stat Theory Methods. 2017;46(21):10897–10902. [Google Scholar]
- 38. Khoury MJ. A primer series on -omic technologies for the practice of epidemiology. Am J Epidemiol. 2014;180(2):127–128. [DOI] [PMC free article] [PubMed] [Google Scholar]
- 39. Khoury MJ. Planning for the future of epidemiology in the era of big data and precision medicine. Am J Epidemiol. 2015;182(12):977–979. [DOI] [PMC free article] [PubMed] [Google Scholar]
- 40. Kuller LH. Epidemiologists of the future: data collectors or scientists? Am J Epidemiol. 2019;188(5):890–895. [DOI] [PubMed] [Google Scholar]
- 41. König IR. Presidential address: six open questions to genetic epidemiologists. Genet Epidemiol. 2019;43(3):242–249. [DOI] [PMC free article] [PubMed] [Google Scholar]
- 42. Morris TP, White IR, Crowther MJ. Using simulation studies to evaluate statistical methods. Stat Med. 2019;38(11):2074–2102. [DOI] [PMC free article] [PubMed] [Google Scholar]
- 43. Lawlor DA, Tilling K, Davey SG. Triangulation in aetiological epidemiology. Int J Epidemiol. 2016;45(6):1866–1886. [DOI] [PMC free article] [PubMed] [Google Scholar]
- 44. Howe LD, Smith AD, MacDonald-Wallis C, et al. Relationship between mediation analysis and the structured life course approach. Int J Epidemiol. 2016;45(4):1280–1294. [DOI] [PMC free article] [PubMed] [Google Scholar]
- 45. Robins JM, Hernán MA, Brumback B. Marginal structural models and causal inference in epidemiology. Epidemiology. 2000;11(5):550–560. [DOI] [PubMed] [Google Scholar]
- 46. Cole SR, Hernán MA. Constructing inverse probability weights for marginal structural models. Am J Epidemiol. 2008;168(6):656–664. [DOI] [PMC free article] [PubMed] [Google Scholar]
- 47. Kim S, Schliekelman P. Prioritizing hypothesis tests for high throughput data. Bioinformatics. 2016;32(6):850–858. [DOI] [PubMed] [Google Scholar]
- 48. Iotchkova V, Ritchie GRS, Geihs M, et al. GARFIELD classifies disease-relevant genomic features through integration of functional annotations with association signals. Nat Genet. 2019;51(2):343–353. [DOI] [PMC free article] [PubMed] [Google Scholar]
Associated Data
This section collects any data citations, data availability statements, or supplementary materials included in this article.