

Abstract
Amidst a global pandemic, a precise and widely accessible rapid detection method is needed for accurate diagnosis and contact tracing. The lack of this technology was exposed through the outbreak of SARS-CoV-2 beginning in 2019. This study sets the foundation for the development of a boron doped diamond (BDD)-based impedimetric sensor. While specifically developed for use in the detection of SARS-CoV-2, this technology uses principles that could be adapted to detect other viruses in the future. Boron doped polycrystalline diamond electrodes were functionalized with a biotin-streptavidin linker complex and biotinylated anti-SARS-CoV-2 S1 antibodies. Electrodes were then incubated with the S1 subunit of the SARS-CoV-2 spike surface protein, and an electrical response was recorded using the changes to the electrode's charge transfer resistance (Rct), measured through electrochemical impedance spectroscopy (EIS). Detectable changes in the Rct were observed after 5-min incubation periods with S1 subunit concentrations as low as 1 fg/mL. Incubation with Influenza-B Hemagglutinin protein resulted in minimal change to the Rct, indicating specificity of the BDD electrode for the S1 subunit of SARS-CoV-2. Detection of the S1 subunit in a complex (cell culture) medium was also demonstrated by modifying the EIS protocol to minimize the effects of sample matrix binding. BDD films of varying surface morphologies were investigated, and material characterization was used to give insight into the microstructure-performance relationship of the BDD sensing surface.
Keywords: SARS-CoV-2, Boron doped diamond, Biosensor, Impedimetric sensor
Graphical abstract

1. Introduction
The novel coronavirus, severe acute respiratory syndrome coronavirus 2 (SARS-CoV-2), which causes coronavirus disease 2019 (COVID-19), appeared in December 2019 and led to a human pandemic [1]. SARS-CoV-2 belongs to the same family as both the severe acute respiratory syndrome associated coronavirus (SARS-CoV) and the Middle East respiratory syndrome coronavirus (MERS-CoV). Coronaviruses (CoVs) are a group of pathogenic enveloped viruses that have a positive, single-stranded RNA genome [2]. Compared to SARS-CoV and MERS-CoV, SARS-CoV-2 has superior human-to-human transmission, causing rapid spread among populations. The virus primarily affects the respiratory system, causing flu-like symptoms such as a cough, fever, and in more severe cases, acute respiratory distress syndrome and respiratory failure [3]. In addition, COVID-19 is now known to manifest as systemic inflammation, potentially leading to sepsis, severe cardiac injury, heart failure, and multi-organ dysfunction in high-risk patients [4].
The rapid identification of the genetic sequence and etiology of the virus through international collaboration resulted in the fast availability of Real Time-polymerase chain reaction (RT-PCR) diagnostic tests. The RT-PCR test allows for the diagnosis of patients in an effort to contain the pandemic. However, RT-PCR requires expensive instrumentation, takes several hours to perform, and patients often have to wait multiple days to receive results [5]. Rapid antigen tests currently on the market for point-of-care and in-home use can provide results in minutes, however their low sensitivity remains an issue. Current rapid tests require the patient to have a high viral load, therefore the detection of the virus can only be accomplished during a narrow window of time after infection, leading to high false negative rates [6]. Rapid and accurate testing modalities are still lacking, but many research groups worldwide have published novel detection platforms over the last year, which have been documented in a number of review articles [7].
Electrochemical detection platforms have many advantages, such as fast speed, low cost, good stability, high accuracy, and wide detection range, and are one alternative to current testing methods that can satisfy the demands of rapid testing amid the current pandemic. These platforms consist of three elements: transduction, biorecognition, and electrochemical measurement [8]. The transducer is an electrochemical cell, typically in a three electrode configuration, though two electrode systems are sometimes used. The working electrode is most commonly what is modified by a biorecognition element, which could be an antibody, protein, oligonucleotide, or other biomolecule. The electrochemical cell transforms the binding of an analyte to the biorecognition element into an electrochemical signal that can be measured using potentiometry, amperometry, impedance, or other measurement technique. The generation of an electrochemical signal upon target analyte binding enables the rapid and specific detection of antigens, often at very low concentrations. A number of electrochemical biosensors for SARS-CoV-2 have been developed over the past year [7], [9], [10], [11], [12], [13], [14], [15].
Working electrodes for electrochemical biosensors encompass a broad range of conducting and semiconducting metals and nonmetals, including gold, platinum, indium tin oxide (ITO), as well as carbon and graphite [8]. Among these, boron doped diamond (BDD) is a particularly attractive electrode material for biosensing applications due to its biocompatibility and excellent electronic, chemical, and mechanical properties [16]. BDD's wide potential window and low background current in aqueous and mixed aqueous-organic solutions (ca ~3.0 V to 3.5 V) allow for highly specific and sensitive electrochemical measurements [16]. The presence of functional groups on BDD surfaces also allows for a wide variety of coupling chemistries and covalent attachment of moieties for impedimetric sensing techniques. The covalent attachment of receptor molecules allows for the fabrication of highly stable, perhaps even reusable sensors.
Electrodes can also be classified based on form factor, as manufacturing processes may be employed to produce electrodes as bulk structures, nanowires, interdigitated arrays, and many others [8]. The ability to deposit BDD as thin films on a variety of substrates has allowed for its diverse application in biosensing, where BDD has been used for environmental monitoring and control, food and drug analysis, detection of biological metabolites, and many other sensing applications [17]. BDD electrodes can be manufactured in a variety of form factors to be tailored to the specific application. Examples include BDD microfibers for neurochemical analysis [18], and BDD 3-in-1 sensing platforms for isatin detection [19]. Furthermore, the properties of BDD electrodes can be tuned to fit the end use case. Modifications to the growth process can produce BDD films of varying boron doping concentration, film thickness, grain size, and non-diamond (sp2) carbon content, which in turn affect the resulting physical and electrical properties of the film [20].
Here, we report on a BDD-based impedimetric biosensor for the detection of SARS-CoV-2 S1 subunit proteins, with a focus on the structure-property-performance relationships of BDD films grown under varying conditions. The sensor consists of a BDD electrode surface functionalized with anti-S1 antibodies, to which S1 subunit proteins may bind. Antibody surface functionalization was accomplished using a passive approach previously reported by Rogien et al. for diamond surfaces, which differs from electrografting methods typically used for functionalizing BDD [21], [22], [23], [24], [25]. After 5-min incubation periods, binding of the S1 subunit at concentrations as low as 1 fg/mL was detected via electrical impedance spectroscopy (EIS) through increases in the charge transfer resistance (Rct) of the cell. The BDD sensors' ability to detect the S1 subunit in a complex media was also demonstrated using a cell culture medium as a model system.
2. Materials and methods
2.1. BDD film growth
Three BDD films were investigated and will be referred to by their film thickness: 8.0 μm, 3.6 μm and 0.7 μm. The 3.6 μm and 0.7 μm BDD films were grown in a 915 MHz microwave plasma assisted chemical vapor deposition (MWPA-CVD) system on 4″ ø electrically conductive, p+ type silicon wafer substrates. The 8.0 μm film was grown by hot filament chemical vapor deposition (HF-CVD) and was procured from a commercial source (CONDIAS GmbH). The growth conditions for the 3.6 μm and 0.7 μm films were as follows: pressure of 60 Torr, microwave power of 6 kW, methane concentration of 2% balanced with hydrogen and diborane as the boron precursor, and boron-to-carbon ratio in the gas phase of 3750 ppm (0.3750%). Using these growth conditions, two different film thicknesses were grown by adjusting the deposition time. A growth time of 7 and 2 h yielded a film thickness of 3.6 μm and 0.7 μm, respectively.
2.2. Material characterization
Atomic force microscopy (AFM; Hitachi 5000 II) was used to image the surface topography of each sample and the change with the addition of functional groups and biomolecules. A 10 μm × 10 μm (512 px × 512 px, 20 nm/px) area was scanned with a standard pyramidal AFM n-type silicon probe (MicroMasch®, HQ:NSC14/Al BS, tip radius 8 nm, resonance frequency 160 kHz, bulk resistivity 0.01–0.025 Ω∗cm). The open source data analysis software Gwyddion [26] was utilized to process the images and to determine the aerial root mean square surface roughness, Sq. To compare the composition of the surfaces before and after functionalization, X-ray photoelectron spectroscopy (XPS; Perkin Elmer Phi 5400 ESCA system) with a non-monochromatic aluminum Kα X-ray source was employed. Carbon (C1s) was used to calibrate the sample charging for XPS measurements. XPS data was fit using PHI Multipak (v8.0) software. Cross sections of the BDD as-grown samples were investigated by scanning electron microscopy (SEM; JEOL 6610LV, tungsten emitter) to determine the film thickness (Fig. S4).
The Raman spectra of each sample were collected using a LabRAM ARAMIS (Horiba Scientific, Piscataway, NJ) confocal Raman microscope with 532.15 nm Nd-YAG laser. Boron doping of diamond results in the presence of a band at 500 cm−1 in the Raman spectrum, which can be used to approximate the boron concentration of the film [27]. The center of the Lorenztian component of the peak at 500 cm−1 downshifts as a function of the boron concentration, and can therefore be used to estimate the boron doping concentration.
Quantitative measurement of the boron concentration of the films was performed using secondary ion mass spectrometry (SIMS). Samples were sent to EAG Laboratories in Sunnyvale, CA for SIMS analysis. Each sample was analyzed to a depth of 4 μm, or the full thickness of the film, whichever comes first (i.e. the 0.7 μm film was analyzed to a depth of 0.7 μm). Boron quantification was based on EAG Laboratories' standard diamond film on silicon.
2.3. BDD surface functionalization
A biofunctionalization procedure reported by A. Rogien et al. was used to link anti-S1 antibodies to the surface of BDD [21]. BDD wafers were grown on a conductive silicon substrate and laser cut into 10 mm × 10 mm pieces prior to functionalization. The BDD pieces were solvent cleaned via ultrasonication first in acetone, then in isopropanol. To hydrogen (H) terminate the BDD surface, the samples were loaded into a MWPA-CVD reactor and reacted with hydrogen at 10 Torr, 200 sccm gas flow, and 1200 W power for 10 min. The samples were once again solvent cleaned using an ultrasonic bath of acetone, then isopropanol prior to converting the surface H groups to hydroxyl (OH) groups. OH group surface termination was accomplished by irradiating the samples with an excimer lamp at 172 nm for 1 h. Surface amination was performed by reacting the OH groups with an amino silane compound. The samples were submerged in a 30% (3-aminopropyl)trimethoxysilane (APTMS, 97%, Sigma-Aldrich) solution in methanol for 1 h at room temperature, resulting in accessible amine (NH2) groups on the BDD surface. After this, and after every subsequent step, the samples were washed three times with 0.01 M phosphate-buffered saline (PBS, pH = 7.4, Sigma-Aldrich) for 1 min on a gentle shaker (250 rpm). Unless otherwise noted, the concentration and pH of the PBS used in this work were 0.01 M and 7.4, respectively. The samples were placed in a 24-well, cell-culture plate and immersed in 400 μL of 4 mg/mL biotin (≥99%, Sigma-Aldrich), 20 mg/mL 1-ethyl-3-(3-dimethylaminopropyl)carbodiimide hydrochloride (EDC, ThermoFisher Scientific), and 30 mg/mL N-hydroxysuccinimide (NHS, 98%, Sigma-Aldrich) in PBS for 2 h at room temperature to biotinylate the surface. If necessary, 1–4 drops of ammonium hydroxide solution (Honeywell) were added to increase solubility of the biotinylation solution. Afterward, the samples were immersed in 60 μL of 4 mg/mL streptavidin (Fisher Scientific) dissolved in PBS for 1 h at room temperature. For the antibody attachment, the samples were incubated overnight at 4 °C in 400 μL of 4 μg/mL biotinylated SARS-CoV-2 (2019-nCoV) Spike S1 Antibody, Rabbit Mab (Sino Biological) in PBS. The standard procedure provided by the EZ-Link™ Micro Sulfo-NHS-Biotinylation Kit (ThermoFisher Scientific) was followed for the biotinylation of the antibody. Functionalization was independently confirmed using a combination of techniques, including AFM and XPS as described above. The sensors were fabricated on a weekly basis and stored in PBS at 4 °C when not in use. All electrochemical measurements were performed during the same week that the sensors were fabricated.
2.4. Electrochemical S1 subunit detection
All electrochemical measurements described herein were conducted at room temperature and in air. Functionalized 10 × 10 mm2 BDD samples were placed on the base of an electrochemical clamp cell, and a copper plate was clamped to the conductive silicon substrate to make the electrical connection to the potentiostat (CH Instruments, Inc.) through the working electrode lead. The active working electrode area was 3 mm in diameter (7.07 × 10⁻² cm2 active surface area). An electrolyte solution comprised of 1 mM potassium ferricyanide(III) (K3Fe(CN)6, 99%, Sigma-Aldrich) in PBS was added to the cell. A graphite rod and platinum wire were used as the counter and pseudo-reference electrodes, respectively. The potential of the FeIII/II couple, E1/2, where
| (1) |
was measured using cyclic voltammetry (CV) scans between 0.8 V and −0.8 V vs Pt. Controlled potential electrolysis (CPE) was used to perform a potential hold at E1/2 for 60 s to establish steady-state conditions. EIS spectra were recorded using an E1/2 perturbation voltage, 10 mV AC signal amplitude and 100 kHz to 1 Hz frequency range, 14 frequencies per decade.
EIS detection of the spike protein was accomplished by measuring an increase in the Rct value due to binding of the S1 subunit to the functionalized BDD surface. Here, the sensor surface was incubated in 200 μL of a 1 fg/mL solution of SARS-CoV-2 (2019-nCoV) Spike S1-His Recombinant Protein (S1, HPLC-verified, Sino Biological) in PBS for 5 min. After incubation, the surface was washed 3 times with PBS and the EIS spectrum was measured using the procedure described above. An identical protocol was followed for specificity testing with Influenza B [B/Brisbane/60/2008] Hemagglutinin protein (HA1 Subunit, His Tag, Sino Biological).
2.5. Detection in complex media
A modified electrochemical detection procedure was used to measure binding of the S1 subunit in complex media. This was due to a large increase in non-specific binding interactions when incubating the BDD surface with a more complex sample medium. M199 cell culture media (Sigma Aldrich) was used as a model complex matrix. This media was chosen because it is used by a local research laboratory to store real human SARS-CoV-2 samples, and it is anticipated that the BDD electrodes described here will be tested with these samples during future sensor development. To conduct these measurements, 1 μL aliquots of the S1 subunit suspended in cell culture medium were added directly to a 2 mL volume of 1 mM K3Fe(CN)6/PBS electrolyte. EIS spectra were recorded before and after sample addition using an E1/2 perturbation voltage, 10 mV AC signal amplitude and 100 kHz to 1 Hz frequency range. A 30 second incubation time was found to be sufficient for these experiments. Unlike the experiments described in the previous section for detection in PBS, a potential hold at E1/2 was found to not be necessary for these measurements.
3. Results and discussion
3.1. Selection of the antigen/antibody
SARS-CoV-2 contains four structural proteins that can be used as a target antigen in biosensors: the spike (S), envelope (E), membrane (M), and nucleocapsid (N) proteins [28]. The S protein of SARS-CoV-2 is a homotrimeric fusion protein located on the viral surface and is comprised of two subunits, S1 and S2 [29]. Since the S protein is responsible for the recognition and binding of the host cell receptor, it has been shown to be the most specific and suitable target antigen [29]. However, the S1 subunit is more specific to SARS-CoV-2, as the S2 subunit is more conserved between HCoVs and consequently plays a role in the cross-reactivity seen in assays that use the whole spike as the target antigen [30]. For this reason, monoclonal Anti-SARS-CoV-2 S1 antibodies were used to target the S1 subunit specifically in our sensor platform.
3.2. Material characterization
Fig. 1 shows the Raman spectra of all three BDD samples. Based on the position and intensity of the peak at 500 cm−1, it can be estimated that the 3.6 μm and 0.7 μm films have similar boron concentrations, while the 8.0 μm film has lower boron doping [31], [32], [33]. This is also evident by the higher peak intensity at 1332 cm−1 for the 8.0 μm film, which corresponds to the presence of diamond (sp3-bonded carbon) [31], [32], [33]. This was confirmed with SIMS analysis of all three films, where average boron concentrations of 3.25 × 1020 cm−3, 1.36 × 1021 cm−3 and 1.26 × 1021 cm−3 were measured for the 8.0 μm, 3.6 μm and 0.7 μm films, respectively (Table 1 ). The SIMS depth profiles of each BDD film are shown in Fig. S1. The average boron concentration values reported in Table 1 are based on the flat portion of the depth profile. The EIS spectrum of each of the samples was also measured using a 3-electrode cell with PBS electrolyte, and the impedance values at 1 kHz are listed in Table 1. Like the boron concentration, the 3.6 μm and 0.7 μm films have similar impedance values, while the impedance of the 8.0 μm film was slightly higher. Higher boron doping concentrations result in increased film conductivity [27], [34], [35], so the lower impedance values for the 3.6 μm and 0.7 μm films compared to the 8.0 μm film were expected.
Fig. 1.
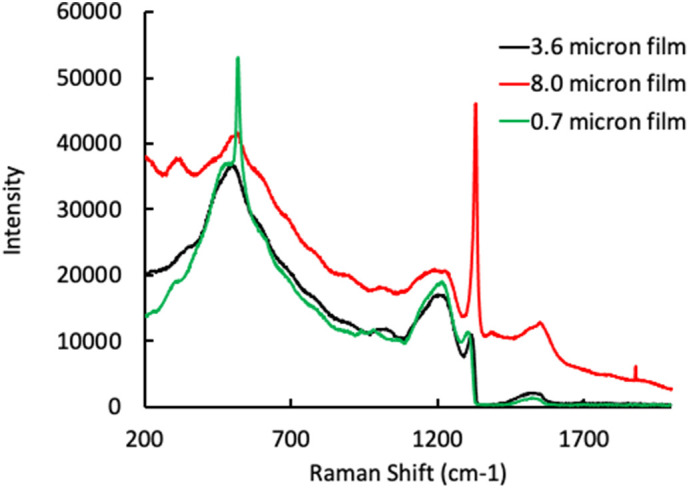
Raman spectra of the 3.6 μm film (black), 8.0 μm film (red) and 0.7 μm film (green). The peak at 520 cm−1 for the 0.7 μm film corresponds to the silicon substrate, which is visible due to the much lower film thickness of that sample. (For interpretation of the references to color in this figure legend, the reader is referred to the web version of this article.)
Table 1.
Summary of material properties for all three samples.
| Film thickness (μm) | Average [B]a (atoms/cm−3) | Average grain size (nm) | Sqb (nm) | Zc at 1 kHz (Ω) |
|---|---|---|---|---|
| 3.6 | 1.36 × 10²¹ | 891 | 91 | 427 |
| 8.0 | 3.25 × 10²⁰ | 1132 | 172 | 464 |
| 0.7 | 1.26 × 10²¹ | 463 | 49 | 435 |
Boron concentration.
As-grown surface roughness.
Impedance.
The samples were also characterized using AFM measurements. Fig. 2 shows the AFM images of each sample before and after surface functionalization. Aerial scans revealed a root mean square surface roughness (Sq) of 91 nm, 172 nm and 49 nm for the 3.6 μm, 8.0 μm, and 0.7 μm films, respectively. Average grain sizes were also determined from analysis of the AFM images, which were 891 nm for the 3.6 μm film, 1132 nm for the 8.0 μm film and 463 nm for the 0.7 μm film. After functionalization, the presence of an organic layer on the surface is evident in the AFM images, suggesting successful biofunctionalization. BDD film functionalization also slightly increased the surface roughness of all three films, with Sq values of 108 nm, 177 nm and 55 nm for the 3.6 μm film, the 8.0 μm film and the 0.7 μm film, respectively. Furthermore, XPS analysis of the films revealed the presence of nitrogen on the surface after functionalization, indicating successful antibody attachment (Fig. S2 and Table S1). A summary of the boron doping concentration, average grain size, and surface roughness for each of the samples is in Table 1.
Fig. 2.

Representative AFM images of the samples before (left) and after (right) surface functionalization with SARS-CoV-2 (2019-nCoV) Spike S1 Antibody, Rabbit Mab, where A1 and A2 correspond to the 3.6 μm film, B1 and B2 correspond to the 8.0 μm film, and C1 and C2 correspond to the 0.7 μm film.
Both the boron doping concentration and grain size may play a role in the performance of the BDD films as electrochemical sensors. It has been shown that the boron concentration effects the surface loading density of DNA strands on BDD [25]. Švorc et al. showed that the density of electrografted 4-nitrophenyl groups on BDD increased as the boron doping level increased, which was attributed to an increase in specific conductivity. This may not apply to our surfaces since the functionalization was carried out chemically instead of electrochemically; however, there is some evidence suggesting that higher boron doping leads to increased surface oxygen groups [36]. This could lead to higher antibody loading densities for samples with higher boron doping, since the functionalization chemistry is dependent on the conversion of surface OH groups to NH2 groups to covalently bind the biotin-streptavidin linker complex. Since the 3.6 μm film had approximately 4.2 times the boron doping concentration of the 8.0 μm film, it is expected that functionalization of the former will result in a higher antibody loading density than the latter.
In regards to grain size, Rogien et al. demonstrated that larger diamond crystal sizes resulted in higher antibody loading densities [21]. This was attributed to a preference of binding sites for sp3-hybridized carbon, which is more prevalent in the diamond crystallites than in the grain boundaries, which are comprised primarily of sp2 groups. Smaller grains give rise to more grain boundaries, and therefore a higher sp2 content, and lower antibody attachment. In this case, the 3.6 μm film had a smaller average grain size than the 8.0 μm film, which could result in a lower biofunctionalization yield for the former. However, the electrochemical detection data shown below (Fig. 4) clearly shows that the 3.6 μm film had greater sensitivity for S1 subunit binding than the 8.0 μm film. This indicates the increased boron doping concentration of the 3.6 μm film, as described above, plays a significant role in determining the antibody loading density. Comparing the 3.6 μm and 0.7 μm films, which have similar boron doping concentrations, it is expected that a higher antibody loading density would be achieved for the former, which has a larger grain size. A comparison of the EIS spectra for all three films after functionalization is shown in Fig. S3. Here, the charge transfer resistance (Rct) values serve as an indication of relative antibody loading density, where greater Rct values indicate a higher antibody surface coverage. Based on the EIS spectra and Rct values of the functionalized BDD films, the antibody loading density is in the following order: 3.6 μm film > 8.0 μm film > 0.7 μm film.
Fig. 4.
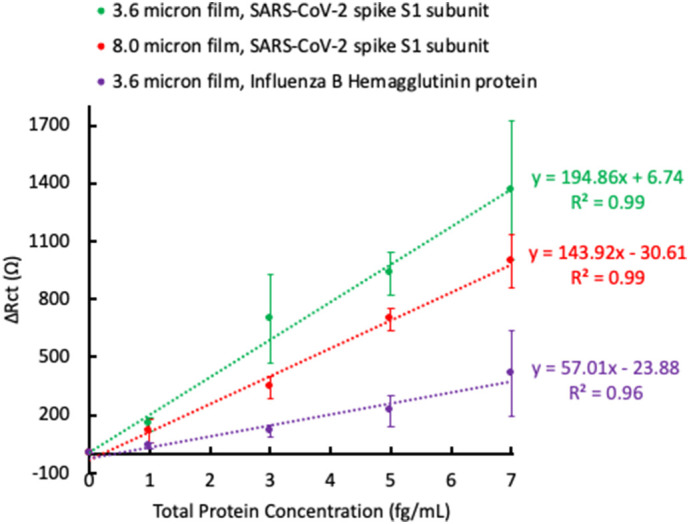
Baseline subtracted ΔRct values as a function of SARS-CoV-2 spike S1 subunit concentration for the 3.6 μm film (green) and the 8.0 μm film (red). The 3.6 μm film was also tested for binding of Influenza B Hemagglutinin protein (purple). The plotted data represents n = 2 total sensors ± 1 standard deviation. Lines are best linear fit. (For interpretation of the references to color in this figure legend, the reader is referred to the web version of this article.)
3.3. Electrochemical detection of S1 subunit
Electrochemical detection of the S1 subunit was accomplished using EIS. Fig. 3 shows the EIS spectrum for the 3.6 μm film before and after incubation with increasing concentrations of the S1 subunit. The EIS spectra were modeled to an equivalent circuit (Fig. 3, inset), and it was found that binding of the S1 subunit resulted in an increase in charge transfer resistance (Rct). The values of the other equivalent circuit elements (solution resistance Rsoln, constant phase element Q, and Warburg impedance W) were relatively constant at each protein concentration (Table S2). The same trend was observed for all samples tested (EIS spectra not shown). In Fig. 4 , the change in Rct (ΔRct) as a function of protein concentration is plotted for the 3.6 μm and 8.0 μm films tested against the S1 subunit (green and red lines, respectively), and for the 3.6 μm film tested against an Influenza B Hemagglutinin protein (purple line). The ΔRct values are normalized to the individual sensor's response in the K3Fe(CN)6/PBS electrolyte solution (i.e., the Rct value of the functionalized sensor with no added protein is subtracted from each data point) for clarity due to the fluctuation in initial Rct values between the samples.
Fig. 3.
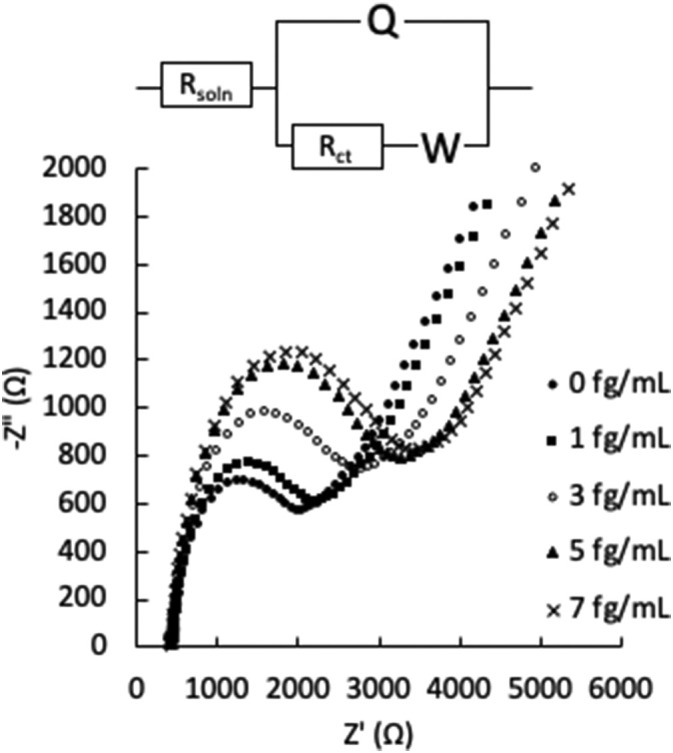
Representative EIS spectra (Nyquist plots) of the 3.6 μm film after exposure to increasing concentrations of SARS-CoV-2 spike S1 subunit in PBS. The cell conditions were as follows: 3 mm diameter BDD film working electrode, graphite rod counter electrode, Pt wire reference electrode, and 1 mM K3Fe(CN)6/PBS electrolyte solution. Inset: equivalent circuit model for data fitting.
From Fig. 4, there is a clear difference in the sensitivity to S1 subunit binding between the 3.6 μm and 8.0 μm films, with a higher slope for the best linear fit line in the plot of ΔRct vs protein concentration for the 3.6 μm film indicating increased sensitivity. This may be due to a better antibody loading density on the 3.6 μm film, arising from its higher boron doping concentration compared to the 8.0 μm film. A higher antibody loading density allows for more S1 subunit binding at each concentration tested, and therefore a stronger signal. The 3.6 μm film was also tested for specificity by incubating the surface with an Influenza B Hemagglutinin protein. Though ΔRct does increase with increasing Influenza B Hemagglutinin protein concentration, the overall change is less than when incubated with the S1 subunit, indicating a lower sensitivity to Influenza B Hemagglutinin protein. Non-specific binding interactions are to be expected due to electrostatic interactions between biological material and the BDD surface [37], and should always be taken into account when discussing impedimetric sensors due to the potential to produce false positive results. In this work, non-specific interactions could be somewhat mitigated by reducing the BDD film roughness, as described in later sections. Table 2 summarizes the sensitivity and limit of detection (LOD) for the detection of the S1 subunit for each of the films. The sensitivity is derived from the slope of the linear best fit line, and the LOD is determined from this slope (S) and the standard deviation in the ΔRct values (Sy) using the following equation [22]:
| (2) |
Table 2.
Figures of merit for SARS-CoV-2 spike S1 subunit detection by the 3.6 μm and 8.0 μm films.
Slope of the linear best fit line.
Limit of detection; calculated from the slope of the linear best fit line and the standard deviation in ΔRct (Eq. (2)).
3.4. Electrochemical detection of S1 subunit in complex media
For the next experiments, the effect of BDD material characteristics on detection response was further explored by growing a new BDD wafer using a shorter growth time, which resulted in a thinner film with smaller average grain size (the 0.7 μm film). The boron doping density of the 0.7 μm film was approximately the same as the 3.6 μm film, which was expected because an identical boron concentration in the feed gas was used to grow the thinner film. The 0.7 μm film had smaller grains and a lower surface roughness than the 3.6 μm film, with Sq values of 49 nm and 91 nm, respectively (refer to Table 1 for a summary of the material properties for all three samples). Here, by maintaining the boron doping concentration, the effect of film thickness, grain size and surface roughness on sensor performance was investigated.
After proof of concept was established for EIS detection of the S1 subunit in PBS on functionalized BDD surfaces, detection in complex media was explored. This is important for SARS-CoV-2 sensing applications, as there is interest in detecting the virus in solutions such as wastewater, saliva and other biological matrices. A commercially available cell culture medium containing l-glutamine, phenol red, and various salts was used as a representative complex matrix for these experiments. This is the chosen storage media for real human SARS-CoV-2 samples by a local research laboratory. Initial experiments utilized the same approach described above, in which increasing concentrations of the S1 subunit suspended in cell culture media were incubated directly on the functionalized BDD surface, followed by a wash step, then EIS measurement in the electrolyte solution. This process was found to be not suitable for complex matrices, as significant non-specific binding of the cell culture media prevented a discernable response from S1 subunit binding. Therefore, we explored a new detection method to limit the effects of non-specific binding of the sample matrix.
We overcame the interference from non-specific binding by adding small aliquots (1 μL) of the S1 subunit suspended in cell culture media directly to 2 mL of the electrolyte mixture and recording the EIS spectrum before and after addition of the sample. By doing this, the sample matrix was significantly diluted, and effects of non-specific binding were limited. An increase in the ΔRct value due to S1 subunit binding could now be distinguished from binding of the cell culture media components. Fig. 5 shows the ΔRct as a function of S1 subunit concentration in cell culture media for the 3.6 μm and 0.7 μm films, where the concentration of 0 fg/mL corresponds to incubation with the cell culture medium only. In these experiments, a wider concentration range was tested, and it was found that a 30 s incubation time was sufficient to observe S1 binding. The wider concentration range was due to the anticipation that the LOD would increase when testing a more complex sample matrix (LOD values are reported in Table 3 ). Influenza B Hemagglutinin protein was also tested using this method, and less of an increase in ΔRct was once again observed.
Fig. 5.
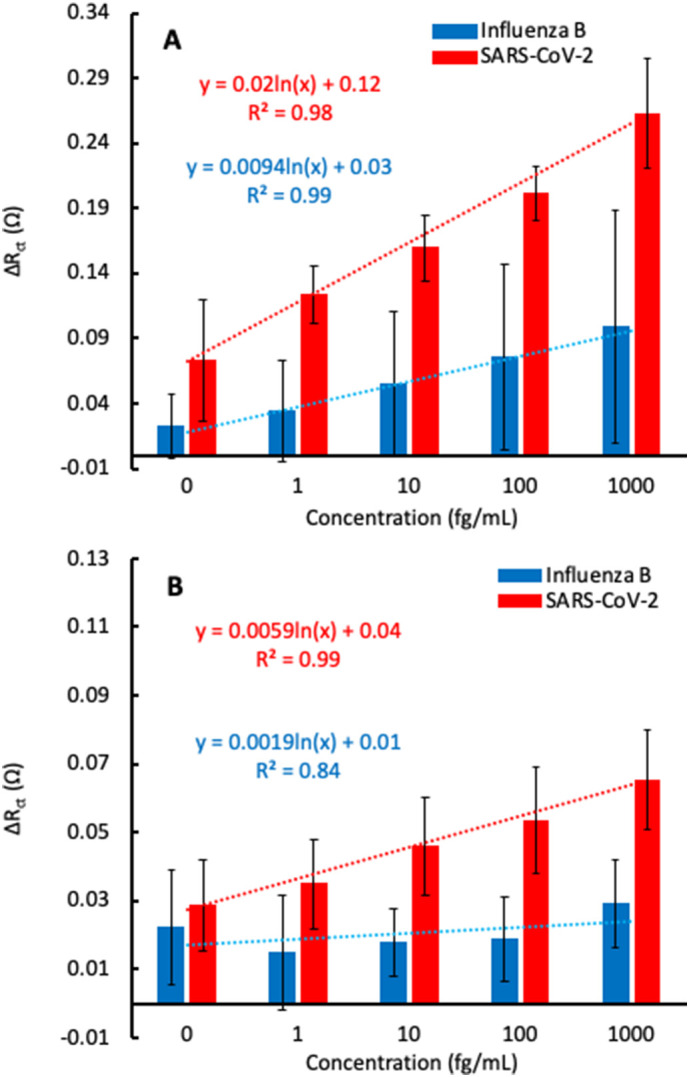
Normalized ΔRctvs antigen concentration for sensors comprised of 3.6 μm (A) and 0.7 μm (B) BDD films tested against SARS-CoV-2 spike S1 subunit (red) and Influenza B Hemagglutinin protein (blue). The plotted data represents n = 3 total sensors ± 1 standard deviation. Lines are linear best fit to guide the eye. Equations are logarithmic best fit with 0 fg/mL excluded. (For interpretation of the references to color in this figure legend, the reader is referred to the web version of this article.)
Table 3.
Figures of merit for SARS-CoV-2 spike S1 subunit detection by the 3.6 μm and 0.7 μm films.
Slope of the logarithmic best fit line.
Limit of detection; calculated from the slope of the logarithmic best fit line and the standard deviation in ΔRct (Eq. (2)).
Fig. 5B shows the increase in ΔRct as a function of S1 subunit concentration for the 0.7 μm film using the revised detection method for samples suspended in cell culture media. Compared to the 3.6 μm film, the overall response to S1 subunit binding was lower, indicating a reduced antibody loading density. This agrees with the findings of Rogien et al., since the grain size of the 0.7 μm film is lower than that of the 3.6 μm film [21]. However, the 0.7 μm film had a relatively flat response when testing with Influenza B Hemagglutinin protein. This is in contrast to the 3.6 μm film, which showed an increase in ΔRct with respect to Influenza B Hemagglutinin protein concentration. The decreased response to Influenza B Hemagglutinin protein for the 0.7 μm film indicates fewer non-specific interactions compared to the 3.6 μm film. This may be due to a lower surface roughness, and therefore lower surface area, for the 0.7 μm film. With a lower surface area, there are fewer sites for proteins or other biomolecules to non-specifically bind to the surface. It is encouraging to see that the increase in ΔRct from the Influenza B Hemagglutinin protein is independent of the protein concentration in the 0.7 μm film because this indicates that it is possible to discern between the response from specific and non-specific binding, even at a high concentration of interferents and lower concentration of S1 subunit. In fact, during these experiments, samples of the S1 subunit were added to the cell after the sensors were exposed to Influenza B Hemagglutinin protein, and the ΔRct began to increase again (Fig. S5). However, since there is still a substantial increase in the ΔRct after incubation with a non-specific species, which significantly overlaps with the signal for the analyte of interest, this must be taken into account in a real-world sensing scenario. In a commercial sensor, a threshold ΔRct value could be established, where responses above this value could be considered true positives. For example, in Fig. 5B, the maximum response after incubation with Influenza B Hemagglutinin protein was ΔRct = 0.042. With this as the threshold value, S1 subunit concentrations of at least 10 fg/mL in a test sample could result in a true positive.
Though lower in sensitivity, the data on the 0.7 μm film suggest that greater specificity can be achieved by using BDD films with lower roughness. The sensitivity and LOD figures of merit for detection of the S1 subunit in cell culture media by the 3.6 μm and 0.7 μm films are compared in Table 3. It should be noted that these are the theoretical values calculated from the slope of the logarithmic best fit line and the standard deviation in ΔRct. In a real-world scenario, the actual LOD may be higher due to the need to establish a threshold ΔRct value to account for non-specific interactions, as described above.
It should be noted that significant surface stabilization time was required when performing EIS measurements this way, which may account for the large standard deviation values calculated for these data sets. Anywhere from 30 min to 120 min was required to establish a baseline Rct value before adding the sample. This is likely due to the use of K3Fe(CN)6 in the electrolyte mixture as a redox probe. Though used extensively in impedimetric sensor work, K3Fe(CN)6 has reported stability issues, such as etching of gold surfaces and reactions with surface bound species [8], [38], [39]. Rct stability issues did not arise in our initial measurements, in which sample incubation and EIS measurement occurred in separate steps, likely because the surface was not continuously exposed to the electrolyte mixture. To avoid Rct stability issues, the use of alternative redox probes, such as hexaammineruthenium(III) chloride (Ru(NH3)6Cl3) [8], [38], [39], [40], ferrocenemethanol (FcMeOH) [8], [40] and ferrocenecarboxylic acid (FcCOOH) [8] may be a viable solution.
4. Conclusion
An impedimetric biosensor for SARS-CoV-2 spike protein S1 subunit was developed using chemical modification of BDD to tether anti-S1 antibodies to the surface. Proof of concept was established by conducting EIS measurements and observing increases in the ΔRct value upon binding of the S1 subunit suspended in PBS. Analogous experiments with Influenza B Hemagglutinin protein showed significant non-specific binding interactions, though the sensitivity was lower compared to that for the S1 subunit. An enhanced response for S1 binding was measured for the sample with a higher boron doping concentration, suggesting that the material characteristics impact the antibody loading density. A second set of experiments demonstrated the ability of the sensing platform to detect the S1 subunit in a complex medium. Here, small aliquots of S1 subunit suspended in a cell culture medium were added directly to the electrolyte mixture for EIS measurements. Using this method, the response to S1 subunit binding was measured after a 30-second incubation period, though a significant surface stabilization time was required due to possible reactions with the K3Fe(CN)6 electrolyte mixture, an issue that remains to be addressed. Non-specific binding was once again observed when the surface was exposed to Influenza B Hemagglutinin protein, however the use of a BDD film with lower surface roughness appeared to improve specificity, likely due to a decreased surface area. This work demonstrates that rapid detection of the S1 subunit in complex media using EIS is possible, and that sensor performance may be improved through BDD material design. These results prove promising for the future development of tunable impedimetric sensors for the detection of SARS-CoV-2 and other emerging pathogens in complex media.
Abbreviations
- BDD
boron doped diamond
- EIS
electrochemical impedance spectroscopy
- SARS-CoV-2
severe acute respiratory syndrome coronavirus 2
- COVID-19
coronavirus disease 2019
- SARS-CoV
severe acute respiratory syndrome associated coronavirus
- MERS-CoV
Middle East respiratory syndrome coronavirus
- CoVs
coronaviruses
- RT-PCR
real time-polymerase chain reaction
- MWPA-CVD
microwave plasma assisted chemical vapor deposition
- HF-CVD
hot filament chemical vapor deposition
- SIMS
secondary ion mass spectrometry
- AFM
atomic force microscopy
- SEM
scanning electron microscopy
- XPS
X-ray photoelectron spectroscopy
- Rct
charge transfer resistance
- LOD
limit of detection
Funding sources
This work was supported in part by the Parsons Corporation.
CRediT authorship contribution statement
Suzanne Witt: Conceptualization, methodology, validation, investigation, resources, writing – original draft, writing – review & editing, visualization, supervision, project administration, funding acquisition
Alexis Rogien: Investigation, data curation, writing- original draft, writing – review & editing
Diana Werner: Investigation, resources, data curation, writing- original draft
James Siegenthaler: Methodology, validation, formal analysis, investigation, data curation, writing – review & editing
Raymond Lesiyon: Investigation, data curation
Noelle Kurien: Investigation, data curation
Robert Rechenberg: Investigation, data curation, writing – review & editing
Nina Baule: Investigation, data curation, writing – review & editing, visualization
Aaron Hardy: Investigation
Michael Becker: Writing – review & editing, project administration, funding acquisition.
Declaration of competing interest
The authors declare that they have no known competing financial interests or personal relationships that could have appeared to influence the work reported in this paper.
Acknowledgment
We would like to thank Parsons Corporation for their generous funding of this work, as well as helpful technical discussions throughout. Special thanks goes to Jeffrey Hale from Parsons Corporation for initiating discussions of the project with Fraunhofer and coordinating efforts between both organizations. We would also like to thank Per Askeland and Edward Drown for their help collecting XPS and Raman data, respectively. XPS and Raman data were collected at the Michigan State University Composite Materials and Structures Center.
Footnotes
A PDF file containing SIMS, XPS, EIS and SEM data for all three BDD films, and additional EIS detection data for the 0.7 μm film. Supplementary data to this article can be found online at https://doi.org/10.1016/j.diamond.2021.108542.
Appendix A. Supplementary data
Supplementary material
References
- 1.WHO . “Novel Coronavirus (2019-nCoV) Situation Report - 1”, WHO Bull., no. JANUARY. 2020. pp. 1–7.https://www.who.int/emergencies/diseases/novel-coronavirus-2019/situation-reports [Google Scholar]
- 2.Chen Y., Liu Q., Guo D. Emerging coronaviruses: genome structure, replication, and pathogenesis. J. Med. Virol. 2020;92(4):418–423. doi: 10.1002/jmv.25681. [DOI] [PMC free article] [PubMed] [Google Scholar]
- 3.Bhat T.A., Kalathil S.G., Bogner P.N., Blount B.C., Goniewicz M.L., Thanavala Y.M., Zou L., Ruan F., Huang M., Liang L., Huang H., Hong Z., Yu J., Kang M., Song Y., Xia J., Guo Q., Song T., He J., Yen H.-L., Peiris M., Wu J. SARS-CoV-2 viral load in upper respiratory specimens of infected patients. N. Engl. J. Med. 2020;382(12):1177–1179. doi: 10.1056/NEJMc2001737. [DOI] [PMC free article] [PubMed] [Google Scholar]
- 4.Wang D., Hu B., Hu C., Zhu F., Liu X., Zhang J., Wang B., Xiang H., Cheng Z., Xiong Y., Zhao Y., Li Y., Wang X., Peng Z. Clinical characteristics of 138 hospitalized patients with 2019 novel coronavirus-infected pneumonia in Wuhan, China. JAMA - J. Am. Med. Assoc. 2020;323(11):1061–1069. doi: 10.1001/jama.2020.1585. [DOI] [PMC free article] [PubMed] [Google Scholar]
- 5.Aziz B. Testing times. Nurs. Manag. (Harrow) 2007;14(6):8–9. doi: 10.7748/nm.14.6.8.s10. [DOI] [PubMed] [Google Scholar]
- 6.Guglielmi G. Fast Coronavirus Tests Are Coming. vol. 585. Nature; 2020. p. 496.https://www.nature.com/articles/d41586-020-02661-2 [DOI] [PubMed] [Google Scholar]
- 7.Merkoçi A., Li C.Z., Lechuga L.M., Ozcan A. COVID-19 biosensing technologies. Biosens. Bioelectron. 2021;178(October2020):113046. doi: 10.1016/j.bios.2021.113046. [DOI] [PMC free article] [PubMed] [Google Scholar]
- 8.Cesewski E., Johnson B.N. Electrochemical biosensors for pathogen detection. Biosens. Bioelectron. 2020;159(October 2019):112214. doi: 10.1016/j.bios.2020.112214. [DOI] [PMC free article] [PubMed] [Google Scholar]
- 9.Chaibun T., Puenpa J., Ngamdee T., Boonapatcharoen N., Athamanolap P., O’Mullane A.P., Vongpunsawad S., Poovorawan Y., Lee S.Y., Lertanantawong B. Rapid electrochemical detection of coronavirus SARS-CoV-2. Nat. Commun. 2021;12(1):1–10. doi: 10.1038/s41467-021-21121-7. [DOI] [PMC free article] [PubMed] [Google Scholar]
- 10.Mojsoska B., Larsen S., Olsen D.A., Madsen J.S., Brandslund I., Alatraktchi F.A. Rapid SARS-CoV-2 detection using electrochemical immunosensor. Sensors (Switzerland) 2021;21(2):1–11. doi: 10.3390/s21020390. [DOI] [PMC free article] [PubMed] [Google Scholar]
- 11.Rahmati Z., Roushani M., Hosseini H., Choobin H. Electrochemical immunosensor with Cu2O nanocube coating for detection of SARS-CoV-2 spike protein. Microchim. Acta. 2021;188(3) doi: 10.1007/s00604-021-04762-9. [DOI] [PMC free article] [PubMed] [Google Scholar]
- 12.Raziq A., Kidakova A., Boroznjak R., Reut J., Öpik A., Syritski V. Development of a portable MIP-based electrochemical sensor for detection of SARS-CoV-2 antigen. Biosens. Bioelectron. 2021;178(November2020) doi: 10.1016/j.bios.2021.113029. [DOI] [PMC free article] [PubMed] [Google Scholar]
- 13.Torrente-Rodríguez R.M., Lukas H., Tu J., Min J., Yang Y., Xu C., Rossiter H.B., Gao W. SARS-CoV-2 RapidPlex: a graphene-based multiplexed telemedicine platform for rapid and low-cost COVID-19 diagnosis and monitoring. Matter. 2020;3(6):1981–1998. doi: 10.1016/j.matt.2020.09.027. [DOI] [PMC free article] [PubMed] [Google Scholar]
- 14.Vadlamani B.S., Uppal T., Verma S.C., Misra M. Functionalized TiO2 Nanotube-based Electrochemical Biosensor for Rapid Detection of SARS-CoV-2. medRxiv; 2020. pp. 1–10. [DOI] [PMC free article] [PubMed] [Google Scholar]
- 15.Vezza V.J., Butterworth A., Lasserre P., Blair E.O., MacDonald A., Hannah S., Rinaldi C., Hoskisson P.A., Ward A.C., Longmuir A., Setford S., Murphy M.E., Corrigan D.K. ChemRxiv; 2020. An Uncomplicated Electrochemical Sensor Combining a Perfluorocarbon SAM and ACE2 as the Bio-recognition Element to Sensitively and Specifically Detect SARS-CoV-2 in Complex Samples. [DOI] [Google Scholar]
- 16.Baluchová S., Danhel A., Dejmková H., Ostatná V., Fojta M., Schwarzová-Pecková K. Recent progress in the applications of boron doped diamond electrodes in electroanalysis of organic compounds and biomolecules – a review. Anal. Chim. Acta. 2019;1077:30–66. doi: 10.1016/j.aca.2019.05.041. [DOI] [PubMed] [Google Scholar]
- 17.Zhou Y., Zhi J. The application of boron-doped diamond electrodes in amperometric biosensors. Talanta. 2009;79(5):1189–1196. doi: 10.1016/j.talanta.2009.05.026. [DOI] [PubMed] [Google Scholar]
- 18.Rusinek C.A., Guo Y., Rechenberg R., Becker M.F., Purcell E., Verber M., McKinney C., Li W. All-diamond microfiber electrodes for neurochemical analysis. J. Electrochem. Soc. 2018;165(12):G3087–G3092. doi: 10.1149/2.0141812jes. [DOI] [Google Scholar]
- 19.Ensch M., Maldonado V.Y., Swain G.M., Rechenberg R., Becker M.F., Schuelke T., Rusinek C.A. Isatin detection using a boron-doped diamond 3-in-1 sensing platform. Anal. Chem. 2018;90(3):1951–1958. doi: 10.1021/acs.analchem.7b04045. [DOI] [PubMed] [Google Scholar]
- 20.Brillas E., Martinez-Huitle C.A. John Wiley & Sons Inc; Hoboken, NJ, USA: 2011. Synthetic Diamond Films: Preparation, Electrochemistry, Characterization, and Applications. [Google Scholar]
- 21.Rogien A., Jansen G., Zimmermann T. Surface termination, crystal size, and bonding-site density effects on diamond biosensing surfaces. Diam. Relat. Mater. 2020:107843. doi: 10.1016/j.diamond.2020.107843. [DOI] [Google Scholar]
- 22.Nidzworski D., Siuzdak K., Niedzialkowski P., Bogdanowicz R., Sobaszek M., Ryl J., Weiher P., Sawczak M., Wnuk E., Goddard W.A., Jaramillo-Botero A., Ossowski T. A rapid-response ultrasensitive biosensor for influenza virus detection using antibody modified boron-doped diamond. Sci. Rep. 2017;7(1):1–10. doi: 10.1038/s41598-017-15806-7. [DOI] [PMC free article] [PubMed] [Google Scholar]
- 23.Siuzdak K., Niedzialkowski P., Sobaszek M., Lega T., Sawczak M., Czaczyk E., Dziabowska K., Ossowski T., Nidzworski D., Bogdanowicz R. Biomolecular influenza virus detection based on the electrochemical impedance spectroscopy using the nanocrystalline boron-doped diamond electrodes with covalently bound antibodies. Sensors Actuators B Chem. 2019;280(October 2018):263–271. doi: 10.1016/j.snb.2018.10.005. [DOI] [Google Scholar]
- 24.Preechaworapun A., Ivandini T.A., Suzuki A., Fujishima A., Chailapakul O., Einaga Y. Development of amperometric immunosensor using boron-doped diamond with poly(o-aminobenzoic acid) Anal. Chem. 2008;80(6):2077–2083. doi: 10.1021/ac702146u. [DOI] [PubMed] [Google Scholar]
- 25.Švorc L., Jambrec D., Vojs M., Barwe S., Clausmeyer J., Michniak P., Marton M., Schuhmann W. Doping level of boron-doped diamond electrodes controls the grafting density of functional groups for DNA assays. ACS Appl. Mater. Interfaces. 2015;7(34):18949–18956. doi: 10.1021/acsami.5b06394. [DOI] [PubMed] [Google Scholar]
- 26.Necas D., Klapetek P. Gwyddion: an open-source software for SPM data analysis. Cent. Eur. J. Phys. 2012;10(1):181–188. doi: 10.2478/s11534-011-0096-2. [DOI] [Google Scholar]
- 27.Ramamurti R., Becker M., Schuelke T., Grotjohn T., Reinhard D., Swain G., Asmussen J. Boron doped diamond deposited by microwave plasma-assisted CVD at low and high pressures. Diam. Relat. Mater. 2008;17(4–5):481–485. doi: 10.1016/j.diamond.2007.08.042. [DOI] [Google Scholar]
- 28.Naqvi A.A.T., Fatima K., Mohammad T., Fatima U., Singh I.K., Singh A., Atif S.M., Hariprasad G., Hasan G.M., Hassan M.I. Insights into SARS-CoV-2 genome, structure, evolution, pathogenesis and therapies: structural genomics approach. Biochim. Biophys. Acta Mol. basis Dis. 2020;1866(10) doi: 10.1016/j.bbadis.2020.165878. [DOI] [PMC free article] [PubMed] [Google Scholar]
- 29.Sternberg A., Naujokat C. Structural features of coronavirus SARS-CoV-2 spike protein: targets for vaccination. Life Sci. 2020;257(July) doi: 10.1016/j.lfs.2020.118056. [DOI] [PMC free article] [PubMed] [Google Scholar]
- 30.Okba N., Muller M., Li W., Wang C., GeurtsvanKessel C., Corman V., Lamers M., Sikkema R., de Bruin E., Chandler F., Yazdanpanah Y., Le Hingrat Q., Descamps D., Houhou-Fidouh N., Reusken C., Bosch B.-J., Drosten C., Koopmans M., Haagmans B. SARS-CoV-2 specific antibody responses in COVID-19 patients. Emerg. Infect. Dis. 2020 doi: 10.1101/2020.03.18.20038059. [DOI] [PMC free article] [PubMed] [Google Scholar]
- 31.May P.W., Ludlow W.J., Hannaway M., Heard P.J., Smith J.A., Rosser K.N. Raman and conductivity studies of boron-doped microcrystalline diamond, facetted nanocrystalline diamond and cauliflower diamond films. Diam. Relat. Mater. 2008;17(2):105–117. doi: 10.1016/j.diamond.2007.11.005. [DOI] [Google Scholar]
- 32.Kumar D., Chandran M., Rao M.S.Ramachandra. Effect of boron doping on first-order Raman scattering in superconducting boron doped diamond films. Appl. Phys. Lett. 2017;110(19) doi: 10.1063/1.4982591. [DOI] [Google Scholar]
- 33.De Oliveira J.R., Berengue O.M., Moro J., Ferreira N.G., Chiquito A.J., Baldan M.R. Transport properties of polycrystalline boron doped diamond. Appl. Surf. Sci. 2014;311:5–8. doi: 10.1016/j.apsusc.2014.04.161. [DOI] [Google Scholar]
- 34.Bogdanowicz R., Fabianska A., Golunski L., Sobaszek M., Gnyba M., Ryl J., Darowicki K., Ossowski T., Janssens S.D., Haenen K., Siedlecka E.M. Influence of the boron doping level on the electrochemical oxidation of the azo dyes at Si/BDD thin film electrodes. Diam. Relat. Mater. 2013;39:82–88. doi: 10.1016/j.diamond.2013.08.004. [DOI] [Google Scholar]
- 35.Garcia-Segura S., Vieira Dos Santos E., Martínez-Huitle C.A. Role of sp3/sp2 ratio on the electrocatalytic properties of boron-doped diamond electrodes: a mini review. Electrochem. Commun. 2015;59:52–55. doi: 10.1016/j.elecom.2015.07.002. [DOI] [Google Scholar]
- 36.Azevedo A.F., Baldan M.R., Ferreira N.G. Doping level influence on chemical surface of diamond electrodes. J. Phys. Chem. Solids. 2013;74(4):599–604. doi: 10.1016/j.jpcs.2012.12.013. [DOI] [Google Scholar]
- 37.Contreras-Naranjo J.E., Aguilar O. Suppressing non-specific binding of proteins onto electrode surfaces in the development of electrochemical immunosensors. Biosensors. 2019;9(1) doi: 10.3390/bios9010015. [DOI] [PMC free article] [PubMed] [Google Scholar]
- 38.Schrattenecker J.D., Heer R., Melnik E., Maier T., Fafilek G., Hainberger R. Hexaammineruthenium (II)/(III) as alternative redox-probe to hexacyanoferrat (II)/(III) for stable impedimetric biosensing with gold electrodes. Biosens. Bioelectron. 2019;127(December 2018):25–30. doi: 10.1016/j.bios.2018.12.007. [DOI] [PubMed] [Google Scholar]
- 39.Mccreery R.L., Mccreery R.L. Advanced carbon electrode materials for molecular Electrochemistry. 2646 Chem.Rev. 2008;108(June):2646–2687. doi: 10.1021/cr068076m. [DOI] [PubMed] [Google Scholar]
- 40.Krittayavathananon A., Sawangphruk M. Impedimetric sensor of ss-HSDNA/Reduced graphene oxide aerogel electrode toward aflatoxin B1 detection: effects of redox mediator charges and hydrodynamic diffusion. Anal. Chem. 2017;89(24):13283–13289. doi: 10.1021/acs.analchem.7b03329. [DOI] [PubMed] [Google Scholar]
Associated Data
This section collects any data citations, data availability statements, or supplementary materials included in this article.
Supplementary Materials
Supplementary material