

SUMMARY
We performed genomic and transcriptomic sequencing of 133 combined hepatocellular and intrahepatic cholangiocarcinoma (cHCC-ICC) cases, including separate, combined, and mixed subtypes. Integrative comparison of cHCC-ICC with hepatocellular carcinoma and intrahepatic cholangiocarcinoma revealed that combined and mixed type cHCC-ICCs are distinct subtypes with different clinical and molecular features. Integrating laser microdissection, cancer cell fraction analysis, and single nucleus sequencing, we revealed both mono- and multiclonal origins in the separate type cHCC-ICCs, whereas combined and mixed type cHCC-ICCs were all monoclonal origin. Notably, cHCC-ICCs showed significantly higher expression of Nestin, suggesting Nestin may serve as a biomarker for diagnosing cHCC-ICC. Our results provide important biological and clinical insights into cHCC-ICC.
INTRODUCTION
Hepatocellular carcinoma (HCC) and intrahepatic cholangiocarcinoma (ICC) are two major types of primary liver cancer (PLC), accounting for approximately 80% and 15%, respectively (Bray et al., 2018; Marquardt et al., 2015). Combined hepatocellular and intrahepatic cholangiocarcinoma (cHCC-ICC) is a rare type of PLC showing both hepatocellular and biliary epithelial differentiation and has an incidence that varies between 0.4% and 14.2% (Connell et al., 2016; Maximin et al., 2014). cHCC-ICC is reported to have more aggressive behavior and poorer prognosis in comparison with HCC and ICC. However, there is no specialized treatment for cHCC-ICC. Surgical resection is still the primary curative choice, but its benefits are negligible (Lee et al., 2011). Thus, molecular characterization of cHCC-ICC is urgently needed to aid biomarker discovery, facilitate accurate diagnosis, and expedite the development of specialized therapies.
To date, large-scale genomic studies of HCC (Fujimoto et al., 2016; TCGA, 2017), ICC (Farshidfar et al., 2017; Nakamura et al., 2015), and cholangiocarcinoma (CCA) (Jusakul et al., 2017) have revealed a panoramic view of hepatobiliary cancer. In contrast, few genomic studies have assessed cHCC-ICC, reporting a few exome-sequenced cases (Moeini et al., 2017; Wang et al., 2018). Therefore, the genomic landscape of cHCC-ICC remains to be explored. Furthermore, the bilinear differentiation of cHCC-ICC brings forth diagnostic and therapeutic complexities. Exploring the clonal origins of HCC and ICC components in the same cHCC-ICC patient is critically important for understanding the carcinogenesis of cHCC-ICC. In this study, we aim to portray an integrated genomic landscape of cHCC-ICC cases with well-documented clinicopathologic information and provide a rationale for the development of an accurate diagnostic approach and specialized treatment for cHCC-ICC patients.
RESULTS
Patient Cohort
Here, we conducted a pan-Asia multi-center study involving eight hospitals and performed a large-scale integrative analysis of 133 cHCC-ICC cases, including whole exome sequencing (WES), whole genome sequencing (WGS), RNA sequencing (RNA-seq), and single nucleus sequencing (SNS) (Figures 1A, S1A, and S1B; Table S1). According to Allen and Lisa’s criteria, we divided cHCC-ICC cases into three subtypes (Allen and Lisa, 1949) (Figures 1B and 1C; Table S1). Cases with physically separate and histologically different lesions were defined as the separate type (denoted as Sep_ID). Cases with clearly defined areas of HCC and ICC components in the same tumor were defined as the combined type (denoted as Com_ID). Cases with intimately mixed components of HCC and ICC in the same tumor without clear boundaries were defined as the mixed type (denoted as Mix_ID). Among 121 classified cases, 6 cases were separate type, 56 were combined type, and 59 were mixed type. Different handling strategies were designed for each subtype. Multiple tumor samples were collected by laser capture microdissection (LCM) in 3 separate type and 41 combined type cHCC-ICC cases (Figures 1B and S1A; Table S1). Etiologically, 100 cases were hepatitis B virus (HBV) positive, 7 were hepatitis C virus (HCV) positive, 1 was double-positive, and 25 were double-negative (Table S1). Collectively, apart from normal controls, we performed WES on 173 tumor samples from 121 cases, WGS on 41 tumor samples from 37 cases, and RNA-seq on 97 tumor samples from 77 cases (Table S1). The average depth of WES was 108× for tumors and 101× for normal samples (Table S1).
Figure 1. Research Strategy.
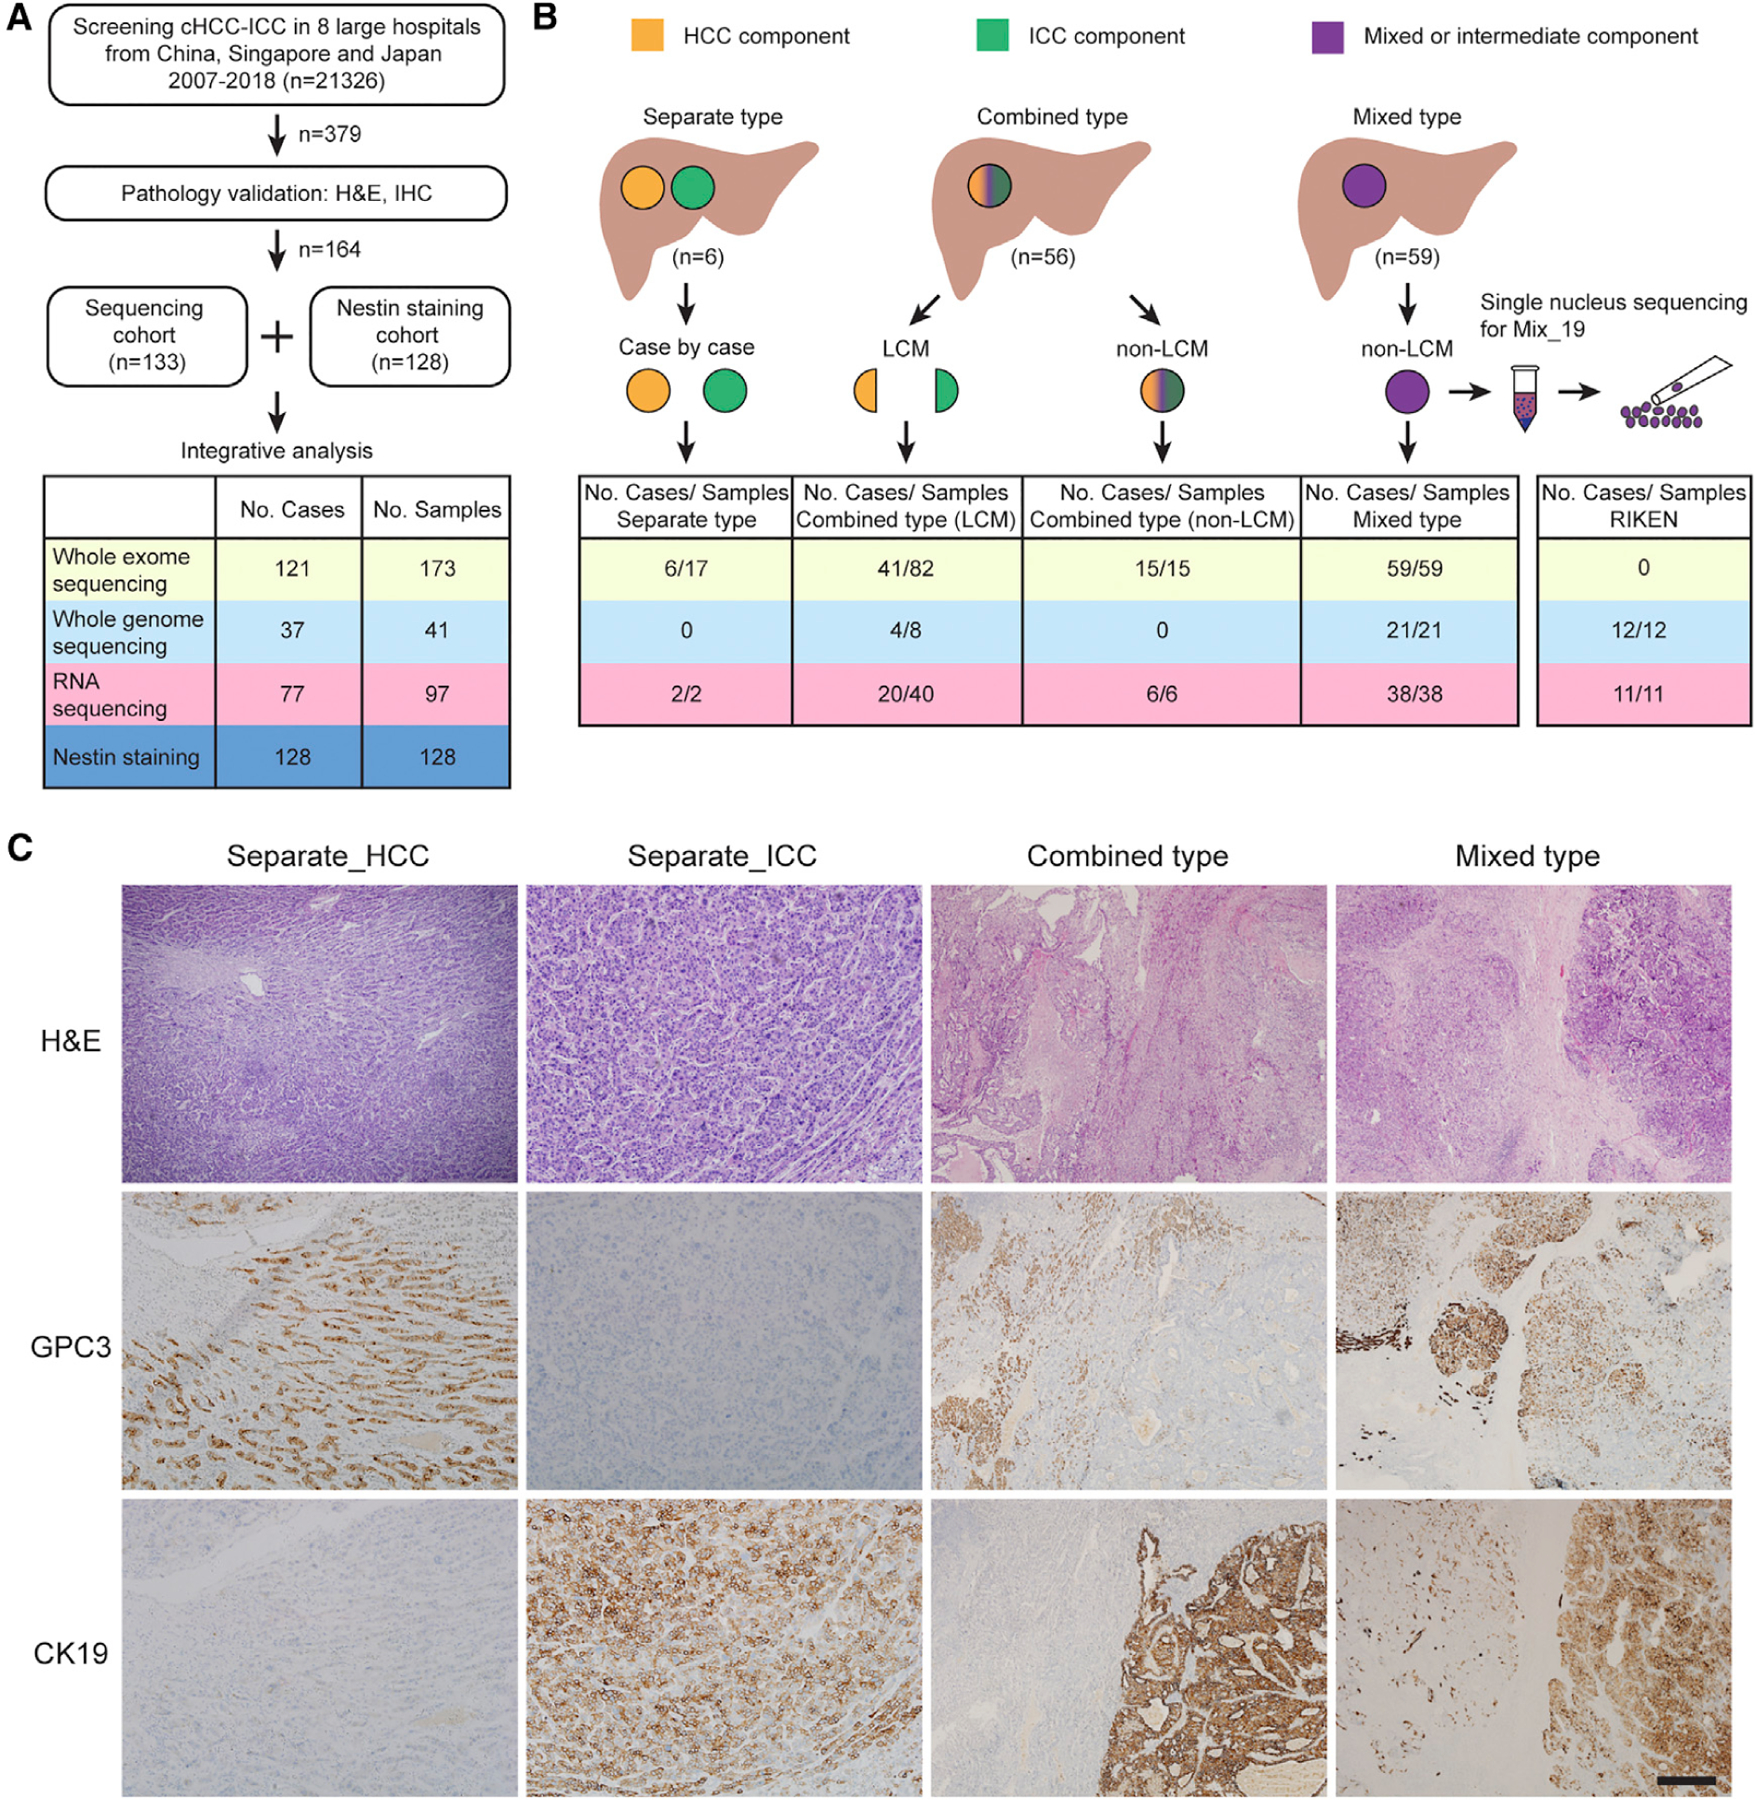
(A) Brief description of case screening.
(B) Research strategy. Orange, green, and purple denote HCC, ICC, and intermediate or mixed components, respectively. Six separate type cases were handled case by case. In certain lesions of Sep_03, Sep_05, and Sep_06, well-characterized regions of HCC and ICC components were isolated by LCM. LCM was also performed to isolate HCC and ICC components from 41 of 56 combined type cases (denoted as LCM). Tumors from other 14 combined type and 59 mixed type cases were isolated as a whole (denoted as non-LCM). Single nucleus sequencing was performed on one mixed type case (Mix_19).
(C) Pathologic graphs for three subtypes. H&E, hematoxylin and eosin; CK19, cytokeratin 19; GPC3, glypican-3. Scale bar, 400 μm.
Recurrently Mutated Genes
Comprehensive statistical analysis identified TP53, AXIN1, RB1, PTEN, ARID2, and BRD7 as significantly mutated genes (q < 0.1; Table S2). Together with 8 other recurrent genes reported in HCC and ICC, a total of 14 genes were selected as potential drivers for cHCC-ICC (Figure 2A). We also identified multiple recurrently mutated genes rarely reported in PLC (Table S2). ADGRV1, MUC2, NEB, DST, and HMCN1 are associated with extracellular matrix (ECM) formation or cell-cell adhesion, while SYNE1/2, SYCP2, and FRY may contribute to the maintenance of nuclear and chromosomal integrity. Several signaling pathways were frequently altered in cHCC-ICC. KMT2D, IDH1, BAP1, and EZH2, associated with histone modification and DNA methylation, were mutated in 35.6% of cases. SWI/SNF chromatin remodeling complex genes, including ARID1A, ARID2, PBRM1, and BRD7, were mutated in 19.5% of cases, suggesting that epigenetic dysregulation is an important feature of cHCC-ICC. KEAP1, IDH1, APOB, and ALB, were mutated in 21.2% of cases, suggesting that cellular energetics disruption may also be a feature of cHCC-ICC.
Figure 2. Genomic Landscape.

(A) Potential driver events. Mixed type, combined type, and separate type span from left to right, followed by RIKEN cases. The top graph shows mutation numbers followed by gender and hepatitis infection. For patients with two or more samples, gender and hepatitis information are shown only once at the first sample and left blank for other samples. The histology of each component from these cases is denoted below the track of hepatitis. For every two columns of LCM-treated combined type cases, the HCC component is displayed on the left with the ICC component on the right. Six separate type cases are ordered by case number from left to right (from Sep_01 to Sep_06). The middle graph details mutations of potential driver genes. Mutation types are indicated. Mutational frequency is shown on the left. Comparison of the mutational frequency of each gene between combined and mixed type is shown by the bar chart on the right. ***p < 0.001, Fisher’ exact test. The bottom graph shows genes targeted by focal CNAs: dark red for amplifications, light red for gains, dark blue for deletions, and light blue for losses. Altered frequency of each gene is shown on the left with the bar chart shown on the right.
(B) Summary of the mutations identified in cHCC-ICC by WGS.
(C) Circos plot for HBV integration events in cHCC-ICC. Two recurrent HBV-integrated genes, KMT2B and TERT, are highlighted.
(D) De novo mutational signatures identified in cHCC-ICC.
See also Figures S2 and S3 and Table S2.
Noncoding Alterations, HBV Integrations, Fusion Events, and Copy Number Alterations
Many noncoding alterations and structural variations (SVs) were identified (Figure 2B; Table S2). TERT promoter mutations, all are the hotspot C228T, were identified in 22.9% of cases. NEAT1, identified in 29.7% of cases, was the most frequently mutated intergenic noncoding RNA gene. With the RNA-seq data, we looked into fusion genes and found PTMS-AP1G1 (11.7%) as the most recurrent fusion gene (Table S2). FGFR-related fusion events were identified in 6.5% of cases. Next, we identified HBV integrations across the whole genome in cHCC-ICC by integrating WGS, WES, and RNA-seq data (Table S2). TERT and KMT2B were the two most recurrent integrated genes (Figure 2C). In addition, HBV integrations were identified in the promoter regions of LANCL2, PLG, MDGA2, and PTPRM, which showed higher expression than that of those nonintegrated cases (Figure S2A). Copy number alterations (CNAs) were estimated from both WES and WGS data (Figures 2A and S2B). We found 22 focally amplified regions, including 1q21, 8q22–24, and 13q34, and 40 focally deleted regions, including 1p36, 9q34, and 19p13 (Figure S2C; Table S2). Many well-known cancer driver genes are targeted by those focal CNAs. We identified focal amplifications and gains in MYC (73%), MET (24%), CCNE1 (24%), CDK6 (20%), and TERT (19%), as well as deletions and losses in TP53 (46%), CDKN2A (37%), RB1 (26%), and AXIN1 (25%) (Figure 2A).
To explore the potential genetic alterations that distinguish three cHCC-ICC subtypes, we compared their genomic features. The separate type cases were excluded due to small sample size. No significant difference of mutational loads was identified between combined type and mixed type (p = 0.89) (Table S2). Mutational frequencies of TP53 (44% vs 53%; p = 0.35) and TERT promoter (25% vs 23%; p = 0.83) were comparable in the combined type and mixed type. Interestingly, AXIN1 mutations were significantly enriched in mixed type cHCC-ICCs (2% in Com versus 20% in Mix; p < 0.001) (Figure 2A; Table S2). Consistently, the expression level of AXIN1 in combined type cHCC-ICCs was significantly higher than that in mixed type cHCC-ICCs (p < 0.05, Student’s t test). No other significant differences were found.
Mutational Signatures
SigProfiler identified three mutational signatures, signatures A, B, and C, that are highly similar to the reported COSMIC signatures: 22, 5, and 24, respectively (Figures 2D, S3A, and S3B; Table S2) (Alexandrov et al., 2013). The prevalence of signature 22 (63.5%) suggests that aristolochic acid may be an important risk factor for Chinese cHCC-ICC patients (Figures S3C and S3D). Signature 22 was also frequently identified in Chinese HCC (Ng et al., 2017) and ICC (Zou et al., 2014) cases. Signature 24 was found in 38.8% of cases, suggesting that aflatoxin B1 (AFB1) was also a risk factor for cHCC-ICC. TP53 R249S mutation, a marker of AFB1-induced HBV+ HCC, accounted for 25.8% of TP53 mutations in our cohort (Figure S3E). All patients with this mutation were HBV positive and had signature 24. Thus, as is the case for HCC, HBV infection and AFB1 exposure may synergize to elevate the risk of cHCC-ICC. Collectively, these results suggest that mutagenic forces that drive carcinogenesis are similar across different types of PLC in the Chinese population.
Genomic Comparison
To compare the mutational landscape of cHCC-ICC with those of HCC and ICC, we selected the largest reported HCC and ICC exome cohorts as references (HCC, TCGA [The Cancer Genome Atlas] cohort, 363 cases, TCGA, 2017; ICC, ICGC [International Cancer Genome Consortium] cohort, 179 cases, Nakamura et al., 2015; Wardell et al., 2018). The average number of somatic mutations in cHCC-ICCs was 111, lower than that in HCCs and ICCs (p < 0.0001, p < 0.01, Student’s t test). Considering differences in etiologic factors across different geographical and ethnic groups, we expanded this comparison to the largest published Chinese cohorts (HCC, 88 cases, Kan et al., 2013; ICC, 102 cases, Zou et al., 2014) to offset the potential bias caused by enrichment of HBV infection (Figure 3).
Figure 3. Mutational Comparison of PLC.

Each gene box includes five percentages representing the mutational frequencies of activation and inactivation in cHCC-ICC, HCC, and ICC. Data layout is detailed in the legend. Only mutations are included. Genes are grouped by signaling pathways. Interaction between genes are indicated. Seven hallmarks of cancer are listed in the central box to indicate the potential influence of alterations among genes and signaling pathways (Hanahan and Weinberg, 2011).
See also Table S3.
After a thorough review of published genomic data for PLC, 55 genes enriched in at least one of the five PLC cohorts were selected for comparison (Figure 3; Table S3). TP53 was the only gene mutated in more than 20% of cases across five cohorts, consistent with the well-recognized role of TP53 in hepatocarcinogenesis (Zucman-Rossi et al., 2015). Notably, TP53 was mutated in 49.2% of cHCC-ICCs, significantly higher than that in HCCs and ICCs (versus TCGA-HCC, 31%, p < 0.001; versus ICGC-ICC, 22%, p < 0.0001; versus China-HCC, 35%, p < 0.05; versus China-ICC, 38%, p = 0.207; Fisher’s exact test was applied throughout the text unless otherwise noted). This finding suggests that although TP53 mutation is an important driver for both HCC and ICC, it may play a more vital role in cHCC-ICC. TERT promoter was mutated in 22.9% of cHCC-ICCs, much lower than that in TCGA-HCCs (46%, p < 0.001). TERT promoter mutation was absent in ICGC-ICCs. This intermediate percentage of TERT promoter mutations in cHCC-ICC needs to be validated in large Chinese HCC and ICC cohorts.
Next, we looked into other genes enriched in at least one type of PLC. CTNNB1, ALB, and AXIN1 were frequently mutated in HCCs, whereas KRAS, BAP1, ARID1A, SYNE1, and IDH1/2 were frequently mutated in ICCs. Strikingly, cHCC-ICCs harbored a much lower CTNNB1 mutation frequency (6%) compared with that of HCCs (versus TCGA-HCC, 27%, p < 0.0001; versus China-HCC, 16%, p < 0.05). In addition, cHCC-ICCs harbored a much lower KRAS mutation frequency (0%) compared with that of ICCs (versus ICGC-ICC, 19%, p < 0.0001; versus China-ICC, 17%, p < 0.0001). Given that the mutational frequencies of CTNNB1 in HCC and KRAS in ICC were comparable between Chinese and non-Chinese cohorts, the scarcity of CTNNB1 and KRAS mutations was a unique feature of cHCC-ICC that was not biased by etiologic or ethnic factors. In addition, cHCC-ICC showed high mutational frequencies of RPS6KA3, KMT2D, SYCP2, FRY, HYDIN, ADGRV1, GIGYF2, PXDNL, and CCDC168, many of which are associated with ECM and cell adhesion (Figure 3; Table S3).
Transcriptomic Comparison
To compare the transcriptomic profiles of cHCC-ICC with that of HCC and ICC, we selected the largest reported PLC RNA-seq cohort as a reference (Fujimoto et al., 2016). ICC data from the TCGA-CHOL cohort were added to expand the ICC category (Farshidfar et al., 2017). Expression profiling of 367 PLC samples (HCC, n = 213, ICC, n = 49, cHCC-ICC, n = 105) identified four distinct clusters, P1–P4, each of which was enriched with different clinical and molecular variables (Figure 4A; Table S4). Most HCC cases from the same Hoshida subclass were clustered together, suggesting that our PLC classification was robust (Hoshida et al., 2009). Cluster P1 (n = 103) was highly enriched with ICC cases, combined type cHCC-ICC cases, KRAS mutations, and IDH1 mutations, and depletion of TERT promoter mutations. The expression levels of biliary markers such as EPCAM, KRT19, and PRDM5 in P1 were significantly higher than those of other groups (Figure 4B). Consistent with the enrichment of KRAS mutations, the KRAS expression level of P1 was also significantly higher than that of the other groups. Cluster P2 (n = 99) was highly enriched with Hoshida-S2 HCC, mixed type cHCC-ICC, TP53 mutations and a higher level of serum α-fetoprotein (AFP). This result was consistent with the fact that Hoshida-S2 HCC is characterized by poor differentiation and a high level of serum AFP (Hoshida et al., 2009). In addition, hepatocyte markers GPC3 and APOE were also highly expressed in P2 (Figure 4B). Cluster P3 (n = 65) was highly enriched with Hoshida-S1 HCC, which is associated with transforming growth factor β pathway activation. The expression levels of TGFB1 and TGFB2 in P3 were higher than those in P1 and P2. Cluster P4 (n = 100) was highly enriched with Hoshida-S3 HCC and CTNNB1 mutations. The molecular features of P4 matched those of well-differentiated HCC, including higher expression levels of hepatocyte markers such as ALB and TBX3, and lower levels of biliary markers such as EPCAM, KRT19, and PRDM5 (Figure 4B). Survival analysis revealed that the prognoses of patients in P1 and P2 were poorer than those in P3 and P4 (p < 0.0001, log rank test) (Figure 4C). In addition, the E2F1 expression levels of P1 and P2 were much higher than those of P3 and P4, indicating that both P1 and P2 are characterized by a high level of proliferation. Taken together, these four PLC clusters clearly demonstrate a molecular panorama of PLC spanning from biliary differentiation (P1) to poorly differentiated states (P2), and to hepatic differentiation (P3, P4), suggesting that this clustering has potential clinical value for patient stratification.
Figure 4. Transcriptomic Analysis.
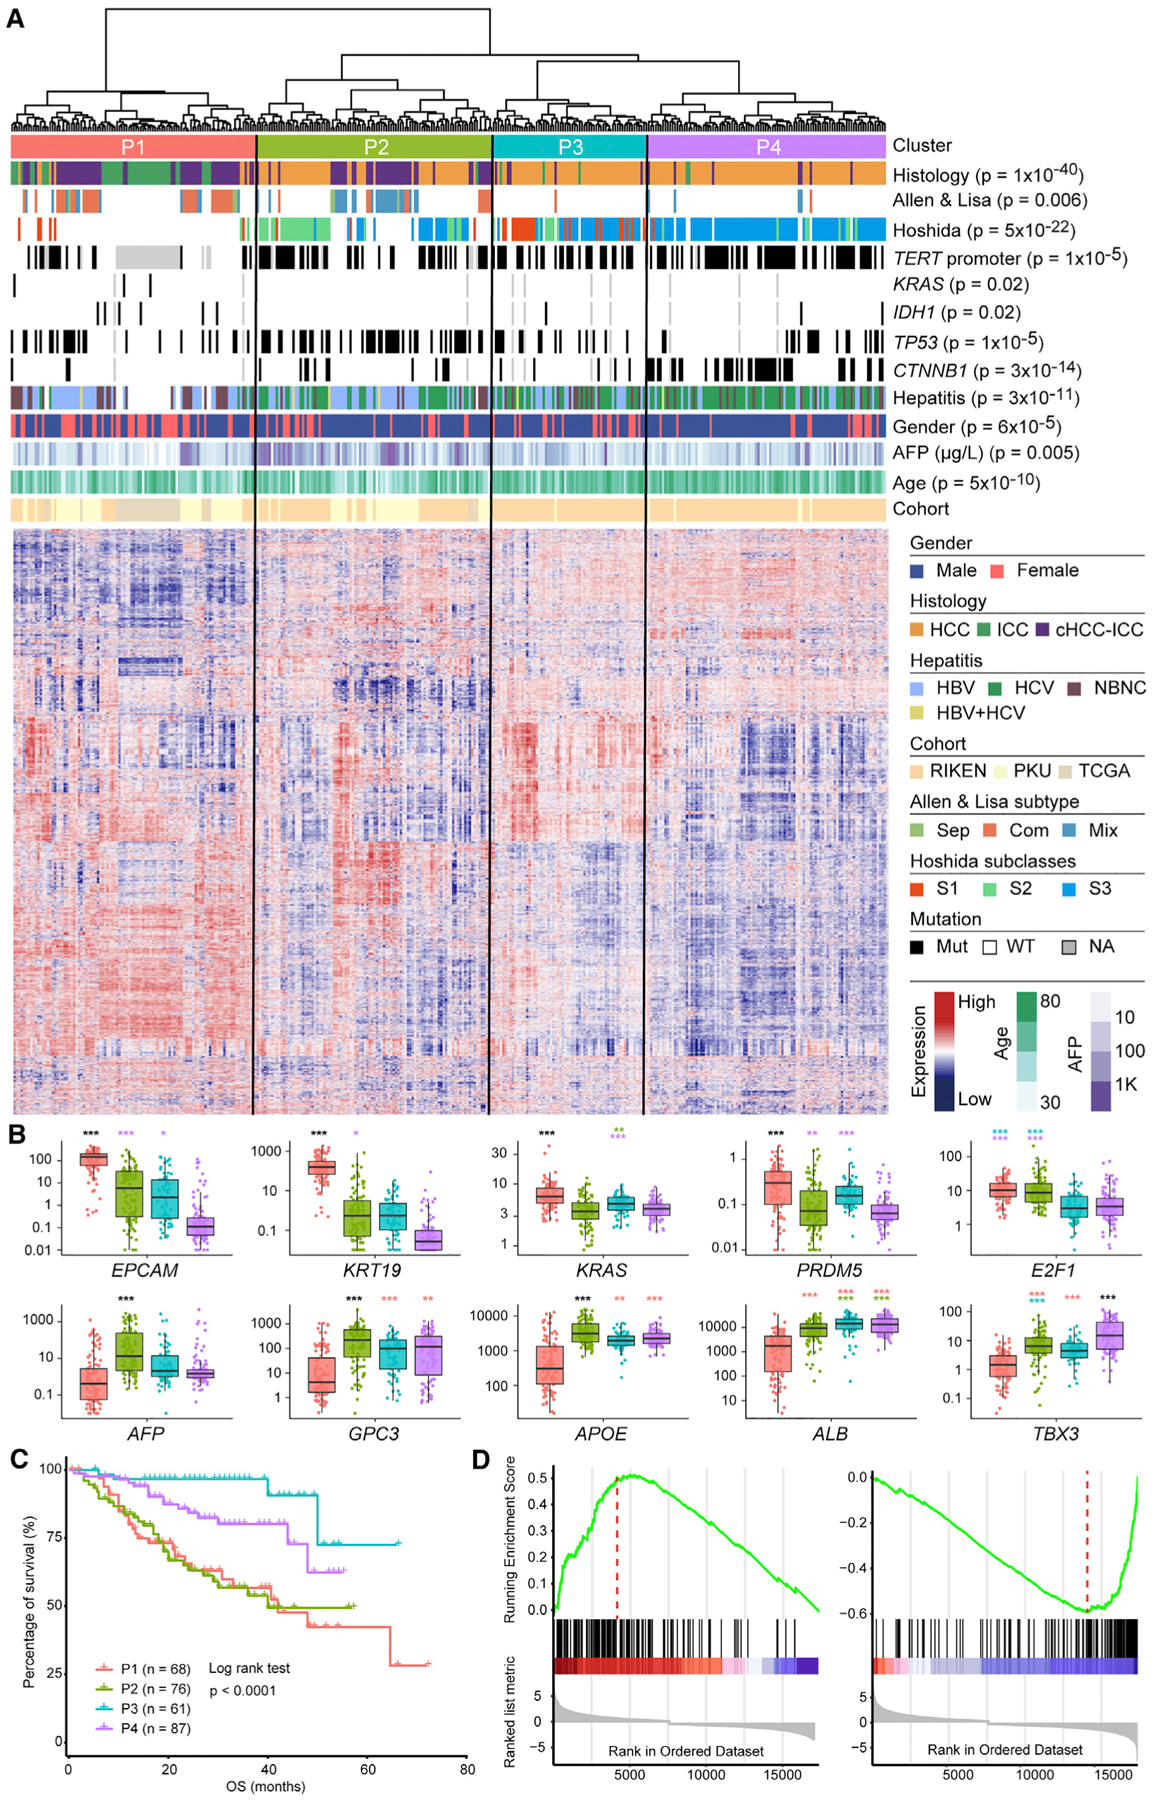
(A) Four PLC clusters, P1, P2, P3, and P4, identified by unsupervised clustering of gene expression. Clinical and molecular features are annotated above the heatmap with details shown in the legend to the right. p values indicate significant nonrandom distributions for each attribute.
(B) Comparison of expression levels for selected genes across four PLC clusters. The y axis indicates log10 fragments per kilobase of transcript per million mapped reads (FPKM) values. In the boxplots, lines in the box indicate the median; boxes indicate the first and third quartiles; whiskers extend 1.5 times the interquartile range; dots show all data values. Color codes for clusters are the same as the heatmap above. p values are indicated above each box in the boxplots. *p < 0.05, **p < 0.01, ***p < 0.001, Student’ t test. Different colors of p values indicate comparisons between different clusters. For example, the purple * above the green box indicates a comparison between P2 and P4. Black *** indicate that the comparisons of certain clusters with the other three clusters all have p values <0.001.
(C) Patient overall survival among four PLC clusters.
(D) GSEA analysis of differently expressed genes between cluster P1 and P2 showing the epithelial mesenchymal transition (left) and xenobiotic metabolism gene sets (right). The hallmark gene set from MSigDB was used.
See also Figures S4 and S5 and Table S4.
Combined and Mixed Type cHCC-ICC Are Distinct Subtypes
Interestingly, combined and mixed type cHCC-ICC were significantly enriched in P1 (p < 0.001) and P2 (p < 0.001), respectively (Figure 4A). Gene set enrichment analysis (GSEA) was performed to investigate differentially expressed gene pathways between P1 and P2 (Figures 4D and S4A; Table S4). Epithelial mesenchymal transition (EMT) is the most enriched gene set in P1, whereas xenobiotic metabolism and bile acid metabolism are the most enriched gene sets in P2. Upregulation of the EMT pathway in P1 suggests that combined type cHCC-ICCs may be associated with enhanced tumor invasion and metastasis. Hepatocytes play critical roles in xenobiotic metabolism and bile acid metabolism. Therefore, the enrichment of these gene sets in P2 implies that mixed type cHCC-ICCs possess more hepatic functions in comparison with combined type cHCC-ICCs. In addition, GSEA analysis with the C2 gene set from the MSigDB database showed that P1 was enriched with ICC-like features, such as Anderson-CCA-class2, whereas P2 was enriched with HCC-like features, such as the Chiang-proliferation-subclass of HCC (Figure S4A) (Andersen et al., 2012; Chiang et al., 2008). We also performed a comparison between cHCC-ICC in P1 and P2, as well as a comparison between combined type and mixed type cHCC-ICCs, and the results were highly consistent with the analysis described above. Taken together, these results suggest that combined type and mixed type cHCC-ICCs are distinct molecular subtypes; combined type cHCC-ICC is more similar to ICC, whereas mixed type cHCC-ICC is more similar to HCC. This observation implies that different therapies may be adopted for these two cHCC-ICC subtypes.
Interestingly, gene ontology (GO) analysis of differentially expressed genes between combined and mixed type cHCC-ICCs identified many pathways associated with the immune microenvironment, such as leukocyte migration, regulation of lymphocytes, and regulation of T cell activation (Figure S4B). Three immune clusters, named High, Medium, and Low, were identified based on unsupervised clustering of gene expression of selected immune markers, including well-known immune check-point genes CTLA4, PDCD1 (PD-1), and CD274 (PD-L1) (Figure S5). Interestingly, the High immune group is significantly enriched with PLC cluster P2 and mixed type cHCC-ICCs, while the Medium immune group is significantly enriched with PLC cluster P1 and combined type cHCC-ICC. These results suggest that the immune microenvironment may be another distinct feature between combined and mixed type cHCC-ICC, implying that they may respond differently to immune therapies.
Separate Type cHCC-ICC Showed Both Monoclonal and Multiclonal Origins
In our cohort, six cases had two physically separate lesions. Lesions from Sep_01, Sep_03, Sep_05, and Sep_06 shared 67%, 46%, 61%, and 46% of their mutations, respectively (Figure 5A), as well as many CNA events (Figure S6A). Therefore, physically separate and phenotypically distinct lesions from these cases displayed a monoclonal origin. Phylogenetic analysis revealed branched evolution (Figure 5B). Potential driver mutations such as TP53, CTNNB1, and RB1 were identified on the trunks, whereas mutations such as RASA1, FAT2, and PLCB1 were on the branches (Figure 5B). In contrast, lesions from Sep_02 and Sep_04 did not share a single mutation (Figure 5A). This finding showed that these lesions had independent carcinogenesis. Consistently, the CNA landscape of these lesions were distinct (Figure S6A). No significant difference was observed between the mutational spectra of paired lesions, suggesting similar mutagenic backgrounds (Figure 5C).
Figure 5. Separate Type and Mixed Type cHCC-ICCs.
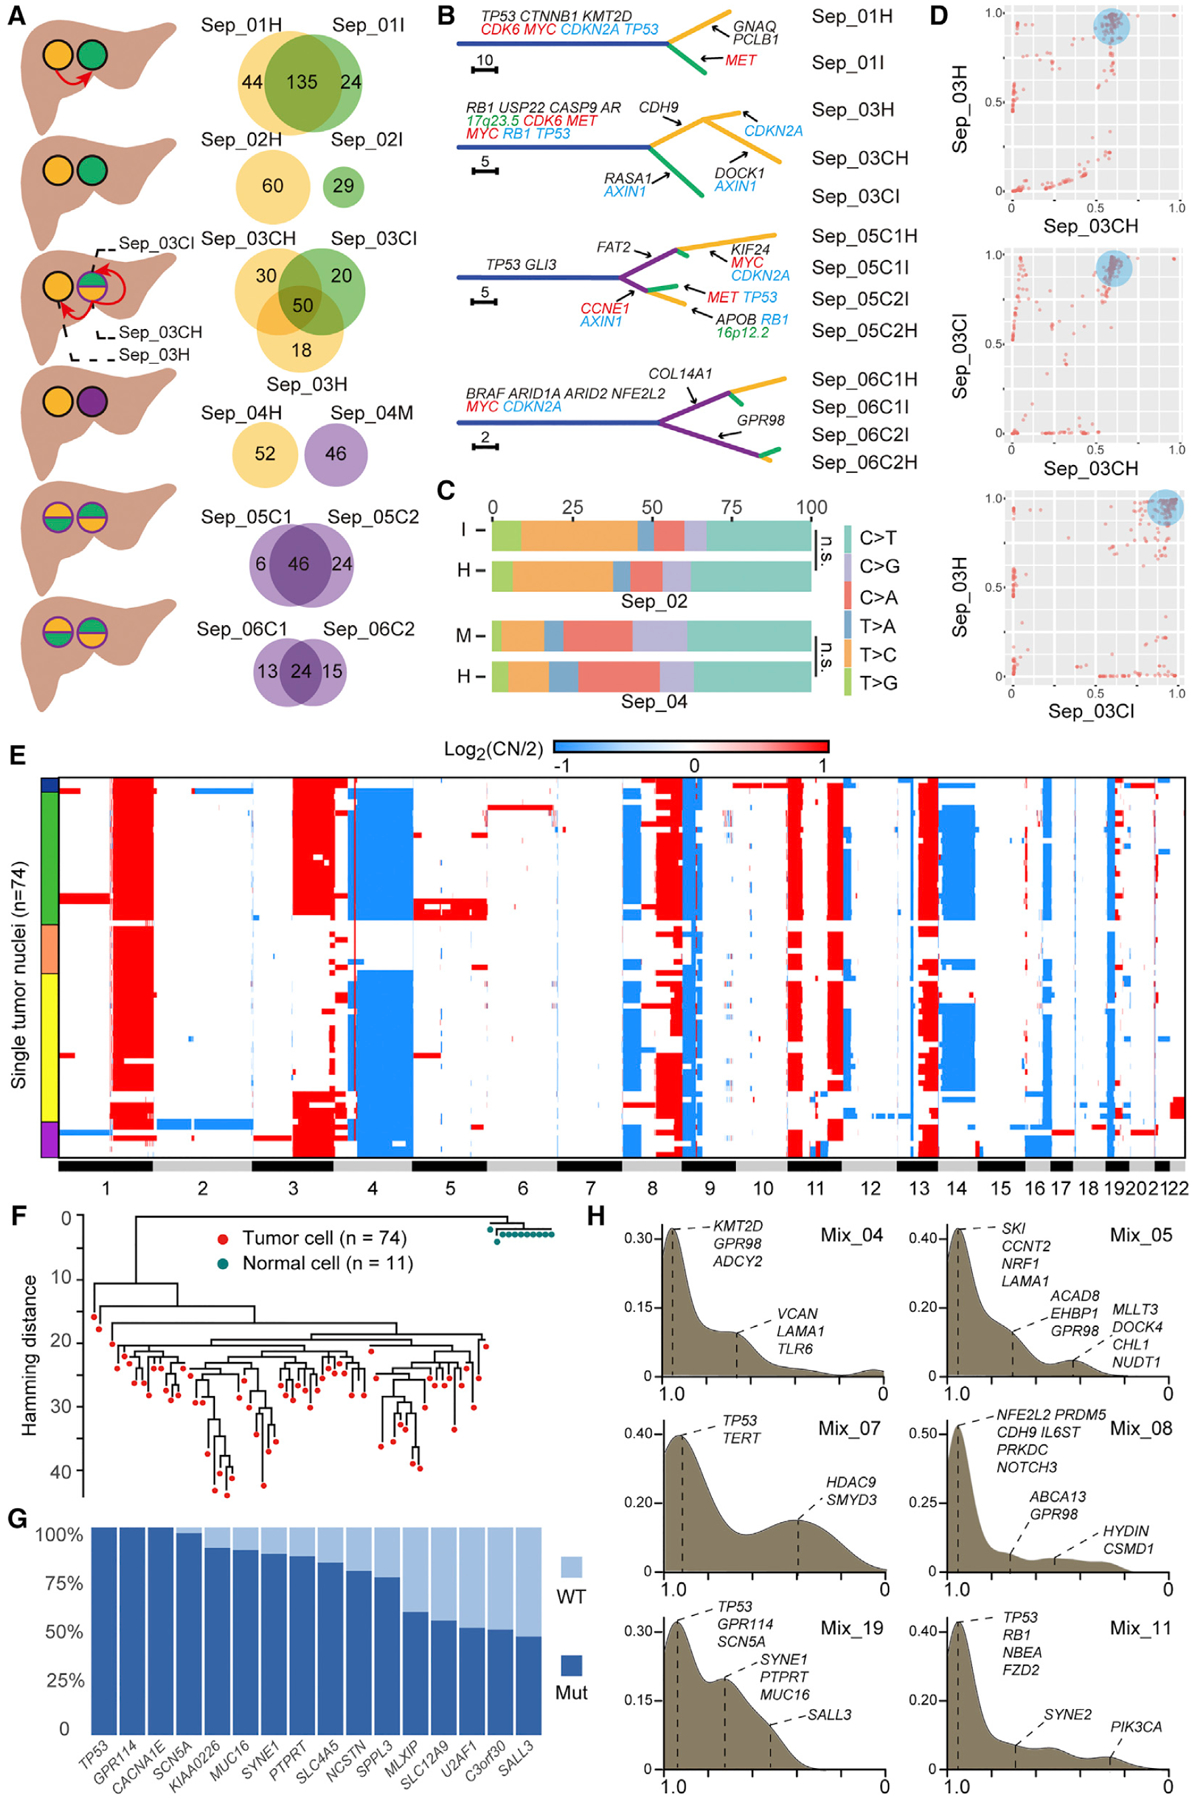
(A) Schematic of six separate type cHCC-ICC cases. Orange, green, and purple denote HCC, ICC, and intermediate or mixed components, respectively. Red arrows indicate potential metastatic routes. Venn diagrams show mutation sharing of matched lesions.
(B) Phylogenetic trees of four separate type cHCC-ICCs with monoclonal origin. The length of each line is proportional to the number of nonsynonymous mutations. Arrows indicate the acquisition of potential driver events. Mutations are in black, amplifications are in red, deletions are in blue, and HBV integrations are in green.
(C) Comparison of mutation spectra of two lesions from two multiclonal cHCC-ICCs.
(D) Pairwise cancer cell fraction plots of mutations identified across the three tumor samples isolated from Sep_03. For instance, in the top graph, each point denotes a mutation: its X coordinate equals the CCF value of this mutation in Sep_03CH; its Y coordinate equals the CCF value of this mutation in Sep_03H. The blue circular shades in three panels mark the subclone that spreads out from the primary (Sep_03CH) and later becomes the founder clone of the metastases (Sep_03CI and Sep_03H).
(E) CNAs of tumor nuclei. Red and blue indicate amplification and deletion, respectively. Colored bands on the left indicate different subpopulations.
(F) Maximum-parsimony tree rooted by normal cells.
(G) Mutational frequencies of selected genes among tumor cells.
(H) Kernel density distribution of mutation CCF values in six mixed type cHCC-ICC cases. The x axis shows the CCF values of mutations. The y axis shows the density of mutations. The major peak around x = 1 denotes mutations shared by all cancer cells, indicating the ancestor clone in this tumor. Other peaks denote mutations shared by subgroups of cancer cells, indicating different subclones. Selected mutations are labeled per their CCF values.
To deduce the potential metastatic route between separate lesions, cancer cell fractions (CCFs) of mutations were plotted between paired lesions. In Sep_01, a cluster of mutations was identified at (1, ~0.6), which means that these mutations were subclonal in Sep_01H but clonal in Sep_01I (Figure S6B). This finding implied that this subclone emerged in the HCC lesion and then spread to the region that later became the ICC lesion as a founding clone. One possibility is that the HCC cells first disseminated and subsequently transformed into ICC due to genetic or microenvironment changes. In Sep_03, Sep_03C was further microdissected into an HCC component, Sep_03CH, and an ICC component, Sep_03CI (Figures 5A and S6C). Interestingly, the CCF plots showed that a subclone in Sep_03CH was clonal in both Sep_03H and Sep_03CI (Figure 5D). Most of the mutations in this subclone were clustered around (1,1) in the plot of Sep_03H and Sep_03CI. These results indicate that this subclone emerged in the HCC component (Sep_03CH) of the cHCC-ICC lesion (Sep_03C). Spreading of this subclone subsequently seeded a “remote” HCC lesion (Sep_03H) and an “adjacent” ICC component (Sep_03CI), either synchronously or metachronously. Notably, Sep_03H retained the HCC phenotype while Sep_03I transdifferentiated into the ICC phenotype.
Bulk and Single Nucleus Sequencing of Mixed Type cHCC-ICC Revealed Its Monoclonal Origin
To explore the subclonal architecture of the mixed type cHCC-ICC, we implemented SNS on one tumor (Mix_19). Low-depth WGS data from 74 tumor nuclei and 11 normal nuclei were analyzed (Figures 5E and 5F). Hierarchical clustering of the CNA profiles of tumor cells identified five major subpopulations (Figure 5E). Many CNAs were shared across subpopulations, suggesting a monoclonal origin. Moreover, a maximum-parsimony tree constructed with all the cells showed that tumor cells exhibited variable distances with the normal cells, suggesting that CNAs were gradually acquired in the tumor as cells progressed from diploid to aneuploid genomes (Figure 5F). We also looked into somatic point mutations in these single cells. To reduce the single base false-positives inherent to whole genome amplification of single cells, high-confidence somatic mutations were selected from bulk tumor exome data to genotype each cell (Table S5). We calculated the mutational frequency of these mutations among the single cells (Figure 5G). Similar to the CNA results, some mutations were clonal while others were subclonal. Besides, mutational profiles of these single cells were consistent with the CCF analysis results of the bulk tumor Mix_19 (Figure 5H). For instance, TP53 and GPR114 mutations, validated in 100% of single cells, did sit in the founding clone (peak around x = 1 in the CCF plot of Mix_19). In contrast, SYNE1 and PTPRT mutations, validated in 80% of single cells, were clustered into a subclone (peak around x = 0.8). Notably, the mutational frequency bar chart (Figure 5G) successfully recapitulated the subclonal composition, containing one founding clone and two subclones, of Mix_19 reconstructed by CCF analysis (Figure 5H). To further explore the clonal diversity of mixed type cHCC-ICC, we expanded the CCF analysis to other cases (Figure 5H). Interestingly, all cases were found to harbor a group of clonal mutations, suggesting their monoclonal origin. Collectively, integrated bulk and SNS analysis unveiled the monoclonal origin and subclonal structure of mixed type cHCC-ICC.
Combined Type cHCC-ICC Exhibited A Monoclonal Origin
A nonoverlapping mutational list between paired HCC and ICC components (H-I pairs), characteristic of multiclonal origin, was not observed in any combined type cHCC-ICC case (Figure 6A). The percentage of shared mutations in each case ranged from 27% to 95%, with a median of 74% (Table S6). In addition, many noncoding mutations and SV events were also shared by H-I pairs (Figure 6B; Table S2). Therefore, all H-I pairs had a monoclonal origin, yet exhibited variable intratumor heterogeneity.
Figure 6. Combined Type cHCC-ICC.
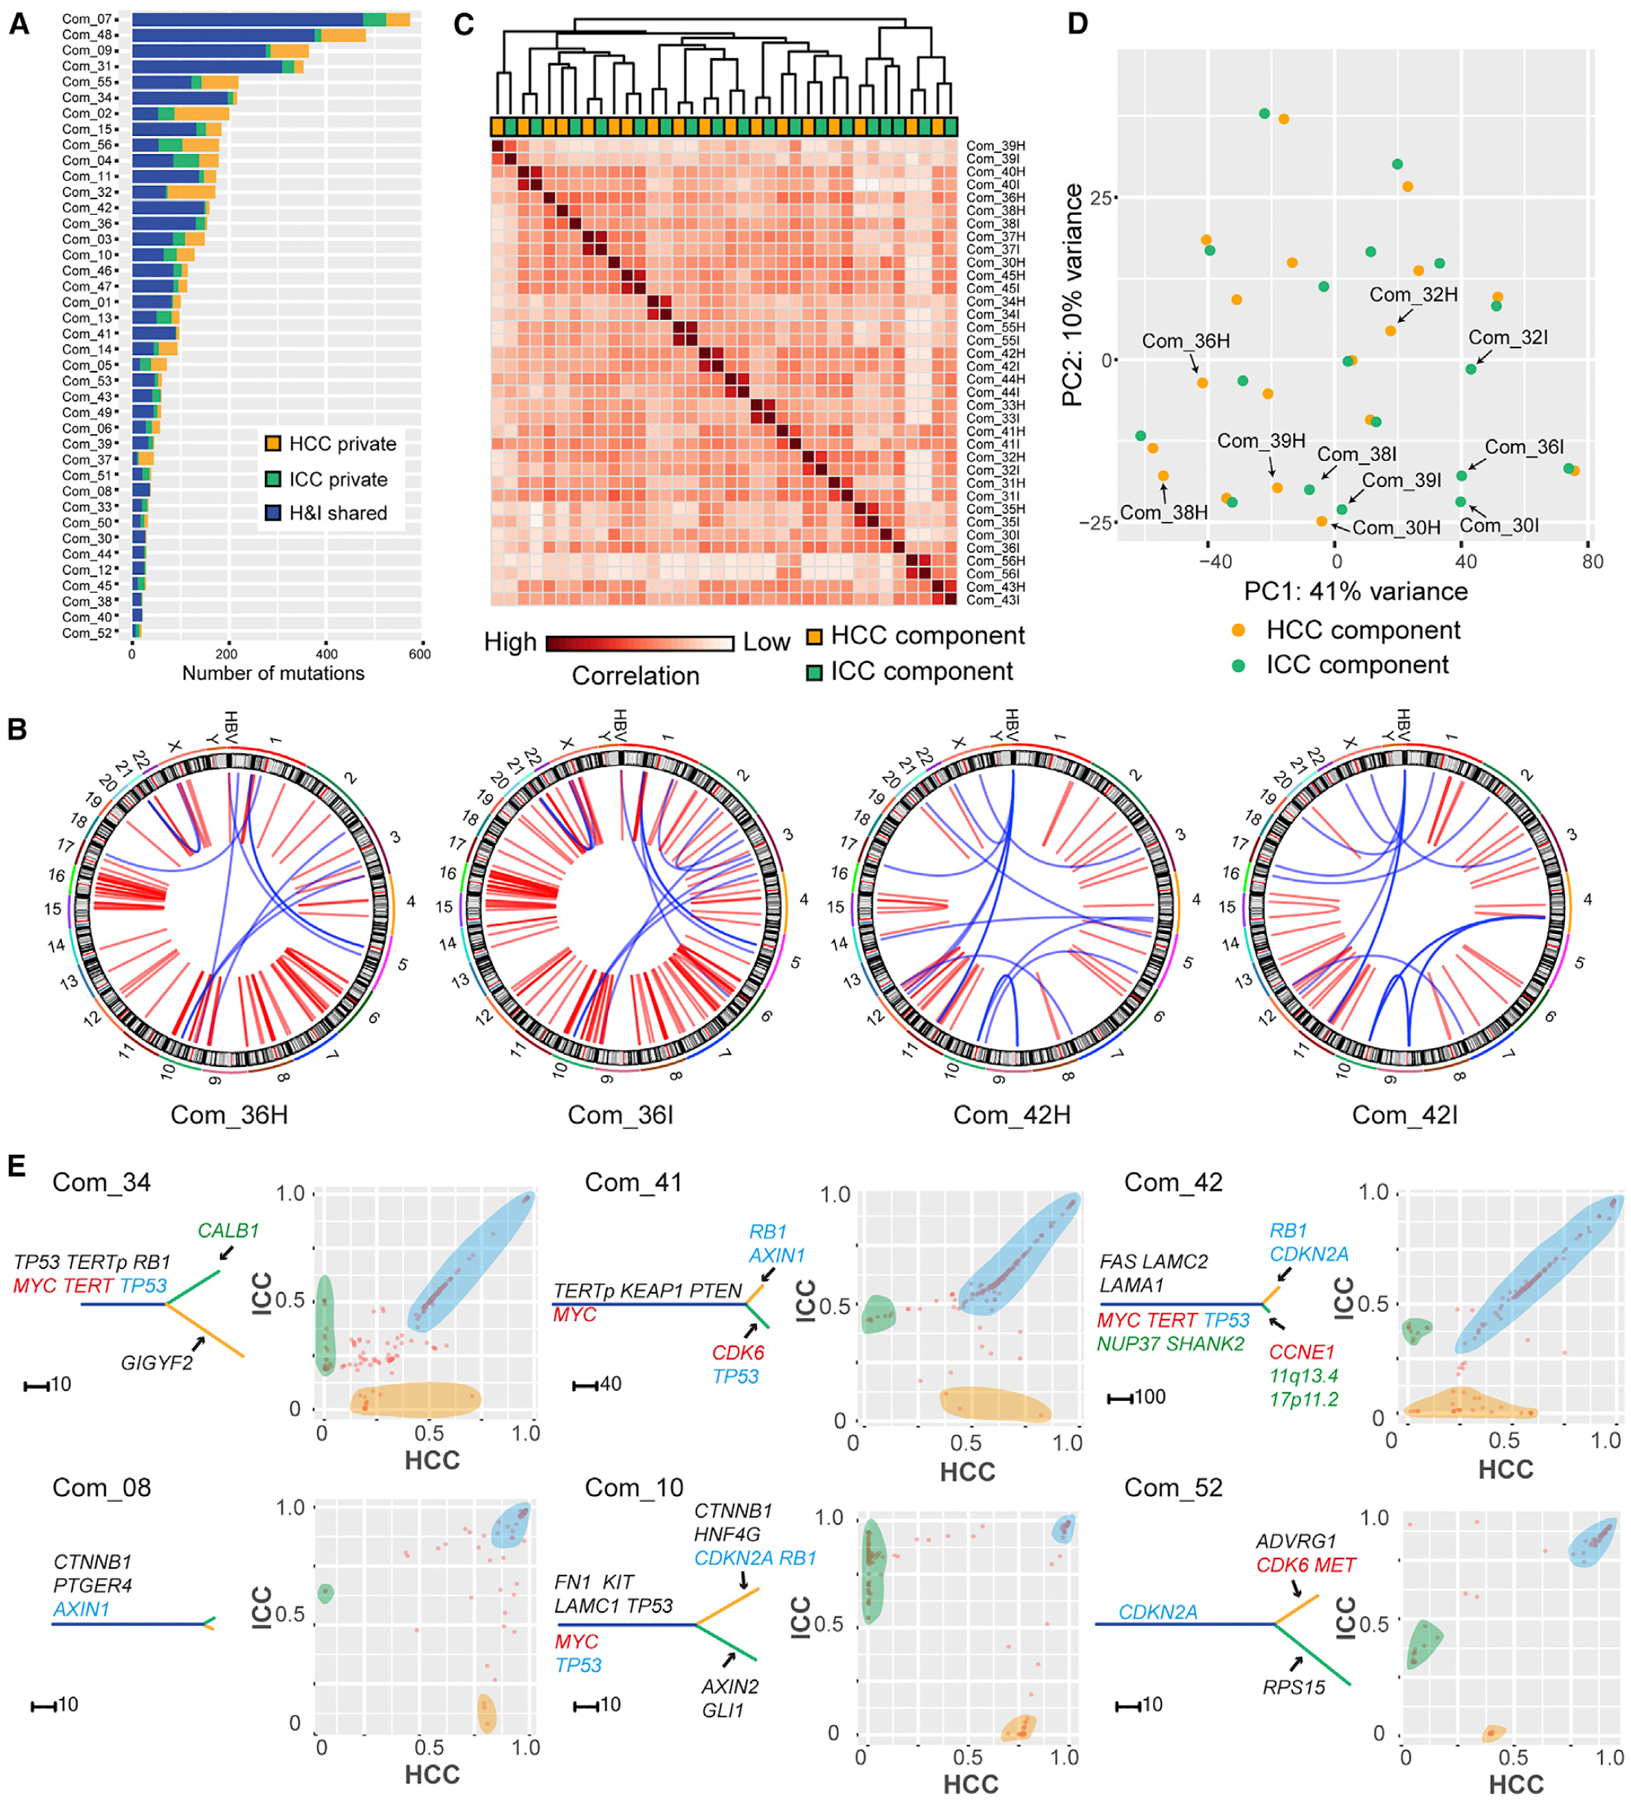
(A) Summary of mutation sharing.
(B) SVs in two H-I pairs. Red and blue denote inter- and intra-chromosomal events, respectively.
(C) Pearson correlation heatmap of gene expression among H-I pairs.
(D) PCA analysis of H-I pairs. Arrows mark H-I pairs separated from each other.
(E) Phylogenetic trees and pairwise CCF plots for H-I pairs. The trees are annotated as in Figure 5B. In CCF plots, each point denotes a mutation: The x, y coordinates are the CCF value of this mutation in the HCC and ICC component, respectively. Orange and green shades mark private mutations for HCC and ICC components, respectively. Blue shades mark mutations that show similar CCF values in both components.
Then we compared the transcriptomic profiles of H-I pairs of combined type cHCC-ICC. Interestingly, Pearson correlation analysis and principle component analysis (PCA) both revealed that most H-I pairs showed a very similar global gene expression pattern (Figures 6C and 6D). This result corroborates our earlier observation that most H-I pairs were not separated from each other and were clustered in PLC cluster P1 (Figure 4A).
Branched evolution can be readily visualized from the phylogenetic trees in all cases (Figures 6E and S7). Different structures of the phylogenetic trees indicate that the phenotypic divergence of H-I pairs takes place at various stages of tumor progression. We speculated that the divergent point of an H-I pair’s subclonal composition might be the point of their phenotypic bifurcation. Then we compared the subclonal structure of H-I pairs and observed two distinct patterns. In some cases, for instance, Com_34, Com_41, and Com_42, many H-I shared subclonal mutations were found along the diagonal line of the CCF plots (Figure 6E). This finding shows that numerous H-I shared subclonal mutations occupy the same proportions of cancer cells in the HCC and ICC components. Therefore, H-I pairs from these cases shared many identical subclones and had a very similar subclonal composition. The most probable scenario is that H-I pairs in these cases underwent subclonal evolution when they were still together, followed by a relatively late phenotypic bifurcation. In contrast, in some cases, including Com_08, Com_10, and Com_52, many H-I shared subclonal mutations were scattered in the CCF plots (Figure 6E). This finding shows that no identical subclones were shared by these H-I pairs. Therefore, H-I pairs from these cases have different subclonal compositions. For these cases, the most probable scenario is that phenotypic bifurcation of H-I pairs occurred immediately after their subclonal diversification.
Nestin Expression Is a Biomarker for cHCC-ICC Diagnosis and Prognosis
Previous mouse model studies demonstrate that p53 restricts cellular plasticity and tumorigenesis in liver cancer via transcriptional repression of Nestin (NES) (Katz et al., 2012; Tschaharganeh et al., 2014), a marker for the bipotent progenitor oval cell (Gleiberman et al., 2005). We reasoned that Nestin expression may correlate with high cellular plasticity in cHCC-ICC. Comparative analysis revealed that the NES expression level of cHCC-ICC was significantly higher than that of HCC (p < 0.01, Student’s t test), but not significantly different from that of ICC (p = 0.07, Student’s t test). We performed further validation by immunohistochemical (IHC) staining of Nestin protein in 128 cHCC-ICC cases, as well as 99 and 86 newly recruited HCC and ICC cases, respectively (Figure 7A; Table S1). Interestingly, the Nestin expression level of the cHCC-ICC cases was significantly higher than that of the HCC and ICC cases (Figure 7B, p < 0.001, p < 0.001, Student’s t test). From another perspective, 104 of 128 (81.3%) cHCC-ICC cases in our staining cohort were Nestin positive, significantly higher than that of HCC or ICC cases (Figure 7C, versus HCC, p < 0.001; versus ICC, p < 0.001). The differences remained significant when our cHCC-ICC cases were compared with published data for HCC and ICC (Figure 7D; versus HCC, p < 0.001; versus ICC, p < 0.001) (Tschaharganeh et al., 2014). Notably, the Nestin-positive rates of HCC and ICC from their cohort were comparable with those of our cohort, and the Nestin-positive rate in ICC was higher than that of HCC in both cohorts. Taken together, these results suggest that a high level of Nestin expression is a critical feature of cHCC-ICC that may lay the basis for bilinear differentiation and high cellular plasticity.
Figure 7. Nestin Staining and Survival Analysis.
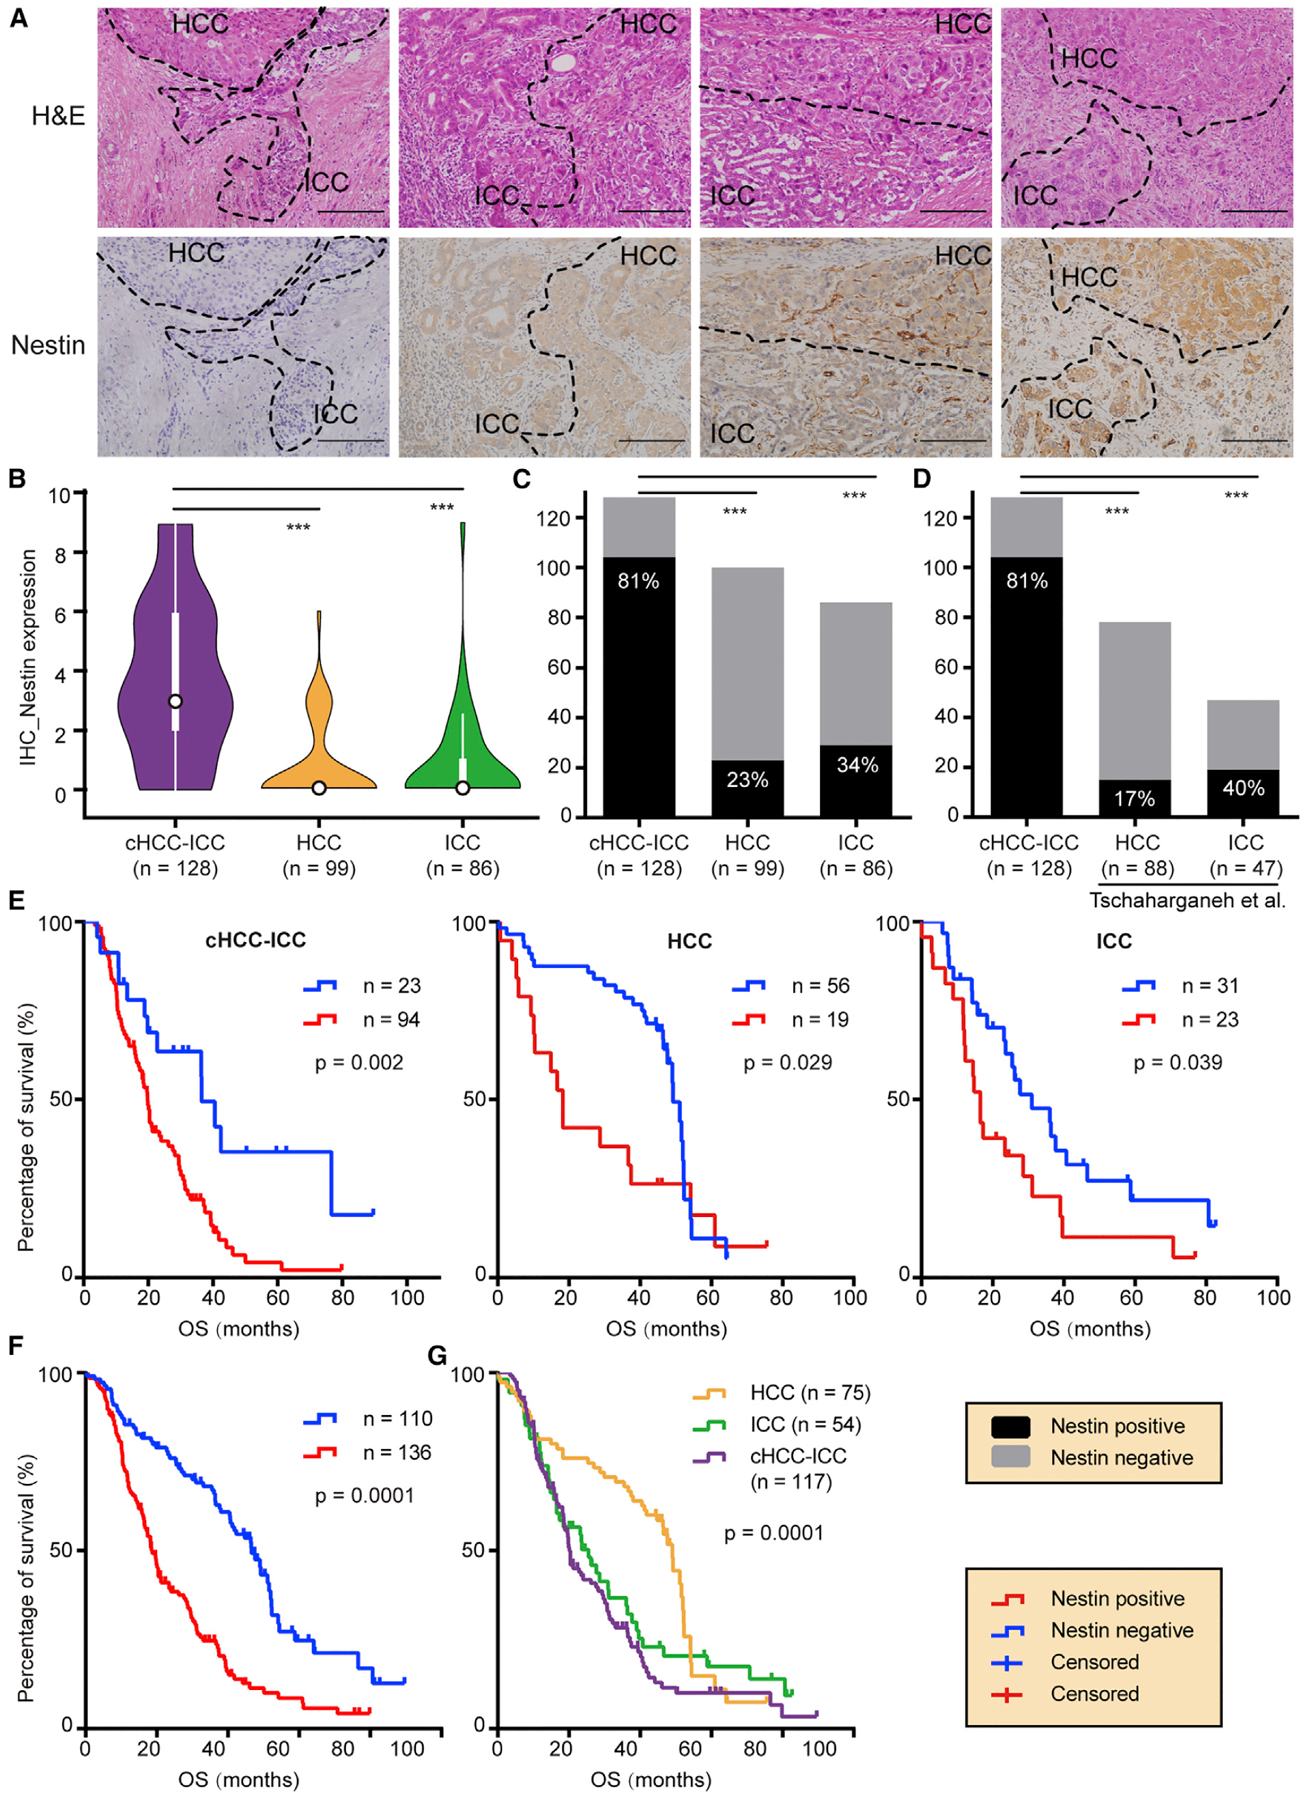
(A) Nestin IHC staining. Staining intensity was graded on a 0–3 scale. Representative combined type cHCC-ICC cases from grade 0 to grade 3 are shown. Scale bar, 200 μm.
(B) Violin plots of Nestin expression in cHCC-ICC, HCC, and ICC. ***p < 0.001, Student’s t test. In the violin plots, black outlined circles indicate the median; white boxes indicate the first and third quartiles; whiskers extend 1.5 times the interquartile range; widths of violin plots indicate kernel density of expression values, all data values are included.
(C and D) Nestin-positive rate in cHCC-ICC compared with HCC and ICC of our cohort (C) and the Tschaharganeh et al. cohort (D). The y axis shows the case number. ***p < 0.001, Fisher’s exact test.
(E) OS of cHCC-ICC, HCC, and ICC stratified into Nestin-positive and Nestin-negative groups, respectively.
(F) OS of all PLC cases stratified into Nestin-positive and Nestin-negative groups.
(G) OS of cHCC-ICC, HCC, and ICC.
In (E–G), p values were calculated with the log rank test.
See also Table S7.
To explore the association between Nestin expression and prognosis in human PLC, we compared the overall survival (OS) across PLC types (Table S7). Strikingly, patients whose tumors expressed Nestin had much worse clinical outcomes than those whose tumors did not across cHCC-ICC, HCC, and ICC cases (Figure 7E). When all PLC cases were taken into account (Figures 7F and 7G), patients with Nestin-positive tumors had a median survival of 18.7 months, much worse than the median survival of 46.6 months for patients with Nestin-negative tumors (p < 0.0001, log rank test). Therefore, Nestin can be used as a biomarker for poor prognosis in all three types of PLC.
DISCUSSION
Whether cHCC-ICC is a unique entity or only a subtype of HCC or ICC remains controversial. Currently, cHCC-ICC is classified into the ICC category in the seventh American Joint Committee on Cancer tumor-node-metastasis staging system (Edge and Compton, 2010). Nevertheless, previous studies draw various conclusions, including ones showing that cHCC-ICC is intimately related to HCC (Maeda et al., 1995; Yano et al., 2003), related to ICC (Cazals-Hatem et al., 2004; Jarnagin et al., 2002), or different from both HCC and ICC (Zhao et al., 2016; Zuo et al., 2007). However, all these studies were based heavily on the clinicopathologic features of small patient cohorts.
In this study, we have provided a detailed genomic landscape of cHCC-ICC and performed a comprehensive comparison of cHCC-ICC with HCC and ICC. Integrative analysis revealed that combined type and mixed type cHCC-ICCs are distinct subtypes associated with different molecular and clinical characteristics. Combined type cHCC-ICC showed strong ICC-like features, such as higher expression of EPCAM, KRT19, and PRDM5, as well as enrichment of KRAS mutations and higher expression of KRAS. In contrast, mixed type cHCC-ICC showed Hoshida-S2-like HCC features, such as higher expression levels of AFP, GPC3, APOE, and SALL4, as well as a higher level of serum AFP. Our results reconcile the debate described above and suggest that previous conflicting observations may result from limited sampling involving only one subtype of cHCC-ICC. More importantly, we found that the Allen and Lisa criteria, a traditional pathologic standard for cHCC-ICC classification, coincide with the molecular classification of cHCC-ICC. Therefore, the Allen and Lisa criteria may direct future therapeutic choices for cHCC-ICC; therapies for ICC may better suit combined type cHCC-ICC, whereas therapies for HCC may be adopted to treat mixed type cHCC-ICC patients.
It is noteworthy that although combined and mixed type cHCC-ICCs are distinct molecular subtypes, they both showed stem-like features and very poor prognosis. How the high stemness is maintained in cHCC-ICCs remains an interesting, yet rarely explored question. A series of mouse model studies (Gleiberman et al., 2005; Katz et al., 2012) lead to the finding that p53 restricts cellular plasticity and tumorigenesis in liver cancer by repressing Nestin, a marker of bipotential liver progenitor cells (Tschaharganeh et al., 2014). Consistently, we found that Nestin expression was significantly higher in both combined and mixed types cHCC-ICC. Of note, in combined type cHCC-ICC, positive Nestin staining was identified in both HCC and ICC components, which outperforms the previously reported biomarker EpCAM, which is only positive in the ICC component. Therefore, our results suggest that Nestin may serve as a biomarker for diagnosing cHCC-ICC. Adding Nestin staining to the current IHC panel for cHCC-ICC may facilitate accurate patient diagnosis and prognosis. Furthermore, potential therapies that reduce Nestin expression and redirect tumor cells from a stem state a differentiated state may provide opportunities for therapeutic intervention for cHCC-ICC patients.
Whether the HCC and ICC components of cHCC-ICC come from the same clonal origin is another long-standing question (Fujii et al., 2000; Moeini et al., 2017; Zhao et al., 2016). We showed that multiple lesions of separate type cHCC-ICC exhibited both monoclonal and multiclonal origins. In other words, a secondary lesion in cHCC-ICC can be either an intrahepatic metastasis or a multiple occurrence. These results also show that lesions with different phenotypes can come from the same clonal origin, indicating the existence of phenotypic transition. Subclonal structure analysis revealed the potential metastatic route between lesions. Whether metastasis or phenotypic transition occurred first remains an interesting question and warrants future studies. Combined type cHCC-ICC cases uniformly display a monoclonal origin with variable intratumor heterogeneity. Interestingly, HCC and ICC components from the same case shared most of their genomic and transcriptomic features. In our PLC clustering analysis, HCC components of combined type cHCC-ICC cases were not clustered into classic HCC subgroups; ICC components of combined type cHCC-ICC cases were not clustered into classic ICC subgroups; on the contrary, most H-I pairs were clustered together. This result may suggest that HCC and ICC components in combined type cHCC-ICC cases are not identical to traditional HCC and ICC, although they exhibit similar clinicopathologic features. The factors that determine HCC and ICC phenotypes in cHCC-ICC remain be explored.
STAR★METHODS
CONTACT FOR REAGENT AND RESOURCE SHARING
Further information and requests for resources and reagents should be directed to and will be fulfilled by the Lead Contact, Ning Zhang (zhangning@bjmu.edu.cn).
EXPERIMENTAL MODEL AND SUBJECT DETAILS
To collect cHCC-ICC cases, we conducted a pan-Asia multi-center study in 8 cancer hospitals and centers: Tianjin Cancer Hospital (Tianjin, China), Sun Yat-Sen University Cancer Center (Guangzhou, China), Fudan University Zhongshan Hospital (Shanghai, China), 302 Hospital of People’s Liberation Army of China (Beijing, China), The First Affiliated Hospital of Guangxi Medical University (Nanning, China), Singapore General Hospital (Singapore), Hiroshima University (Japan) and Wakayama Medical University (Japan).
We performed a systematic review of the case records and diagnostic materials of primary liver cancer patients who underwent curative resection at these hospitals from 2007 to 2018. Among these patients, we found 379 patients diagnosed with cHCC-ICC. We retrieved and scanned all the available diagnostic pathological slides, including but not limited to, H&E (hematoxylin and eosin), CK7, CK19, AFP, hepatocyte and GPC3. A team of experienced liver pathologists (L.C., Y.S.M., W.G. and L.Q.) reviewed all histological and immunohistochemical (IHC) slides independently to verify the diagnostic results. Then a total of 164 cases with tumor and adjacent non-cancerous liver tissues or matched blood samples were selected for this study. All tumor samples were confirmed with more than 70% viable tumor cells, and non-tumorous liver samples were confirmed to be free of tumor cells. Next, DNA was successfully isolated and quality checked in 133 cases. DNA in other 31 cases were heavily fragmented, not able to produce PCR products longer than 100 base pairs and excluded for WES or WGS. RNA was successfully isolated and quality checked in 77 of 133 DNA-isolated cases. RNA from other cases were degraded during long term storage, thus failed in isolation and quality check, and excluded for RNA-seq. Sep_01 (Xue et al., 2016) and 7 RIKEN cases (Fujimoto et al., 2016) were previously sequenced (noted in Table S1). In addition, 128 of 164 cHCC-ICC cases that had enough diagnostic formalin fixed paraffin-embedded (FFPE) tissues were sent for IHC staining of Nestin. The survival data of these cases were followed-up and collected to analyze their prognosis. The detailed clinical and sampling information of the 164 cHCC-ICC cases were listed in Table S1.
This study was conducted in accordance with Declaration of Helsinki and approved by all of the Institutional Review Boards of above hospitals and universities, as well as RIKEN and Peking University. Written informed consent were obtained from all the involved patients.
METHOD DETAILS
Subtype Classification
According to the spatial distribution of HCC and ICC components, we divided 121 of 133 sequenced cHCC-ICC cases into 3 subgroups based on Allen and Lisa’s criteria (Allen and Lisa, 1949): cases with physically separate and histologically different lesions were defined as the separate type (denoted as Sep_ID), cases with clearly defined areas of HCC and ICC components in one tumor were defined as the combined type (denoted as Com_ID), and cases with intimately mixed components of HCC and ICC in one tumor without clear boundaries were defined as the mixed type (denoted as Mix_ID). 12 RIKEN cases were not determined due to limited tissue samples for pathological sections. Among 121 classified cases, 6 cases were separate type, 56 were combined type and 59 were mixed type. To fully characterize the genomic characteristics of these cases, different handling strategies were designed for each subtype (Figure 1B). For the separate type, different lesions were collected separately during surgical resection, and tumor samples were isolated directly from these lesions. In Sep_03, Sep_05 and Sep_06, well-characterized regions of HCC and ICC components can be identified and further isolated via laser capture microdissection (LCM). For the combined type cases, LCM was used to isolate HCC and ICC components as determined by H&E and IHC staining in 41 cases, while the tumor was obtained as a whole in the other 15 cases. For the mixed type cases, each tumor sample was obtained as a whole because the HCC and ICC components could not be distinguished. To deduce the subclonal architecture of mixed type tumors, single nucleus sequencing was performed on one mixed type case (Mix_19). Detailed breakdown of number of samples and number of cases involved in each sequencing platform is shown in the Figures 1A and 1B.
Laser Capture Microdissection
LCM was performed to isolate adjacent HCC and ICC components from the same tissue sections, including 3 cases of separate type and 41 cases of combined type tumors. The tumor tissue was cut consecutively into 3–5 3 μm “diagnosis slides” and 10–15 10 μm “isolation slides” (PEN Membraneslide, Leica). Diagnosis slides were sent for H&E and IHC staining (Marker: GPC3, CK19). Two experienced histologists independently confirmed different tumor areas on these slides. Then the defined area was isolated by LCM using a Leica LMD7000 Microsystem. The isolated samples were preserved in 200μl tubes and sent for DNA and RNA isolation.
DNA Isolation
For fresh frozen tissue and blood samples, DNA was isolated using the DNeasy Blood & Tissue Kit (Qiagen). For FFPE tissue samples, DNA was isolated using the GeneRead DNA FFPE Kit (Qiagen). For LCM samples, DNA was isolated using the QIAamp DNA Micro Kit (Qiagen). The DNA concentration was measured using Qubit 2.0 (Invitrogen). Next, the size of the DNA was checked using Fragment Analyzer (Advanced Analytical Technologies). For FFPE samples, DNA integrity was further evaluated via PCR with a set of custom designed primers randomly selected from the genome with products ranging from 50–500 bp. FFPE DNA that could not produce PCR products longer than 100 bp was excluded from the sequencing cohort. In total, the DNA of 173 tumor samples and their matched non-tumorous tissues or blood from 133 cHCC-ICC cases were sent for library preparation.
Whole Exome Sequencing
200 ng to 1 μg of DNA were sheared into fragments of approximately 300 bp using Covaris S2 (Covaris). The library was constructed using NEBNext Ultra DNA Library Prep Kit for Illumina (New England Biolabs) according to the manufacturer’s protocol. Exome regions were captured with SureSelect All Exon V6 (Agilent Technologies) according to the manufacturer’s protocol. The post-hybridization amplification product (2 × 150-bp paired-end reads) was quality checked and sequenced with Illumina HiSeq 4000 (Illumina).
After removing PCR duplicates, the average depth of WES was 108X for tumors, 101X for their normal counterparts, 114X for fresh frozen samples and 86X for FFPE samples. An average of 101 mutations was identified in these samples. Com_07, Mix_01, and Com_09 had exceptionally large numbers of somatic mutations (580, 398, 372, respectively), exhibiting DNA mismatch repair and nucleotide excision repair deficiency. Fewer than 10 mutations were detected in Com_35, Mix_29 and Mix_46, and they were excluded from the genomic landscape and mutational frequency analysis.
Whole Genome Sequencing
We selected 41 tumor samples and their match normal from 37 cases with high quality DNA for WGS. The library was constructed with using NEBNext Ultra DNA Library Prep Kit for Illumina (New England Biolabs) according to the manufacturer’s protocol. Then the library (2 3 150-bp paired-end reads) was quality checked and sequenced with Illumina Novaseq (Illumina).
Mutation Calling with WES Data
Paired-end reads were aligned to human genome hg19 (UCSC) using BWA with default parameters (Li and Durbin, 2009). Samtools (v0.1.19) was used to convert SAM files to compressed BAM files and sort the BAM files by chromosomal coordinates (Li et al., 2009). The reads were realigned to the genome with the Genome Analysis Toolkit (GATK 2.1–8) based on dbSNP 135 (www.ncbi.nlm.nih.gov/projects/SNP/) (McKenna et al., 2010). PCR duplicates were marked with Picard (v1.56), and the sorted, marked BAM files were realigned with GATK at intervals with indel mismatches. Point mutations were called with Mutect (v1.1.4) (Cibulskis et al., 2013). Indels were called with GATK Unified Genotyper and manually checked to filter out false callings. All variants were annotated with SnpEff 4.0 (Cingolani et al., 2012). A series of filtering criteria were applied to the variant candidates to finally identify the point mutations and INDELs: (1) at least 10X coverage was required in the normal sample of each patient bearing at most 1X mutation coverage; (2) at least 10X total coverage was required in tumor samples in which over 3X mutation coverage was required; (3) reads with Phred quality below 20 at each variant position were excluded; (4) variations listed in dbSNP 135 were removed unless they were documented in the Catalog of Somatic Mutations in Cancer (COSMIC) database; (5) variants listed in the National Heart, Lung, and Blood Institute Exome Sequencing Project were removed. Among cases with multiple samples, variants detected in more than one sample, but not all samples, were recalled as absent in the other samples due to low variant allele frequency to reduce false negative callings. All somatic mutations identified in these patients are summarized in Table S2.
Mutation Calling with WGS Data
For WGS data, somatic variants were detected using the Genomon pipeline (https://genomon-project.github.io/GenomonPages/). Paired-end reads were mapped onto the reference human genome GRCh37 using BWA, and PCR duplicates were marked using biobambam. Point mutations and INDELs were called by comparing matched pairs of tumor and normal tissue, after which they were filtered using Fisher’s exact test with the following parameters: minimum read depth in both tumor and normal tissue, 8; minimum base quality, 15; minimum mapping quality, 20; minimum number of variant-supporting reads in tumor tissue, 4; minimum of variant allele frequency in tumor tissue, 2%; maximum of variant allele frequency in normal tissue, 10%; maximum p value for Fisher’s exact test, 0.1. The variants were further filtered using a panel of normal tissues using EBCall (Shiraishi et al., 2013), and annotated using ANNOVAR (Wang et al., 2010).
TERT Promoter Mutation
To identify TERT promoter mutations, we designed two pairs of primers covering the core promoter region. Primer pair 1 (490 bp): forward, 5′-GCAGCACCTCGCGGTAGTGGCTG-3′, reverse, 5′- GCCGATTCGACCTCTCTCCGCTGGCC-3′; Primer pair 2 (345 bp): forward, 5′- CAGCGCTGCCTGAAACTCGC-3′, reverse, 5′- TGGCGTCCCTGCACCCTGG-3′. Polymerase chain reaction (PCR) was performed on the genomic DNA, followed by direct sequencing with an ABI 3730 DNA Sequence Analyzer. Two independent PCR reactions using different primers were performed for each sample to validate the results. Chromatograms of these samples were viewed with the Chromas (v2.3).
Somatic Mutation Validation
Validation of somatic mutations was also performed following the above pipeline. We randomly selected and designed primers for a series of mutations from different tumors. Finally, excluding those that failed to amplify via PCR, 95.3% of the selected mutations were validated. These results show that our sequencing and mutation calling pipeline is robust.
HBV Integration Analysis
We first aligned all reads against a comprehensive list of hepatitis B virus reference sequences as described previously (n = 73, Table S2) (Xue et al., 2016). Next, we searched for human-virus chimeric reads, where one end or one part of the read was mapped to the human genome, while the other end or the left part of the read was mapped to the viral reference genome, because these reads indicate HBV integration into the human genome. Adjacent or overlapping chimeric reads (within 500 bp) aligning to the human and viral genomes in the same orientation were merged to make clusters. Clusters with at least two chimeric reads were retained (Table S2). The integration sites were then compared to RefSeq gene boundaries to find genes that were directly disrupted by HBV integration (overlapping) or potentially affected by integration (within 15 kb of integration sites).
Structural Variation Analysis
Structural variations (SVs) were detected using GenomonSV (https://github.com/Genomon-Project/GenomonSV), which utilizes both chimeric reads and improper alignments for SV detection. SVs between human chromosomes and the HBV genome were determined as HBV integrations.
Copy Number Alteration
For WES data, Sequenza (v2.1.1) was used to call copy number alteration (CNA), taking both ploidy and cellularity into account (Favero et al., 2015). Briefly, we used BAM files from WES data of tumor and paired normal samples as input to calculate the depth ratio and normalize the ratio considering both GC content bias and data ratio. To acquire segmented copy numbers and estimate cellularity and ploidy, the following parameter setting was used: breaks.method = ‘full’, gamma = 40, kmin = 5, gamma.pcf = 200, kmin.pcf = 200. For each tumor sample, copy numbers of segments were then divided by ploidy following log2 transformation. After filtering out segments smaller than 500kb, copy number states were determined for each segment. Copy number gains and losses were defined as at least one copy more and one copy less than the estimated ploidy, respectively. Among these, amplifications were further defined as 4 or more copies more than the ploidy whereas deletions were further defined as total deletion of the segments. Sex chromosomes were excluded in this analysis.
CNVkit (v0.9.2) was also performed with default parameter on paired tumor-normal WES data (Talevich et al., 2016). After segmentation, the absolute integer copy number of each segment is estimated with methods “threshold” and “clonal”.
For WGS data, BAM files of tumors and normal tissue samples were filtered to remove PCR duplicates and reads with mapping quality < 30, after which they were downsampled to 20 million reads each. QDNASeq (Scheinin et al., 2014) was used for quantification of read depth per 15kb bin, normalization, tumor-normal signal subtraction, segmentation, and copy number calling.
GISTIC2.0 (Genomic Identification of Significant Targets in Cancer v2.0.23) was used to identify focal gain and loss regions (q < 0.25) (Mermel et al., 2011).
RNA Isolation and Sequencing
We selected 77 cHCC-ICC cases with well-preserved fresh frozen tissue to isolate RNA and perform RNA-seq. For frozen tissue samples, total RNA was isolated using the RNeasy Mini Kit (Qiagen). For LCM samples, total RNA was isolated using the AllPrep DNA/RNA Micro Kit (Qiagen) with the DNA used for WGS or WES. RNA-seq libraries were constructed using NEBNext Ultra RNA Library ((New England Biolabs) according to the manufacturer’s protocol. Then the library (2 × 150-bp paired-end reads) was quality checked and sequenced with Illumina Novaseq (Illumina).
Gene Fusion Analysis
To detect gene fusion from RNA-seq data, we used fusionfusion software (https://github.com/Genomon-Project/fusionfusion). Chimeric reads were extracted from the alignments generated by STAR (Dobin et al., 2013), and filtered using a panel of normal, which was RNA-seq of nontumorous liver tissues from four cHCC-ICC cases.
Quantification of mRNA Expression Levels
RNA-seq reads were mapped onto the reference human genome GRCh37 using STAR. The number of reads per gene was counted with featureCounts (Liao et al., 2014) using the GENCODE v19 annotation. Fragments per kilobase of exon per million mapped reads (FPKM) was computed using a custom R script.
Unsupervised Clustering
To perform mRNA expression clustering, a series of genes were filtered: (1) 386 liver-specific genes defined in a previous study (Farshidfar et al., 2017), (2) genes expressed at low levels (FPKM < 1.0) in more than half of samples, and (3) genes of low variance across samples (coefficient of variation < 0.8). The FPKM expression values of the remaining 4,362 genes were log-transformed and scaled across samples. Unsupervised hierarchical clustering was performed with the Ward linkage using 1 – r as distance, where r is Pearson’s correlation coefficient. Immune cluster of cHCC-ICC were generated with a list of 66 immune marker genes reported in a previous study (TCGA, 2017).
Differential Expression Analysis
Differentially expressed genes between different subgroups and PLC clusters were identified using DESeq2 (Love et al., 2014), followed by GO and KEGG enrichment analysis. GSEA analysis was performed by feeding log fold changes computed by DESeq2 into the GSEA preranked module of the GenePattern server (http://www.genepattern.org/) (Subramanian et al., 2005). The scoring scheme was classic Kolmogorov-Smirnov, and the number of permutations was 10,000.
Potential Driver Genes for cHCC-ICC
We applied the following criteria to determined potential driver genes for cHCC-ICC:
-
1
MutSigCV (v1.41) was performed and TP53 was the only significantly mutated gene identified in our cohort (FDR < 0.1).
-
2
The dNdScv R package was used to detect genes under positive selection in our cohort Six driver genes were identified, TP53, AXIN1, RB1, PTEN, ARID2 and BRD7 (q < 0.1).
Then we noticed that many well-known driver genes for HCC and ICC, such as KMT2D and ARID1A, were recurrently mutated in our cohort yet not identified by the above analysis. To reduce the false negative calling, we expanded the list with the following considerations:
-
3
TERT promoter mutation was detected by Sanger sequencing rather than exome sequencing, thus not suitable for the above significance analysis based on exome sequencing. However, TERT promoter mutation is one of the most important drivers for HCC; it was mutated in 27% of our cHCC-ICC cohort, all of which located at the hotspot chr5, 1,295,228 (C228T) and thus was selected as a driver gene.
-
4
A thorough review of liver cancer genomic (HCC, ICC and CCA) papers was performed (TCGA, 2017; Farshidfar et al., 2017; Chaisaingmongkol et al., 2017; Fujimoto et al., 2016; Jusakul et al., 2017; Schulze et al., 2015; Totoki et al., 2014; Xue et al., 2017). Genes identified as drivers in HCC and ICC that were also mutated in more than 5% of cases in our cohort were added to the list of potential driver genes.
Finally, we generated a list of 14 potential driver genes for cHCC-ICC.
Potential Drivers for Individual cHCC-ICC
Potential driver mutations for each individual were determined, especially for the separate-type and combined type cases with the purpose to label potential driver events on the phylogenetic trees. We applied three criteria to assess all identified nonsynonymous mutations in each patient: (1) mutations occurred in highly-reported driver genes in primary liver cancer that were defined by previous studies (HCC, ICC, CCA and our cHCC-ICC driver list) or documented in the COSMIC database, such as TP53, AXIN1, and CTNNB1; (2) mutations in other genes documented in the COSMIC database and related to other types of cancer; (3) a variant gene was present in the Kyoto Encyclopedia of Genes and Genomes (KEGG) cancer pathways. Mutations that matched any one of these criteria were considered to be potential driver mutations for individuals.
Mutational Signature
The de novo mutational signatures of all cases were extracted by a non-negative matrix factorization (NMF) method as described previously (Alexandrov et al., 2013). One-thousand iterations of NMF were performed, and each NMF run was iterated until convergence (10,000 iterations without change) or until 1 million iterations were achieved. Three stable and reproducible mutational signatures were deciphered (see the stability and error plot in Figure S3A) and termed signatures A, B and C. Cosine similarity was analyzed to compare these signatures to the catalog of 30 COSMIC consensus signatures. All samples were clustered on the basis of the number of somatic mutations contributed by each signature in each sample using unsupervised hierarchical clustering with Ward linkage. Multiple linear regression analysis was implemented using the R command lm to identify potential associations between signatures and clinical variables. To further determine the distribution of COSMIC signatures in each patient, deConstructSigs and mSigAct were performed as described (Ng et al., 2017; Rosenthal et al., 2016). The frequencies of these signatures among our cohort were summarized.
Phylogenetic Tree and Mutation Spectrum
To reveal the clonal relationship of tumor samples in each patient with multiple samples, phylogenetic trees were constructed using MEGA5 (Tamura et al., 2011). Sequences 20 bp in length surrounding all mutations were extracted to construct the phylogenetic trees of each patient based on the maximum-parsimony algorithm. All phylogenetic trees were further optimized using Adobe Illustrator. Potential driver events for each patient were labeled on each tree. To identify possible alterations of mutagenic processes during carcinogenesis, the mutation spectra of trunk mutations and branch mutations were compared. For 2 separate type cases with multi-clonal origins (Sep_02, Sep_04), we compared the mutation spectra of different lesions.
Cancer Cell Fraction and Subclonal Structure
The cancer cell fraction (CCF) of all somatic mutations across all samples in each patient was estimated by PyClone, a hierarchical Bayesian model for estimating the cellular prevalence of mutations and for clustering these mutations to infer clonal structure (Roth et al., 2014). We also included mutations that were not located in exome regions to improve the sensitivity of the analysis. Mutations with cellular prevalence that co-varied across samples were clustered into subclones. The CCFs of mutations were plotted between paired samples in the same patient.
Metastatic Route
For these spatially separate lesions from a monoclonal origin, one lesion may seed the other and the potential metastatic route, if any, between paired lesions can be determined by comparing their subclonal architecture. Hence, CCF plots were used to deduce the potential metastatic routes between different tumor lesions in the same patient. Theoretically, mutations with similar CCF values tend to occupy the same proportion of cancer cells and cluster together in the CCF plots, indicating the existence of a cancer cell clone (Nik-Zainal et al., 2012). Metastasis is frequently initiated by subclones in the primary tumor (CCF < 1), whose mutations will be inherited by every tumor cell in the metastatic site (CCF = 1) (Gundem et al., 2015).
For the combined type cHCC-ICC, CCF plots were used to compare the subclonal composition of HCC components and ICC components in the same tumor lesion.
Single Nucleus Sequencing and Genotyping
To further deconstruct the clonal architecture of the mixed type cHCC-ICC cases, we used single nucleus sequencing to analyze genomic aberrations in Mix_19. The frozen tumor specimen was sliced in half at its widest point. One half was subjected to bulk sequencing, whereas the other half was made into nuclear suspensions and stained with DAPI for isolation as described previously (Navin et al., 2011). 94 nuclei from the tumor and 15 nuclei from normal tissue were randomly isolated and subjected to whole genome DNA amplification using MALBAC as previously described (Zong et al., 2012). 74 tumor nuclei and 11 normal nuclei passed the quality control test and were sent for whole genome library preparation and subsequent low-depth WGS as reported previously (Xue et al., 2016). Next, CNAs in these nuclei were analyzed. To genotype somatic mutations in single nuclei, we designed primers for selected somatic point mutations identified by exome sequencing (Table S5). Next, we used Sanger sequencing to validate every single nucleus with these mutations as described above.
Single Nucleus CNA Analysis
Clean reads were aligned to hg19 using the BWA. Duplicated reads were removed using “Samtools rmdup”. The coverage depth at each base within the covered genomic region was calculated with “Samtools depth”. The whole genome was then segmented into small bins with 0.5M in size and total depth in each bin was calculated. After normalizing the total depth of each bin by sequencing data volume, we corrected bias from genomic GC content using Loess normalization (Baslan et al., 2012). Then, Loess normalization was applied to calculate depth ratio and correct the bias caused by whole genome amplification using coverage depth from single normal nuclei as control. Circular binary segmentation (CBS) algorithm documented in “DNAcopy” R package was then used to acquire segmented copy number. Small adjacent segments with non-significant differences were further joined using MergeLevels (Willenbrock and Fridlyand, 2005). Finally, the segmented depth ratio was multiplied by 2 and rounded to the closest integer values, generating integer copy number. Hierarchical clustering analysis was performed based on R hclust function with clustering method “ward”. Maximum-parsimony trees were plotted as described (Gao et al., 2016).
IHC Staining
The FFPE tissue blocks were cut into 4-μm slides and placed in an oven for 2 hr at 65°C. Xylene and graded concentrations of ethanol were used for sequential washing of the sections. Endogenous peroxidase activity and nonspecific staining were blocked by 3% H2O2 for 15 min and 3% bovine serum albumin (BSA; Roche) for 1 h, respectively. Incubation with the primary antibodies was performed at room temperature for 30 minutes and then at 4°C overnight. The concentrations and sources of the antibodies used in this study were as follows: CK19, Abcam (ab52625), 1:400; AFP, Proteintech (14550–1-AP), 1:200; GPC3, Abcam (ab66596), 5 μg/mL; hepatocyte, Abcam (ab190706), 0.5 μg/mL; CK7, Abcam (ab181598), 1:8000, Nestin, Santa Cruz Biotechnology, 1:100. Tissue samples were washed with PBS three times and stained with the secondary antibody (1:200) at 37°C for 1 h, after which they were visualized by 3,3-diaminobenzidine staining, counterstained with 10% Mayer’s hematoxylin solution, dehydrated, mounted, dried and observed.
Expression Level of Nestin Based on IHC
The staining intensity of Nestin was classified on a scale from 0 to 3 as follows: 0 for no staining, 1 for weak immunoreactivity, 2 for medium immunoreactivity and 3 for strong immunoreactivity. The percentage immunoreactivity of each sample was scored on a scale from 0 to 3 as follows: 0 for no positive cells, 1 for < 30% positive cells, 2 for 30 to 60% positive cells and 3 for > 60% positive cells. The scores for staining intensity and percentage immunoreactivity were multiplied to produce the final score for positive staining. The level of staining was classified on a scale from 0 to 9 as follows: negative (0); weakly positive (+) (1–3); moderate positive (++) (4–6); and strong positive (+++) (7–9). All images were captured with a fluorescence microscope (Olympus BX61).
Public Datasets
As a part of the International Cancer Genome Consortium (ICGC), we previously published RNA-Seq and WGS data of HCC, ICC and cHCC-ICC from Japanese patients (Fujimoto et al., 2016). We reanalyzed these data in conjunction with the newly sequenced samples. For the Cancer Genome Atlas (TCGA) data, samples from the TCGA-CHOL or TCGA-LIHC projects were examined and incorporated into the study only when the histological types were either “Cholangiocarcinoma; intrahepatic” or “Hepatocholangio-carcinoma (Mixed)”. RNA-Seq BAM files were downloaded from the NCI Genomic Data Commons (https://gdc.cancer.gov) and reverted to FASTQ files. Somatic mutation calls were downloaded from cBioPortal (www.cbioportal.org/).
QUANTIFICATION AND STATISTICAL ANALYSIS
Quantification methods and statistical analysis methods for each analysis are described in the main text and referenced in the related Method Details section above. Survival analysis based on Nestin was performed using Graphpad Prism7 with both Log-rank test and Gehan-Breslow-Wilcoxon test. Survival analysis based on PLC clusters was performed using the R package “survminer” (v0.4.3) with Log-rank test.
DATA AND SOFTWARE AVAILABILITY
The accession number for the sequencing data_reported in this paper is EGA: EGAS00001003093. Software used in this study are noted in the Method Details section above and the Key Resources Table.
KEY RESOURCES TABLE
| REAGENT or RESOURCE | SOURCE | IDENTIFIER |
|---|---|---|
| Antibodies | ||
| Anti-Cytokeratin 19 | Abcam | Cat# ab52625; RRID: AB_2281020 |
| AFP antibody | Proteintech | Cat# 14550-1-AP; RRID: AB_2223933 |
| Anti-Glypican 3 | Abcam | Cat# ab66596; RRID: AB_1141042 |
| Anti-Hepatocyte Specific Antigen | Abcam | Cat# ab75677; RRID: AB_1523754 |
| Anti-Cytokeratin 7 | Abcam | Cat# ab181598; RRID: AB_278382 |
| Nestin antibody | Santa Cruz Biotechnology | Cat# sc-23927; RRID: AB_627994 |
| Goat anti-Mouse secondary antibody | Abcam | Cat#ab6789; RRID: AB_955439 |
| Goat anti-Rabbit secondary antibody | Abcam | Cat#ab6721; RRID: AB_955447 |
| Biological Samples | ||
| Tumor, adjacent non-cancerous liver tissues and blood samples from patients diagnosed with cHCC-ICC | This paper | This paper (PKU_cHCC-ICC) |
| Critical Commercial Assays | ||
| PEN Membraneslide | Leica | Cat#11505158 |
| DNeasy Blood & Tissue Kit | Qiagen | Cat#69504 |
| GeneRead DNA FFPE Kit | Qiagen | Cat#180134 |
| QIAamp DNA Micro Kit | Qiagen | Cat#56304 |
| RNeasy Mini Kit | Qiagen | Cat#74106 |
| AllPrep DNA/RNA Micro Kit | Qiagen | Cat#80284 |
| NEBNext Ultra DNA Library Prep Kit for Illumina | New England Biolabs | Cat#E7645L |
| SureSelect All Exon V6 | Agilent Technologies | Cat#5190-8864 |
| NEBNext Ultra RNA Library Prep Kit for Illumina | New England Biolabs | Cat#E7530L |
| Deposited Data | ||
| cHCC-ICC WES data | This paper | EGA: EGAS00001003093 |
| cHCC-ICC WGS data | This paper | EGA: EGAS00001003093 |
| cHCC-ICC RNA-seq data | This paper | EGA: EGAS00001003093 |
| TCGA LIHC data | TCGA, 2017 | https://gdc.cancer.gov/ |
| TCGA CHOL data | Farshidfar et al., 2017 | https://gdc.cancer.gov/ |
| ICGC HCC data | Fujimoto et al., 2016 | https://dcc.icgc.org/ |
| ICGC CCA data | Jusakul et al., 2017 | https://dcc.icgc.org/ |
| Oligonucleotides | ||
| Primer1 for TERT promoter, Forward GCAGCACCTCGCGGTAGTGGCTG | This paper | N/A |
| Primer1 for TERT promoter, Reverse GCCGATTCGACCTCTCTCCGCTGGCC | This paper | N/A |
| Primer2 for TERT promoter, Forward CAGCGCTGCCTGAAACTCGC | This paper | N/A |
| Primer2 for TERT promoter, Reverse TGGCGTCCCTGCACCCTGG | This paper | N/A |
| Primers for mutation validation of single nucleus, see Table S5 | This paper | N/A |
| Software and Algorithms | ||
| BWA | Li et al., 2009 | http://bio-bwa.sourceforge.net/ |
| Samtools v0.1.19 | Li et al., 2009 | http://samtools.sourceforge.net/ |
| GATK v2.1–8 | McKenna et al., 2010 | https://software.broadinstitute.org/gatk/ |
| Mutect v1.1.4 | Cibulskis et al., 2013 | https://software.broadinstitute.org/cancer/cga/mutect |
| SnpEff 4.0 | Cingolani et al., 2012 | http://snpeff.sourceforge.net/about.html |
| Genomon | N/A | https://genomon-project.github.io/GenomonPages/ |
| EBCall | Shiraishi et al., 2013 | https://github.com/friend1ws/EBCall |
| ANNOVAR | Wang et al., 2010 | http://annovar.openbioinformatics.org/en/latest/user-guide/download/ |
| MutSigCV 1.4 | Lawrence et al., 2013 | https://software.broadinstitute.org/cancer/cga/mutsig_download |
| dNdScv | Martincorena et al. (2017) | https://github.com/im3sanger/dndscv |
| SigProfiler Mutational Signatures | Alexandrov et al., 2013 | https://ww2.mathworks.cn/matlabcentral/fileexchange/38724-sigprofiler |
| deConstructSigs | Rosenthal et al., 2016 | https://github.com/raerose01/deconstructSigs |
| mSigAct | Ng et al., 2017 | https://stm.sciencemag.org/content/suppl/2017/10/16/9.412.eaan6446.DC1 |
| MEGA5 | Tamura et al., 2011 | https://www.megasoftware.net/download_form |
| PyClone | Roth et al., 2014 | https://github.com/aroth85/pyclone |
| DNAcopy | Venkatraman et al., 2007 | https://bioconductor.org/packages/release/bioc/html/DNAcopy.html |
| Sequenza v2.1.1 | Favero et al., 2015 | http://www.cbs.dtu.dk/biotools/sequenza/ |
| CNVkit v0.9.2 | Talevich et al., 2016 | https://cnvkit.readthedocs.io/en/stable/ |
| GISTIC v2.0.23 | Mermel et al., 2011 | https://software.broadinstitute.org/cancer/cga/gistic |
| STAR | Dobin et al., 2013 | https://github.com/alexdobin/STAR |
| DESeq2 v1.22.2 | Love et al., 2014 | http://bioconductor.org/packages/release/bioc/html/DESeq.html |
| Gene Set Enrichment Analysis (GSEA) v3.0 | Subramanian et al., 2005 | http://software.broadinstitute.org/cancer/software/genepattern/ |
| pheatmap | N/A | https://www.rdocumentation.org/packages/pheatmap/versions/1.0.2 |
| survminer v0.4.3 | N/A | https://cran.r-project.org/web/packages/survminer/index.html |
| Chromas v2.3 | N/A | www.technelysium.com.au |
| Graphpad Prism7 | N/A | https://www.graphpad.com/ |
| Rstudio v3.5.1 | N/A | https://www.rstudio.com/products/rstudio/ |
Supplementary Material
Significance.
cHCC-ICC is a rare type of liver cancer with a dismal prognosis; its accurate diagnosis and specialized treatment are unmet clinical needs. Moreover, whether cHCC-ICC is a unique entity or a subtype of hepatocellular carcinoma (HCC) or intrahepatic cholangiocarcinoma (ICC) is a long-standing controversy. We provide a detailed genomic landscape of cHCC-ICC, perform a comprehensive comparison of cHCC-ICC with HCC and ICC, and reveal that the combined type cHCC-ICCs shows strong ICC-like features, whereas the mixed type cHCC-ICCs show HCC-like features. This finding may direct future therapeutic choices for cHCC-ICC patients. Importantly, we discover that Nestin expression can serve as a biomarker for the diagnosis and prognosis of cHCC-ICC and suggest that therapies targeting Nestin may provide opportunities for cHCC-ICC treatment.
ACKNOWLEDGMENTS
We thank Zhiqian Zhang from PKUCH, Lulu Sun, Hai Jiang, Gaoxiang Ge, and Lijian Hui from SIBS, and members of Prof. Charles Swanton’ lab for helpful discussions. We thank the super-computer system “Shirokane” in IMS, The University of Tokyo, and technical staff of the Laboratory for Cancer Genomics, RIKEN. We thank the following surgeons: Prof. Alex Chung, Prof. London Ooi, Prof. Pierce Chow, A\P Cheow Peng Chung, Dr. Tan Yu-Meng, Dr. Masaki Ueno, and Prof. Hiroki Yamaue. B.T.T. is supported by the NCC Research Fund of Singapore (NCCRF-YR2014-Jan-PG2). R.X. is supported by the Scientific Research Seed Fund of PKUFH (2018SF039). H.N. is supported by a JSPS KAKENHI Grant-in-Aid for Scientific Research A (18H04049). F.B. is supported by the National Key Research and Development Program (2016YFC0900102) and National Science and Technology Major Project (2018ZX10302205). F.B. and M.S.Z. are also supported by the Guangdong Province Key Research and Development Program (2019B020226002). This work is also supported by multiple grants from the National Natural Science Foundation of China (81802813 to R.X.; 81520108022, 81830090 to M.S.Z.; 81661128009, 31671421, and 81472683 to N.Z.).
Footnotes
DECLARATION OF INTERESTS
The authors declare no competing interests.
SUPPLEMENTAL INFORMATION
Supplemental Information can be found online at https://doi.org/10.1016/j.ccell.2019.04.007.
REFERENCES
- Alexandrov LB, Nik-Zainal S, Wedge DC, Aparicio SA, Behjati S,Biankin AV, Bignell GR, Bolli N, Borg A, Borresen-Dale AL, et al. (2013). Signatures of mutational processes in human cancer. Nature 500, 415–421. [DOI] [PMC free article] [PubMed] [Google Scholar]
- Allen RA, and Lisa JR (1949). Combined liver cell and bile duct carcinoma. Am. J. Pathol 25, 647–655. [PMC free article] [PubMed] [Google Scholar]
- Andersen JB, Spee B, Blechacz BR, Avital I, Komuta M, Barbour A, Conner EA, Gillen MC, Roskams T, Roberts LR, et al. (2012). Genomic and genetic characterization of cholangiocarcinoma identifies therapeutic targets for tyrosine kinase inhibitors. Gastroenterology 142, 1021–1031. [DOI] [PMC free article] [PubMed] [Google Scholar]
- Baslan T, Kendall J, Rodgers L, Cox H, Riggs M, Stepansky A, Troge J, Ravi K, Esposito D, Lakshmi B, et al. (2012). Genome-wide copy number analysis of single cells. Nat. Protoc 7, 1024–1041. [DOI] [PMC free article] [PubMed] [Google Scholar]
- Bray F, Ferlay J, Soerjomataram I, Siegel RL, Torre LA, and Jemal A (2018). Global cancer statistics 2018: GLOBOCAN estimates of incidence and mortality worldwide for 36 cancers in 185 countries. CA Cancer J. Clin 68, 394–424. [DOI] [PubMed] [Google Scholar]
- Cazals-Hatem D, Rebouissou S, Bioulac-Sage P, Bluteau O, Blanche H, Franco D, Monges G, Belghiti J, Sa Cunha A, Laurent-Puig P, et al. (2004). Clinical and molecular analysis of combined hepatocellular-cholangiocarcinomas. J. Hepatol 41, 292–298. [DOI] [PubMed] [Google Scholar]
- Chaisaingmongkol J, Budhu A, Dang H, Rabibhadana S, Pupacdi B, Kwon SM, Forgues M, Pomyen Y, Bhudhisawasdi V, Lertprasertsuke N, et al. (2017). Common molecular subtypes among Asian hepatocellular carcinoma and cholangiocarcinoma. Cancer Cell 32, 57–70. [DOI] [PMC free article] [PubMed] [Google Scholar]
- Chiang DY, Villanueva A, Hoshida Y, Peix J, Newell P, Minguez B, LeBlanc AC, Donovan DJ, Thung SN, Sole M, et al. (2008). Focal gains of VEGFA and molecular classification of hepatocellular carcinoma. Cancer Res. 68, 6779–6788. [DOI] [PMC free article] [PubMed] [Google Scholar]
- Cibulskis K, Lawrence MS, Carter SL, Sivachenko A, Jaffe D, Sougnez C, Gabriel S, Meyerson M, Lander ES, and Getz G (2013). Sensitive detection of somatic point mutations in impure and heterogeneous cancer samples. Nat Biotechnol 31, 213–219. [DOI] [PMC free article] [PubMed] [Google Scholar]
- Cingolani P, Platts A, Wang le L, Coon M, Nguyen T, Wang L, Land SJ, Lu X, and Ruden DM (2012). A program for annotating and predicting the effects of single nucleotide polymorphisms, SnpEff: SNPs in the genome of Drosophila melanogaster strain w1118; iso-2; iso-3. Fly (Austin) 6, 80–92. [DOI] [PMC free article] [PubMed] [Google Scholar]
- Connell LC, Harding JJ, Shia J, and Abou-Alfa GK (2016). Combined intrahepatic cholangiocarcinoma and hepatocellular carcinoma. Chin. Clin. Oncol 5, 66. [DOI] [PubMed] [Google Scholar]
- Dobin A, Davis CA, Schlesinger F, Drenkow J, Zaleski C, Jha S, Batut P, Chaisson M, and Gingeras TR (2013). STAR: ultrafast universal RNA-seq aligner. Bioinformatics 29, 15–21. [DOI] [PMC free article] [PubMed] [Google Scholar]
- Edge SB, and Compton CC (2010). The American Joint Committee on Cancer: the 7th edition of the AJCC cancer staging manual and the future of TNM. Ann. Surg. Oncol 17, 1471–1474. [DOI] [PubMed] [Google Scholar]
- Farshidfar F, Zheng S, Gingras MC, Newton Y, Shih J, Robertson AG, Hinoue T, Hoadley KA, Gibb EA, Roszik J, et al. (2017). Integrative genomic analysis of cholangiocarcinoma identifies distinct IDH-mutant molecular profiles. Cell Rep. 18, 2780–2794. [DOI] [PMC free article] [PubMed] [Google Scholar]
- Favero F, Joshi T, Marquard AM, Birkbak NJ, Krzystanek M, Li Q, Szallasi Z, and Eklund AC (2015). Sequenza: allele-specific copy number and mutation profiles from tumor sequencing data. Ann. Oncol 26, 64–70. [DOI] [PMC free article] [PubMed] [Google Scholar]
- Fujii H, Zhu XG, Matsumoto T, Inagaki M, Tokusashi Y, Miyokawa N, Fukusato T, Uekusa T, Takagaki T, Kadowaki N, et al. (2000). Genetic classification of combined hepatocellular-cholangiocarcinoma. Hum. Pathol 31, 1011–1017. [DOI] [PubMed] [Google Scholar]
- Fujimoto A, Furuta M, Totoki Y, Tsunoda T, Kato M, Shiraishi Y, Tanaka H, Taniguchi H, Kawakami Y, Ueno M, et al. (2016). Whole-genome mutational landscape and characterization of noncoding and structural mutations in liver cancer. Nat. Genet 48, 500–509. [DOI] [PubMed] [Google Scholar]
- Gao R, Davis A, McDonald TO, Sei E, Shi X, Wang Y, Tsai PC, Casasent A, Waters J, Zhang H, et al. (2016). Punctuated copy number evolution and clonal stasis in triple-negative breast cancer. Nat. Genet 48, 1119–1130. [DOI] [PMC free article] [PubMed] [Google Scholar]
- Gleiberman AS, Encinas JM, Mignone JL, Michurina T, Rosenfeld MG, and Enikolopov G (2005). Expression of nestin-green fluorescent protein transgene marks oval cells in the adult liver. Dev. Dyn 234, 413–421. [DOI] [PMC free article] [PubMed] [Google Scholar]
- Gundem G, Van Loo P, Kremeyer B, Alexandrov LB, Tubio JM, Papaemmanuil E, Brewer DS, Kallio HM, Hognas G, Annala M, et al. (2015). The evolutionary history of lethal metastatic prostate cancer. Nature 520, 353–357. [DOI] [PMC free article] [PubMed] [Google Scholar]
- Hanahan D, and Weinberg RA (2011). Hallmarks of cancer: the next generation. Cell 144, 646–674. [DOI] [PubMed] [Google Scholar]
- Hoshida Y, Nijman SM, Kobayashi M, Chan JA, Brunet JP, Chiang DY, Villanueva A, Newell P, Ikeda K, Hashimoto M, et al. (2009). Integrative transcriptome analysis reveals common molecular subclasses of human hepatocellular carcinoma. Cancer Res. 69, 7385–7392. [DOI] [PMC free article] [PubMed] [Google Scholar]
- Jarnagin WR, Weber S, Tickoo SK, Koea JB, Obiekwe S, Fong Y, DeMatteo RP, Blumgart LH, and Klimstra D (2002). Combined hepatocellular and cholangiocarcinoma: demographic, clinical, and prognostic factors. Cancer 94, 2040–2046. [DOI] [PubMed] [Google Scholar]
- Jusakul A, Cutcutache I, Yong CH, Lim JQ, Huang MN, Padmanabhan N, Nellore V, Kongpetch S, Ng AWT, Ng LM, et al. (2017). Whole-genome and epigenomic landscapes of etiologically distinct subtypes of cholangiocarcinoma. Cancer Discov. 7, 1116–1135. [DOI] [PMC free article] [PubMed] [Google Scholar]
- Kan Z, Zheng H, Liu X, Li S, Barber TD, Gong Z, Gao H, Hao K, Willard MD, Xu J, et al. (2013). Whole-genome sequencing identifies recurrent mutations in hepatocellular carcinoma. Genome Res. 23, 1422–1433. [DOI] [PMC free article] [PubMed] [Google Scholar]
- Katz SF, Lechel A, Obenauf AC, Begus-Nahrmann Y, Kraus JM, Hoffmann EM, Duda J, Eshraghi P, Hartmann D, Liss B, et al. (2012). Disruption of Trp53 in livers of mice induces formation of carcinomas with bilineal differentiation. Gastroenterology 142, 1229–1239. [DOI] [PubMed] [Google Scholar]
- Lawrence MS, Stojanov P, Polak P, Kryukov GV, Cibulskis K, Sivachenko A, Carter SL, Stewart C, Mermel CH, Roberts SA, et al. (2013). Mutational heterogeneity in cancer and the search for new cancer-associated genes. Nature 499, 214–218. [DOI] [PMC free article] [PubMed] [Google Scholar]
- Lee J-H, Chung GE, Yu SJ, Hwang SY, Kim JS, Kim HY, Yoon J-H, Lee H-S, Yi N-J, Suh K-S, et al. (2011). Long-term prognosis of combined hepatocellular and cholangiocarcinoma after curative resection comparison with hepatocellular carcinoma and cholangiocarcinoma. J. Clin. Gastroenterol 45, 69–75. [DOI] [PubMed] [Google Scholar]
- Li H, and Durbin R (2009). Fast and accurate short read alignment with Burrows-Wheeler Transform. Bioinformatics 25, 1754–1760. [DOI] [PMC free article] [PubMed] [Google Scholar]
- Li H, Handsaker B, Wysoker A, Fennell T, Ruan J, Homer N, Marth G, Abecasis G, Durbin R, and Proc GPD (2009). The sequence alignment/map format and SAMtools. Bioinformatics 25, 2078–2079. [DOI] [PMC free article] [PubMed] [Google Scholar]
- Liao Y, Smyth GK, and Shi W (2014). FeatureCounts: an efficient general purpose program for assigning sequence reads to genomic features. Bioinformatics 30, 923–930. [DOI] [PubMed] [Google Scholar]
- Love MI, Huber W, and Anders S (2014). Moderated estimation of fold change and dispersion for RNA-seq data with DESeq2. Genome Biol. 15, 550. [DOI] [PMC free article] [PubMed] [Google Scholar]
- Maeda T, Adachi E, Kajiyama K, Sugimachi K, and Tsuneyoshi M (1995). Combined hepatocellular and cholangiocarcinoma: proposed criteria according to cytokeratin expression and analysis of clinicopathologic features. Hum. Pathol 26, 956–964. [DOI] [PubMed] [Google Scholar]
- Marquardt JU, Andersen JB, and Thorgeirsson SS (2015). Functional and genetic deconstruction of the cellular origin in liver cancer. Nat. Rev. Cancer 15, 653–667. [DOI] [PubMed] [Google Scholar]
- Martincorena I, Raine KM, Gerstung M, Dawson KJ, Haase K, Van Loo P, Davies H, Stratton MR, and Campbell PJ (2017). Universal patterns of selection in cancer and somatic tissues. Cell 171, 1029–1041. [DOI] [PMC free article] [PubMed] [Google Scholar]
- Maximin S, Ganeshan DM, Shanbhogue AK, Dighe MK, Yeh MM, Kolokythas O, Bhargava P, and Lalwani N (2014). Current update on combined hepatocellular-cholangiocarcinoma. Eur. J. Radiol. Open 1, 40–48. [DOI] [PMC free article] [PubMed] [Google Scholar]
- McKenna A, Hanna M, Banks E, Sivachenko A, Cibulskis K, Kernytsky A, Garimella K, Altshuler D, Gabriel S, Daly M, et al. (2010). The Genome Analysis Toolkit: a MapReduce framework for analyzing next-generation DNA sequencing data. Genome Res. 20, 1297–1303. [DOI] [PMC free article] [PubMed] [Google Scholar]
- Mermel CH, Schumacher SE, Hill B, Meyerson ML, Beroukhim R, and Getz G (2011). GISTIC2.0 facilitates sensitive and confident localization of the targets of focal somatic copy-number alteration in human cancers. Genome Biol. 12, R41. [DOI] [PMC free article] [PubMed] [Google Scholar]
- Moeini A, Sia D, Zhang ZY, Camprecios G, Stueck A, Dong H, Montal R, Torrens L, Martinez-Quetglas I, Fiel MI, et al. (2017). Mixed hepatocellular cholangiocarcinoma tumors: cholangiolocellular carcinoma is a distinct molecular entity. J. Hepatol 66, 952–961. [DOI] [PubMed] [Google Scholar]
- Nakamura H, Arai Y, Totoki Y, Shirota T, Elzawahry A, Kato M, Hama N, Hosoda F, Urushidate T, Ohashi S, et al. (2015). Genomic spectra of biliary tract cancer. Nat. Genet 47, 1003–1010. [DOI] [PubMed] [Google Scholar]
- Navin N, Kendall J, Troge J, Andrews P, Rodgers L, McIndoo J, Cook K, Stepansky A, Levy D, Esposito D, et al. (2011). Tumour evolution inferred by single-cell sequencing. Nature 472, 90–94. [DOI] [PMC free article] [PubMed] [Google Scholar]
- Ng AWT, Poon SL, Huang MN, Lim JQ, Boot A, Yu W, Suzuki Y, Thangaraju S, Ng CCY, Tan P, et al. (2017). Aristolochic acids and their derivatives are widely implicated in liver cancers in Taiwan and throughout Asia. Sci. Transl. Med 9. [DOI] [PubMed] [Google Scholar]
- Nik-Zainal S, Van Loo P, Wedge DC, Alexandrov LB, Greenman CD, Lau KW, Raine K, Jones D, Marshall J, Ramakrishna M, et al. (2012). The life history of 21 breast cancers. Cell 149, 994–1007. [DOI] [PMC free article] [PubMed] [Google Scholar]
- Rosenthal R, McGranahan N, Herrero J, Taylor BS, and Swanton C (2016). DeconstructSigs: delineating mutational processes in single tumors distinguishes DNA repair deficiencies and patterns of carcinoma evolution. Genome Biol. 17, 31. [DOI] [PMC free article] [PubMed] [Google Scholar]
- Roth A, Khattra J, Yap D, Wan A, Laks E, Biele J, Ha G, Aparicio S, Bouchard-Cote A, and Shah SP (2014). PyClone: statistical inference of clonal population structure in cancer. Nat. Methods 11, 396–398. [DOI] [PMC free article] [PubMed] [Google Scholar]
- Scheinin I, Sie D, Bengtsson H, van de Wiel MA, Olshen AB, van Thuijl HF, van Essen HF, Eijk PP, Rustenburg F, Meijer GA, et al. (2014). DNA copy number analysis of fresh and formalin-fixed specimens by shallow whole-genome sequencing with identification and exclusion of problematic regions in the genome assembly. Genome Res. 24, 2022–2032. [DOI] [PMC free article] [PubMed] [Google Scholar]
- Schulze K, Imbeaud S, Letouze E, Alexandrov LB, Calderaro J, Rebouissou S, Couchy G, Meiller C, Shinde J, Soysouvanh F, et al. (2015). Exome sequencing of hepatocellular carcinomas identifies new mutational signatures and potential therapeutic targets. Nat. Genet 47, 505–511. [DOI] [PMC free article] [PubMed] [Google Scholar]
- Shiraishi Y, Sato Y, Chiba K, Okuno Y, Nagata Y, Yoshida K, Shiba N, Hayashi Y, Kume H, Homma Y, et al. (2013). An empirical Bayesian framework for somatic mutation detection from cancer genome sequencing data. Nucleic Acids Res. 41, e89. [DOI] [PMC free article] [PubMed] [Google Scholar]
- Subramanian A, Tamayo P, Mootha VK, Mukherjee S, Ebert BL, Gillette MA, Paulovich A, Pomeroy SL, Golub TR, Lander ES, et al. (2005). Gene set enrichment analysis: a knowledge-based approach for interpreting genome-wide expression profiles. Proc. Natl. Acad. Sci. U S A 102, 15545–15550. [DOI] [PMC free article] [PubMed] [Google Scholar]
- Talevich E, Shain AH, Botton T, and Bastian BC (2016). CNVkit: genome-wide copy number detection and visualization from targeted DNA sequencing. PLoS Comput. Biol 12, e1004873. [DOI] [PMC free article] [PubMed] [Google Scholar]
- Tamura K, Peterson D, Peterson N, Stecher G, Nei M, and Kumar S (2011). MEGA5: molecular evolutionary genetics analysis using maximum likelihood, evolutionary distance, and maximum parsimony methods. Mol. Biol. Evol 28, 2731–2739. [DOI] [PMC free article] [PubMed] [Google Scholar]
- TCGA. (2017). Comprehensive and integrative genomic characterization of hepatocellular carcinoma. Cell 169, 1327–1341. [DOI] [PMC free article] [PubMed] [Google Scholar]
- Totoki Y, Tatsuno K, Covington KR, Ueda H, Creighton CJ, Kato M, Tsuji S, Donehower LA, Slagle BL, Nakamura H, et al. (2014). Trans-ancestry mutational landscape of hepatocellular carcinoma genomes. Nat. Genet 46, 1267–1273. [DOI] [PubMed] [Google Scholar]
- Tschaharganeh DF, Xue W, Calvisi DF, Evert M, Michurina TV, Dow LE, Banito A, Katz SF, Kastenhuber ER, Weissmueller S, et al. (2014). p53-dependent Nestin regulation links tumor suppression to cellular plasticity in liver cancer. Cell 158, 579–592. [DOI] [PMC free article] [PubMed] [Google Scholar]
- Venkatraman ES, and Olshen AB (2007). A faster circular binary segmentation algorithm for the analysis of array CGH data. Bioinformatics 23, 657–663. [DOI] [PubMed] [Google Scholar]
- Wang A, Wu L, Lin J, Han L, Bian J, Wu Y, Robson SC, Xue L, Ge Y, Sang X, et al. (2018). Whole-exome sequencing reveals the origin and evolution of hepato-cholangiocarcinoma. Nat. Commun 9, 894. [DOI] [PMC free article] [PubMed] [Google Scholar]
- Wang K, Li M, and Hakonarson H (2010). ANNOVAR: functional annotation of genetic variants from high-throughput sequencing data. Nucleic Acids Res. 38, e164. [DOI] [PMC free article] [PubMed] [Google Scholar]
- Wardell CP, Fujita M, Yamada T, Simbolo M, Fassan M, Karlic R, Polak P, Kim J, Hatanaka Y, Maejima K, et al. (2018). Genomic characterization of biliary tract cancers identifies driver genes and predisposing mutations. J. Hepatol 68, 959–969. [DOI] [PubMed] [Google Scholar]
- Willenbrock H, and Fridlyand J (2005). A comparison study: applying segmentation to array CGH data for downstream analyses. Bioinformatics 21, 4084–4091. [DOI] [PubMed] [Google Scholar]
- Xue R, Li J, Bai F, Wang X, Ji J, and Lu Y (2017). A race to uncover a panoramic view of primary liver cancer. Cancer Biol. Med 14, 335–340. [DOI] [PMC free article] [PubMed] [Google Scholar]
- Xue R, Li R, Guo H, Guo L, Su Z, Ni X, Qi L, Zhang T, Li Q, Zhang Z, et al. (2016). Variable intra-tumor genomic heterogeneity of multiple lesions in patients with hepatocellular carcinoma. Gastroenterology 150, 998–1008. [DOI] [PubMed] [Google Scholar]
- Yano Y, Yamamoto J, Kosuge T, Sakamoto Y, Yamasaki S, Shimada K, Ojima H, Sakamoto M, Takayama T, and Makuuchi M (2003). Combined hepatocellular and cholangiocarcinoma: a clinicopathologic study of 26 resected cases. Jpn. J. Clin. Oncol 33, 283–287. [DOI] [PubMed] [Google Scholar]
- Zhao Q, Yu WL, Lu XY, Dong H, Gu YJ, Sheng X, Cong WM, and Wu MC (2016). Combined hepatocellular and cholangiocarcinoma originating from the same clone: a pathomolecular evidence-based study. Chin. J. Cancer 35, 82. [DOI] [PMC free article] [PubMed] [Google Scholar]
- Zong C, Lu S, Chapman AR, and Xie XS (2012). Genome-wide detection of single-nucleotide and copy-number variations of a single human cell. Science 338, 1622–1626. [DOI] [PMC free article] [PubMed] [Google Scholar]
- Zuo HQ, Yan LN, Zeng Y, Yang JY, Luo HZ, Liu JW, and Zhou LX (2007). Clinicopathological characteristics of 15 patients with combined hepatocellular carcinoma and cholangiocarcinoma. Hepatobiliary Pancreat Dis Int 6, 161–165. [PubMed] [Google Scholar]
- Zou S, Li J, Zhou H, Frech C, Jiang X, Chu JS, Zhao X, Li Y, Li Q, Wang H, et al. (2014). Mutational landscape of intrahepatic cholangiocarcinoma. Nat. Commun 5, 5696. [DOI] [PubMed] [Google Scholar]
- Zucman-Rossi J, Villanueva A, Nault JC, and Llovet JM (2015). Genetic landscape and biomarkers of hepatocellular carcinoma. Gastroenterology 149, 1226–1239. [DOI] [PubMed] [Google Scholar]
Associated Data
This section collects any data citations, data availability statements, or supplementary materials included in this article.
Supplementary Materials
Data Availability Statement
The accession number for the sequencing data_reported in this paper is EGA: EGAS00001003093. Software used in this study are noted in the Method Details section above and the Key Resources Table.
KEY RESOURCES TABLE
| REAGENT or RESOURCE | SOURCE | IDENTIFIER |
|---|---|---|
| Antibodies | ||
| Anti-Cytokeratin 19 | Abcam | Cat# ab52625; RRID: AB_2281020 |
| AFP antibody | Proteintech | Cat# 14550-1-AP; RRID: AB_2223933 |
| Anti-Glypican 3 | Abcam | Cat# ab66596; RRID: AB_1141042 |
| Anti-Hepatocyte Specific Antigen | Abcam | Cat# ab75677; RRID: AB_1523754 |
| Anti-Cytokeratin 7 | Abcam | Cat# ab181598; RRID: AB_278382 |
| Nestin antibody | Santa Cruz Biotechnology | Cat# sc-23927; RRID: AB_627994 |
| Goat anti-Mouse secondary antibody | Abcam | Cat#ab6789; RRID: AB_955439 |
| Goat anti-Rabbit secondary antibody | Abcam | Cat#ab6721; RRID: AB_955447 |
| Biological Samples | ||
| Tumor, adjacent non-cancerous liver tissues and blood samples from patients diagnosed with cHCC-ICC | This paper | This paper (PKU_cHCC-ICC) |
| Critical Commercial Assays | ||
| PEN Membraneslide | Leica | Cat#11505158 |
| DNeasy Blood & Tissue Kit | Qiagen | Cat#69504 |
| GeneRead DNA FFPE Kit | Qiagen | Cat#180134 |
| QIAamp DNA Micro Kit | Qiagen | Cat#56304 |
| RNeasy Mini Kit | Qiagen | Cat#74106 |
| AllPrep DNA/RNA Micro Kit | Qiagen | Cat#80284 |
| NEBNext Ultra DNA Library Prep Kit for Illumina | New England Biolabs | Cat#E7645L |
| SureSelect All Exon V6 | Agilent Technologies | Cat#5190-8864 |
| NEBNext Ultra RNA Library Prep Kit for Illumina | New England Biolabs | Cat#E7530L |
| Deposited Data | ||
| cHCC-ICC WES data | This paper | EGA: EGAS00001003093 |
| cHCC-ICC WGS data | This paper | EGA: EGAS00001003093 |
| cHCC-ICC RNA-seq data | This paper | EGA: EGAS00001003093 |
| TCGA LIHC data | TCGA, 2017 | https://gdc.cancer.gov/ |
| TCGA CHOL data | Farshidfar et al., 2017 | https://gdc.cancer.gov/ |
| ICGC HCC data | Fujimoto et al., 2016 | https://dcc.icgc.org/ |
| ICGC CCA data | Jusakul et al., 2017 | https://dcc.icgc.org/ |
| Oligonucleotides | ||
| Primer1 for TERT promoter, Forward GCAGCACCTCGCGGTAGTGGCTG | This paper | N/A |
| Primer1 for TERT promoter, Reverse GCCGATTCGACCTCTCTCCGCTGGCC | This paper | N/A |
| Primer2 for TERT promoter, Forward CAGCGCTGCCTGAAACTCGC | This paper | N/A |
| Primer2 for TERT promoter, Reverse TGGCGTCCCTGCACCCTGG | This paper | N/A |
| Primers for mutation validation of single nucleus, see Table S5 | This paper | N/A |
| Software and Algorithms | ||
| BWA | Li et al., 2009 | http://bio-bwa.sourceforge.net/ |
| Samtools v0.1.19 | Li et al., 2009 | http://samtools.sourceforge.net/ |
| GATK v2.1–8 | McKenna et al., 2010 | https://software.broadinstitute.org/gatk/ |
| Mutect v1.1.4 | Cibulskis et al., 2013 | https://software.broadinstitute.org/cancer/cga/mutect |
| SnpEff 4.0 | Cingolani et al., 2012 | http://snpeff.sourceforge.net/about.html |
| Genomon | N/A | https://genomon-project.github.io/GenomonPages/ |
| EBCall | Shiraishi et al., 2013 | https://github.com/friend1ws/EBCall |
| ANNOVAR | Wang et al., 2010 | http://annovar.openbioinformatics.org/en/latest/user-guide/download/ |
| MutSigCV 1.4 | Lawrence et al., 2013 | https://software.broadinstitute.org/cancer/cga/mutsig_download |
| dNdScv | Martincorena et al. (2017) | https://github.com/im3sanger/dndscv |
| SigProfiler Mutational Signatures | Alexandrov et al., 2013 | https://ww2.mathworks.cn/matlabcentral/fileexchange/38724-sigprofiler |
| deConstructSigs | Rosenthal et al., 2016 | https://github.com/raerose01/deconstructSigs |
| mSigAct | Ng et al., 2017 | https://stm.sciencemag.org/content/suppl/2017/10/16/9.412.eaan6446.DC1 |
| MEGA5 | Tamura et al., 2011 | https://www.megasoftware.net/download_form |
| PyClone | Roth et al., 2014 | https://github.com/aroth85/pyclone |
| DNAcopy | Venkatraman et al., 2007 | https://bioconductor.org/packages/release/bioc/html/DNAcopy.html |
| Sequenza v2.1.1 | Favero et al., 2015 | http://www.cbs.dtu.dk/biotools/sequenza/ |
| CNVkit v0.9.2 | Talevich et al., 2016 | https://cnvkit.readthedocs.io/en/stable/ |
| GISTIC v2.0.23 | Mermel et al., 2011 | https://software.broadinstitute.org/cancer/cga/gistic |
| STAR | Dobin et al., 2013 | https://github.com/alexdobin/STAR |
| DESeq2 v1.22.2 | Love et al., 2014 | http://bioconductor.org/packages/release/bioc/html/DESeq.html |
| Gene Set Enrichment Analysis (GSEA) v3.0 | Subramanian et al., 2005 | http://software.broadinstitute.org/cancer/software/genepattern/ |
| pheatmap | N/A | https://www.rdocumentation.org/packages/pheatmap/versions/1.0.2 |
| survminer v0.4.3 | N/A | https://cran.r-project.org/web/packages/survminer/index.html |
| Chromas v2.3 | N/A | www.technelysium.com.au |
| Graphpad Prism7 | N/A | https://www.graphpad.com/ |
| Rstudio v3.5.1 | N/A | https://www.rstudio.com/products/rstudio/ |