

Abstract
Few articles are reported for the simultaneous separation and sensitive detection of the kynurenine pathway (KP) metabolites. This work describes a capillary electrochromatography-mass spectrometry (CEC-MS) method using acrylamido-2-methyl-1-propanesulfonic acid (AMPS) functionalized stationary phase. The AMPS column was prepared by first performing silanization of bare silica with gamma-maps, followed by polymerization with AMPS. The CEC-MS/MS methods were established for six upstream and three downstream KP metabolites. The simultaneous separation of all nine KP metabolites is achieved without derivatization for the first time in the open literature. Numerous parameters such as pH and the concentration of background electrolyte, the concentration of the polymerizable AMPS monomer, column length, field strength, and internal pressure were all tested to optimize the separation of multiple KP metabolites. A baseline separation of six upstream metabolites, namely tryptophan (TRP), kynurenine (KYN), 3-hydroxykynurenine (HKYN), kynurenic acid (KA), anthranilic acid (AA), and xanthurenic acid (XA), was possible at pH 9.25 within 26 min. Separation of six downstream and related metabolites, namely: tryptamine (TRPM), hydroxy–tryptophan (HTRP), hydroxyindole-3 acetic acid (HIAA), 3-hydroxyanthranilic acid (3-HAA), picolinic acid (PA), and quinolinic acid (QA), was achieved at pH 9.75 in 30 min. However, the challenging simultaneous separation of all nine KP metabolites was only accomplished by increasing the column length and simultaneous application of internal pressure and voltage in 114 min. Quantitation of KP metabolites in commercial human plasma was carried out, and endogenous concentration of five KP metabolites was validated. The experimental limit of quantitation ranges from 100 to 10,000 nM (S/N = 8–832, respectively), whereas the experimental limit of detection ranges from 31 to 1000 nM (S/N = 2–16, respectively). Levels of five major KP metabolites, namely TRP, KYN, KA, AA, and QA, and their ratios in patient plasma samples previously screened for inflammatory biomarkers [C-reactive protein (CRP) and tumor necrosis factor-alpha (TNF-α)] was measured. Pairs of the level of metabolites with significant positive correlation were statistically evaluated.
Keywords: Nine kynurenine pathway metabolites, Capillary electrochromatography-mass spectrometry, Simultaneous separation, Endogenous plasma quantitation, Standard addition-internal standard, Low vs. high inflammation
1. Introduction
The kynurenine pathway (KP), which starts with the degradation of the essential amino acid tryptophan (TRP), leads to the end product metabolites picolinic acid (PA) and quinolinic acid (QA) (Fig. 1). Three enzymes, namely TRP-2,3-dioxygenase (TDO), indoleamine-2,3-dioxygenase-1 (IDO-1) and IDO-2 are reported to catabolize TRP into kynurenine (KYN) [1–3]. Depending on the enzymes, [kynurenine-3-monoxygenase (KMO), kynureninase (KNU), and kynurenine aminotransferases (KAT I-IV)], KYN can be metabolized along three different branches (KMO, KYNU, and KAT) of the pathway [4]. First, through the KMO pathway, KYN is converted to 3-hydroxykynurenine (3-HK), which itself is further degraded to 3-hydroxyanthranilic acid (3-HAA). Active intermediate anthranilic acid (AA) is the second branch’s product involving the enzyme KYNU [5]. The metabolite AA is further catabolized to 3-HAA [6]. The KAT I-IV initiates the conversion of KYN to kynurenic acid (KA) [7–12]. Another substrate for KATs is 3-HKYN, which leads to the generation of neurotransmitter xanthurenic acid (XA) [1]. Generated through two independent pathways, 3-HAA is further metabolized into quinolinic acid (QA) and picolinic acid (PA) as end-product metabolites. It is now well-known that QA can cause excitotoxicity, whereas PA is assumed to be neuroprotective [13,14].
Fig. 1.

Schematic of tryptophan (TRP) metabolism via the kynurenine pathway (KP).
The KP disruptions are associated with cancer, AIDS dementia complex, Huntington’s disease, and several neurogenerative disorders (Alzheimer’s disease, amyotrophic lateral sclerosis, depression, and schizophrenia) [15–18]. Measurement of KP metabolite concentrations as a biomarker will help expound KP significance in the disease pathology and potential drug development. Thus, there is a need to develop an accurate assay to profile and quantitate all of these metabolites mentioned above in biological specimens (plasma, serum, cerebrospinal fluid, urine).
Gas chromatography hyphenated to mass spectrometry (GC–MS) is reported in the literature for separating KP metabolites [19,20]. For GC–MS, the sample must be volatile, and it is challenging to obtain thermal stability without derivatization. However, during derivatization, sample contamination and alteration of the metabolite stability is always a risk, and the procedure is time-consuming [21]. Multiple high-performance liquid chromatography (HPLC) methods for qualitative and quantitative analysis are described with different types of detectors such as UV–Vis, fluorescence, electrochemical [22–25], and MS detection [26–30]. Although HPLC and HPLC-MS can be used without derivatization, the KP metabolites, particularly PA and QA, are weakly retained on a C-18 reversed-phase column., Besides, the use of a hydrophilic interaction chromatography column can cause severe peak tailing. The solvent gradient could solve the peak tailing issues, but the poor retention of PA and QA remains a challenge in HPLC and HPLC-MS.
Capillary electrophoresis (CE) has been evolved as a complementary analytical technique to conventional HPLC [31–34]. The hyphenation of capillary zone electrophoresis (CZE) to electrospray ionization mass spectrometry (ESI-MS) offers peak identification and high throughput in biological samples. Moreover, ESI-MS can provide high detection sensitivity and high specificity [35,36] using single ion monitoring (SIM) or multiple reaction monitoring (MRM). There are numerous advantages of CE-MS compared to HPLC-MS for the analysis of KP metabolites. These include nanoliter injection volume of biospecimen, cost-effectiveness (as low amount of solvent and low-cost capillaries) produces less waste. In addition to the advantages mentioned above, the greenness of the CE-MS makes the technique consistent with the safety standards set by the National Environmental Method Index. Another advantage of CE-MS over HPLC–MS or GC–MS is the superior capability of the former hyphenation technique to analyze a wide range of small polar and charged metabolites [37].
Several CZE methods with UV [38,39] detection are reported besides a few electrochemical and ESI-MS detection for separation of KP metabolites [40,41]. The shortcomings of both CZE and CZE-MS using bare fused silica (BFS) column is the high relative standard deviation (%RSD) of migration time and peak area, which is a critical issue in the quantitation of biological samples. The open tubular capillary electrochromatography (OT-CEC) based on chemically modified covalently bonded columns is a promising approach to minimize the variability of migration time and peak area. Compared to the packed capillary, the use of OT-CEC columns [42] requires no ‘tedious packing of particles and frit fabrication. Unlike the monolithic capillary preparation where the precise proportion of monomer to crosslinker or monomer to porogen(s) ratios is needed, the preparation of covalent bonded OT-CEC column is facile, providing extended lifetime and superior repeatability to CEC-ESI-MS analysis.
In this research, a chemically bonded sulfonated capillary was prepared to develop a CEC-MS assay for the separation and quantitation of KP metabolites. First, a flow injection mass spectrometry was used to optimize the fragmentor voltage and collision energy for MRM transitions. The separation of six upstream KP metabolites, three downstream and three related KP metabolites, as well as simultaneous separation of all nine KP metabolites, was optimized. The separation of these mixtures was obtained by varying pH, the volatile background electrolyte (BGE) and the polymerizable monomer concentrations, column length, applied voltage, and the internal pressure. After method validation was tested, the KP metabolites quantitation in commercial human plasma samples allowed determination of endogenous concentration. The established method was applied to the quantitation of five KP metabolites (TRP, KYN, AA, KA, and QA) in plasma samples (collected at time t1 and t2), consists of two groups of eleven low and six high inflammatory patients undergoing treatment for depression.
2. Materials and methods
2.1. Chemicals and reagents
All chemicals were reagent grade or ACS grade. Anhydrous methanol (MeOH), 3-(trimethoxysilyl) propyl methacrylate (γ-MAPS) 98%, 2,2′-azobis (2-methyl-propionitrile) (AIBN) 98%, 2-acrylamido-2-methyl-1-propanesulfonic acid (AMPS) 99%, thiourea (TH) 99%, tryptamine (TRM) 98%, ammonium carbonate ((NH4)2CO3), quinolinic acid (QA) 99%, picolinic acid (PA)>99.5%, anthranilic acid (AA) ≥98%, 3-hydroxyanthranilic acid (HAA) 97%, L-tryptophan (TRP) ≥98%, 5–hydroxy-L-tryptophan (HTP), L-kynurenine (KYN) ≥98%, 3–hydroxy-DL-kynurenine (HKYN), kynurenic acid (KA) ≥98%, xanthurenic acid (XA) 96%, L-tyrosine (TYR) +99%, and healthy human plasma (solid form with 4% trisodium citrate as anticoagulant) were all purchased from Sigma–Aldrich (St. Louis, MO, USA). The deuterated isotopes of KP metabolites such as DL-tryptophan-d8 (TRP-d8) 99.4%, kynurenic-3,5,6,7,8-d5 acid (KA-d5) 99.2%, 2-picolinic-d4 (PA-d4) acid (PA-d4) 99.3%, quinolinic-4,5,6-d3 acid (QA-d3) 98% were purchased from CDN Isotopes (Pointe-Claire, Quebec, Canada). Anthranilic acid 15 N (AA-N15) 98+% was purchased from Cambridge Isotope Laboratories (Andover, MA, USA). Patient plasma samples (total thirty-four samples) were obtained from Dr. Andrew Miller’s lab at Emory University (Atlanta, GA, USA). The HPLC grade methanol (MeOH), formic acid (FA) ≥95%, and acetic acid (HOAc) 99.7% were obtained from Fisher Scientific (Springfield, NJ, USA). Ammonium hydroxide (NH4OH) was obtained from EMD Chemicals (Darmstadt, Germany). Water used in all experiments was triply deionized (TDI) and obtained from Barnstead Nanopure II water system (Barnstead International, Dubuque, IA, USA) cleaned through an “organic-free” cartridge followed by a 0.2 μm particle filter. The bare fused-silica (BFS) capillary (363 O.D., 50.2 μm I.D.) was obtained from Polymicro Technologies (Phoenix, AZ, USA).
2.2. Preparation of AMPS column
A schematic of the preparation of the covalent bonded AMPS capillary column is shown in Fig. 2. First, the BFS capillary was flushed under vacuum with TDI water, 1.0 M sodium hydroxide, water, 0.1 M hydrochloric acid, TDI water, and MeOH for 0.5, 3, 0.5, 0.5, 0.5, and 0.5 h, respectively. Next, the capillary inner wall’s silanization with γ-MAPS was performed as described elsewhere [42,43]. Briefly, 50/50 (v/v) γ-MAPS/-anhydrous MeOH solution was prepared by aliquoting 1000 μL of γ-MAPS and 1000 μL of methanol in a 4 mL glass vial. The above-pretreated capillary was flushed under a vacuum pressure of 62 cm Hg using the 50% γ-MAPS solution. The filled capillary was immediately sealed with rubber septa and kept at 60 °C for 20 h in a GC oven. The capillary was flushed under vacuum with 1500 μL anhydrous MeOH to flush out the unreacted monomers and crosslinkers dried by nitrogen gas at 60 °C for 3 h. Once silanization is complete, the reaction mixture consisting of charged monomers (20–150 mg AMPS), 10.0 mg AIBN, and 2.5 mL anhydrous MeOH taken in a 4 mL glass vial was vortexed and sonicated for around 10–20 min until a homogeneous solution was obtained. The pretreated capillary was filled with the aforementioned polymerization solution using the same vacuum pressure of 62 cm Hg for 30 min, sealed at both ends with rubber septa. It was kept at 60 °C for 24 h in the GC oven for polymerization. After removing the capillary from the oven, the capillary was rinsed with 1500 μL anhydrous MeOH to flush out the residual reagents. Finally, the capillary was dried by nitrogen gas at 60 °C for 3 h.
Fig. 2.

Schematic for the preparation of 2-acrylamide-2-methyl-1-propanesulfonic acid (AMPS) covalently bonded column.
2.3. Preparation of standards for method development
The stock solutions of TH, TRM, AA, HAA, TRP, HTP, KYN, HKYN, KA, XA, QA, and PA were prepared at 5 mM in TDI water. Six and nine components standard mixtures of KP metabolite were prepared by taking a specific aliquot of each standard stock solution and diluted with TDI water to the desired concentration.
2.4. Preparation of standard and internal standards for quantitation
Individual stock solutions of six KP metabolites (TRP, KYN, AA, KA, PA, and QA) and four IS (AA-N15, KA-d5, PA-d4, and QA-d3) at 4–6 mM were prepared in 80/20 ACN/H2O, respectively. The other two IS (TRP-d8, TYR) stocks were prepared at a similar concentration range but 75/25 ACN/H2O. Next, each KP standards and IS stock solution was aliquoted in separate vials and further diluted with 80/20 ACN/H2O [Fig. S1 (a), (c) and (e), top flow diagram]. The second diluted vials for each KP metabolite and IS served as a source to prepare six spike calibrants. Each calibrant contained a mixture of two metabolites, and two IS for the same pair of metabolites at various spiked concentrations [Fig. S1 (b), d and f, bottom flow diagram].
2.5. Preparation of calibration standards in the commercial plasma
Calibration curves for six metabolites was prepared in commercial plasma samples using a combination of standard addition and internal standard (SA+IS) method [44]. Co-ordination swapping between the concentration of added standard and the peak area ratio of analyte/IS was employed for data simplification, which allowed us to simply read from the graph the negative intercept to determine the unknown concentration (Fig. S2).
Plasma samples from healthy persons (used to spike the standard solution) were purchased in solid form and were stored at 4 °C. Each solid plasma sample provided in a glass vial by the manufacturer was first dissolved in 5 mL of TDI water using a vortex mixture for 0.5 min. The commercial plasma and 34 patient plasma samples were stored at −80 °C and thawed at room temperature for at least 30 min before use. Liquid-liquid extraction using Phree™ phospholipid removal cartridge (PRC) was carried out in four steps [Fig. S1 b, d, and f, bottom flow diagram]. First, 1% FA dissolved in 300 μL of ACN was aliquoted in the PRC tube. Second,100 μL of plasma and 50 μL of calibrator (containing a mixture of two standard metabolites and two respective IS) were added consecutively. For unspiked plasma (i.e., control and patient samples), the same two steps mentioned above were followed, except only 50 μL of the IS mixture was added instead of adding KP standard. Third, the PRC tubes were placed on the vortex assembly and vortexed at a lower speed for 5 min. Fourth, all the solution from the PRC tube was transferred to a 1.5 mL eppendorf tube. Finally, 210 μL of clear supernatant was quantitatively transferred using a micropipettor into a second 1.5 mL eppendorf tube. The second tube’s content was dried under vacuum (~10 inch Hg), and the residue was reconstituted with 70 μL of TDI water. A clear supernatant was obtained after reconstitution with TDI water, which was conveniently transferred into a 200 mL CE-MS cone vial for CEC-MS injection.
Laboratory assessments of human subjects
All procedures involving the human subjects from Emory University were a priori approved by the Emory Institutional Review Board and all subjects recruited at Emory University provided written informed consent.
2.6. Mobile phase and sheath liquid preparation
The mobile phase was prepared by dissolution of 15–25 mM (NH4)2CO3 salt in TDI water followed by pH adjustment with 14.8 M NH4OH for highly basic pH (9.0–10.0) or acidic, neutral, and lower basic pH (3.0–8.75) using 17.4 M CH3COOH (HOAc) with an Orion 420 A pH meter (Beverly, MA, USA). The sheath liquid was prepared by mixing TDI water with an appropriate volume ratio of MeOH [e.g., 80/20 (v/v) of MeOH/H2O containing 40 mM HOAc]. The mobile phase was prepared at various pH levels, and the sheath liquid filtered using 0.20 μm nylon membranes and degassed for 5 min before use.
2.7. CEC-ESI-MS/MS instrumentation
The CEC-ESI-MS/MS experiments were performed on an Agilent CE system 7100 interfaced to an Agilent 6410 series triple quadrupole mass spectrometer (Agilent Technologies, Palo Alto, CA). The sheath liquid was delivered using an Agilent 1100 series isocratic HPLC pump with a 1:100 splitter. Nitrogen was used as a nebulizing gas, drying gas as well as the collision gas. The Agilent MassHunter Workstation (software version B.08.00) was employed for simultaneous instrument control and data acquisition as well as for qualitative and quantitative analysis. The MassHunter Optimizer was used to optimize the data acquisition parameters automatically for the MRM mode. The selection of the best precursor and product ions, the optimization of the fragmentor voltage for each precursor ion, selecting the best product ions, and optimizing collision energy and fragmentor voltage values for each transition for the list of compounds specified in the method was automated by the software. The optimized parameters for KP and related metabolites and IS are listed in Table S1.
The CEC-ESI-MS/MS experiments were carried on four AMPS columns of desired lengths (62.2, 67.2, 77.2, 150 cm total length). All four columns were rinsed with the mobile phase for 35–40 min before the first injection. The columns were also flushed with the running buffer for 4 min after each CEC-MS run. Cathodic electroosmotic flow (EOF) was induced on the AMPS column by applying the desired voltage. In all cases, the capillary columns were subjected to a voltage ramp of 3 kV/s. The internal pressure of 100 mbar was typically applied to the columns during most CEC-MS runs (except when indicated). To ensure run-to-run repeatability, a fresh running buffer vial was always used for each run. Analytes were kept at 20 °C in the autosampler and injected hydrodynamically at the pressure of 5 mbar for 100 s (except when indicated). Unless otherwise stated, the following ESI-MS/MS conditions were used: sheath liquid, MeOH/H2O (80/20, v/v) containing 40 mM HOAc; sheath liquid flow rate, 5 μL/min; capillary voltage, +3500 V; drying gas flow rate, 5.0 L/min; drying gas temperature, 200 °C; nebulizer pressure, 7 psi; collision cell gas (N2) pressure was ~30 psi. The MRM in the positive ion mode was used for ESI-MS detection. Other mass spectrometric parameters such as fragmentor voltage, collision energy, and MRM transition are summarized in Table S1. The retention time, peak area, resolution (Rs), efficiency (N), noise level, and signal-to-noise (S/N) ratio was calculated by the Agilent MassHunter Workstation (version B.08.00). The details for intra-day and inter-day precision of retention time and peak area are compiled in Table S2.
Instrument Detection Limit (IDL) [45] is directly related to the standard deviation of the measured peak area responses of a standard of a replicate injection and a statistical confidence factor (tα) by:
Because RSD = SD/ Mean, IDL can be expressed in terms of a unit of concentration (molarity of standard) as follows:
When n < 30, then the one-sided Student t-distribution is used to obtain the confidence factor tα. In particular, the value of tα is obtained from the student t-test using n-1 as degrees of freedom, and tα is the probability that the measurement is more significant than zero. The details for intra-day and inter-day precision of IDL for KP metabolites are compiled in Table S3. An example calculation of IDL is provided in the supplementary section (Table S3, inset box C).
3. Results and discussion
3.1. Method development
To develop the qualitative separation and quantitative determination of KP metabolites by CEC-MS/MS, experiments were first carried out to obtain the optimized MRM transition parameters for the KP metabolites as well as IS. Next, using the best pH and concentration of the BGE [(NH4)2CO3], the concentration of AMPS monomer required to prepare bonded capillary and the column length was optimized. Fine-tuning of applied voltage and internal pressure facilitated the simultaneous separation of all nine metabolites of KP. The system suitability parameters such as migration time, N, and Rs were established. In addition, analytical figures of merit such as repeatability of migration times and peak areas as well as IDL, linearity, the limit of detection (LOD), the limit of quantitation (LOQ), recovery, accuracy, and precision of the CEC-MS/MS methodology were assessed. Finally, the applicability of the developed method was extended to quantify the KP metabolites in commercial human plasma to determine the endogenous concentration. Calibration data obtained for the commercial human plasma was used to quantitate and correlate the KP metabolite levels in low vs. high inflammatory biomarkers (CRP and TNF-α) in the patient plasma samples.
3.1.1. Effect of buffer pH and concentration
We have chosen (NH4)2CO3 as the BGE because it is not only MS friendly due to its volatility, but it has a large buffering capacity due to the presence of three major buffering ionic species: [(carbonate (CO32−), bicarbonate, HCO3− and ammonium (NH4+)]. Thus, three buffering equilibria for (NH4)2CO3 include the presence of acetic acid-acetate buffering species at low pH [CH3COOH(aq) + H2O(l) ⇋ CH3COO−(aq) + H3O+(aq), pKa = 4.76], carbonic acid-bicarbonate species at moderate pH [HCO3−(aq) + H2O(l) ⇋ 2H2CO3(aq)pKa = 6.37] [47], and bicarbonate-carbonate species at high pH [CO32−(aq) + H2O(l) ⇋ HCO3−(aq) + OH−(aq), pKa = 10.25] [46]. In addition, the contribution of hydronium ion (H3O+) and hydroxyl ion (OH−) is also important at very acidic and very alkaline pH values, respectively. From the skeletal structure of the KP metabolites (Fig. 1) it is evident that the backbones are mainly formed of substituted benzene ring (log P = 2.13 [47]) (AA, HAA, HKYN, KYN), substituted indole ring (log P = 2.14 [48]) (TRP), substituted quinoline ring (log P = 2.03 [49]) (KA, XA) and substituted pyridine ring (log P = 0.65 [50]) (PA, QA). These various backbone structures impart different degrees of hydrophobicity on the KP molecules. On the contrary, there are different functional groups (-N=, -NH-, -NH2, -COOH, -OH) contributing to the hydrophilicity of the KP molecules and could serve as an ionizable group upon losing or gaining protons [51]. Thus, the pH of the mobile phase in CEC is a fundamental parameter that significantly affects the retention and separation selectivity of ionizable KP metabolites.
A comprehensive pH scan with the (NH4)2CO3 buffer was first performed to separate five KP metabolites. The plot of migration time vs. pH for five upstream KP metabolites (TRP, KYN, HKYN, KA, and AA) and the chromatograms are shown in Fig. S3 and Fig. S4, respectively. At a very low pH value of 3.0, the four (TRP, KYN, HKYN and AA) out of five metabolites have very close retention time, and they either co-elute or elute closely (Fig. S3, top chromatogram). This coelution is because at pH 3.0, all the above four metabolites have a range of positive charge (partially positive to strongly positive) but a similar charge to mass ratio. The only exception was KA (peak 4), which was retained much longer at pH 3.0 due to its partial negative charge (see Fig. 1 for pKa values of carboxylic and pyridine proton on KA), but essentially no EOF could be measured at this pH.
The inset plot in Fig. 3 shows that at pH 4.0, the elution time of the neutral marker (thiourea) is very long and remains unchanged upon increasing the pH from 4.0 to 5.0. However, the tr and tr/t0 values for all five KP metabolites drop for the same pH range (Fig.S3 and Fig. 3), respectively. At pH 5.0, AA molecule only obtained a partial negative charge (due to complete deprotonation of carboxylic group but nearly 50% protonation of pyridine group), while the effective charge for TRP, KYN and HKYN remain partially positive, which explains why tr and tr/t0 of AA is now close to KA compared to the other three metabolites at this pH (Figs. 3 and S2). As expected, in the pH range of 5.0–6.0, the thiourea run time (i.e., t0 decreases significantly, inset plot Fig. 3) due to an increase in zeta potential on the capillary surface, consequently increasing the EOF. However, the tr of all KP metabolites remains essentially unchanged (Fig. S2) or decreases only slightly, consequently increasing the tr/t0 values (Fig. 3).
Fig. 3.
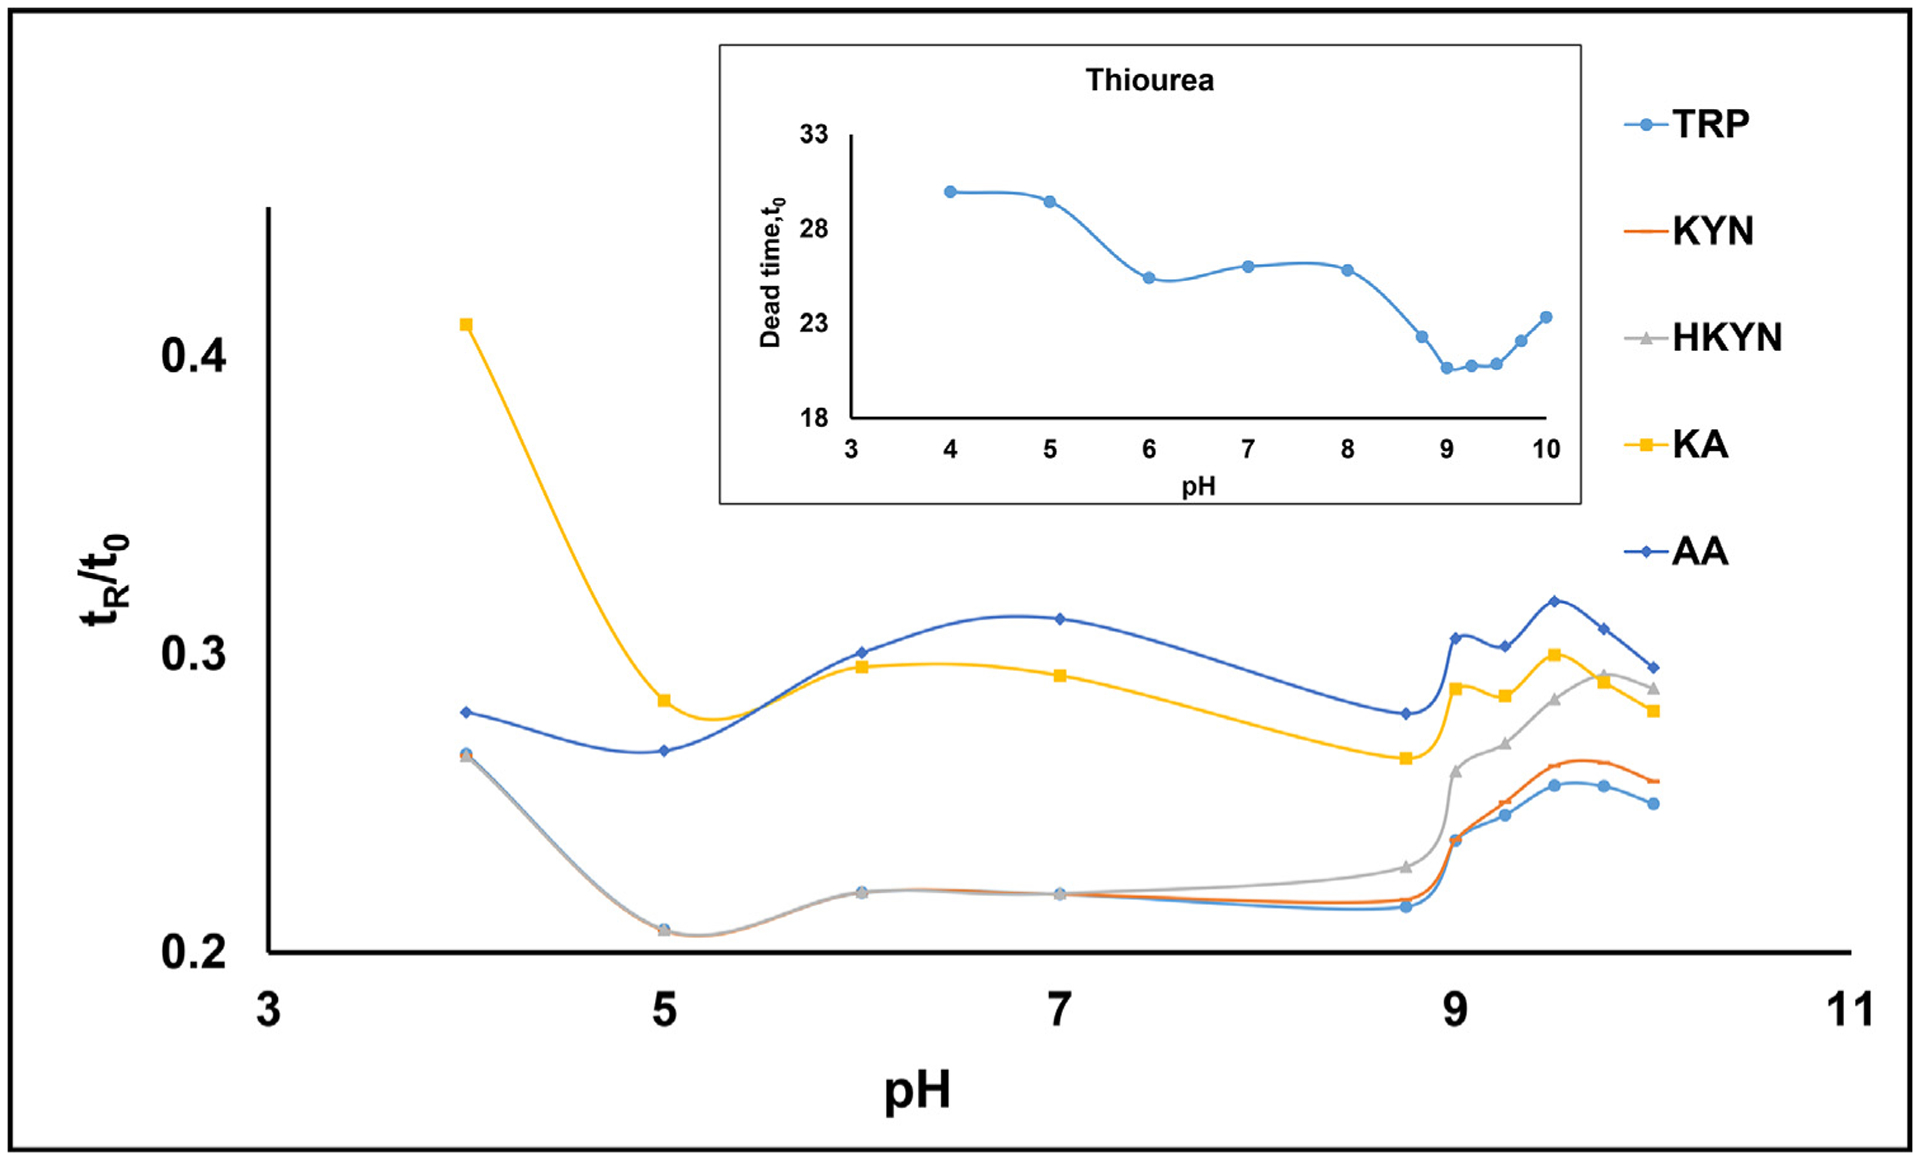
Effect of pH variation on the relative retention time (tr/t0) of five upstream KP metabolites. The AMPS covalent bonded column (65 cm × 50 um i.d.) was used to perform CE-ESI-MS/MS. Mobile phase: 15 mmol/L ammonium carbonate [(NH4)2CO3], prepared at pH 4.0–9.0 using 17.4 M acetic acid and above pH 9 using 14.5 M NH4OH. The applied voltage was +15 kV during separation generating a current range of 8.5–14.0 μA. Capillary temperature, 20 °C. Injection: 5 mbar for 100 s. A 100 mbar of internal pressure was applied to the AMPS column during CEC-MS runs. Spray chamber parameters: sheath liquid [80/20 (%v/v) MeOH/water, 40 mM HOAc], sheath liquid flow rate, 5 μL/min; capillary voltage, +3500 V; drying gas flow rate, 5.0 L/min; drying gas temperature, 200 °C; nebulizer pressure, 7 psi; collision cell gas (N2) pressure, 30 psi. The multiple reaction monitoring (MRM) in the positive ion mode was used (see Table 1 for MRM conditions). The inset plot shows the trend line for the dead time of thiourea over the pH range of 4.0–10.0. Curve identification for individual metabolites is listed in the legend.
At pH higher than 6.0 and in the range of 6.0–7.5, the carboxyl moiety is completely deprotonated for all KP metabolites, which tends to increase the electrophoretic mobility (EPM) of the metabolites towards the anode (which is opposite to the EOF of ions towards the cathode) resulting in longer run time trends for all five KP metabolites towards the MS end. Furthermore, at pH 6 and beyond, AA eluted after KA resulting in a reversal of elution order. Although both AA and KA are negatively charged at pH ≥ 6, the charge to mass ratio is higher for AA, increasing the EPM of AA towards the anode consequently increasing the retention time. In the pH range 8.0–9.0, the EOF starts increasing again, which gradually decreases the tr and t0, but tr/t0 of five KP metabolites remains essentially unchanged (Fig. 3). It is worth mentioning at pH 8.75, three metabolites (TRP, KYN, and HKYN) obtain partial negative charges, but HKYN (peak 3, Fig. S3) no more co-elutes with the other two due to the slightly increased run time from the added negative charge of the phenolic proton of HKYN. Nonetheless, from the plots shown in Figs. 3 and S3 and the chromatograms shown in Fig.S4, it is evident that the optimum separation in terms of baseline resolution and short run time should be in the region of pH 9.0–10.0.
Next, we fine-tuned the pH by studying at small increments of 0.25 pH units (starting from pH 9.0 and ending at pH 10.0) to find the optimum pH for the separation of six upstream KP metabolites. As shown in Fig. 4 (a–d), the Rs between neighboring peak pair of HKYN(peak 3)/KA(peak 4) drops and for peak pair of KA(peak 4)/AA(peak 5) improves, whereas, for peak pair of AA(peak 5)/XA(peak 6) Rs deteriorates first and then improves at pH 10.0. This awkward shift in Rs value is perhaps due to changes in mobility and consequently changes in selectivity of HKYN (peak 3), which is affected due to multiple ionization equilibria in this pH range. For example, compared to pH in the range 9.25–9.50 versus pH ≥ 9.75, the HKYN (peak 3) first coeluted with AA (peak 4) at pH 9.75 and then moves ahead of AA and eluted between AA and KA (peak 5) at pH 10.0. The reversal of retention order and a significant increase in the retention time of HKYN at pH 10.0 is due to the increase in negative charge (effective charge calculated as −1.68 [52]), which is more than 45% compared to pH 9.25.
Fig. 4.

Chromatograms (a–d) showing the effect of pH in the small increment (9.25–10.0) for the separation of six KP metabolites. The plots shown in (e-g) represent average efficiency (Navg), signal-to-noise (S/N) ratio and resolution (Rs) of six KP metabolites. The mobile phase, 15 mmol/L (NH4)2CO3, was adjusted to various pH values using 14.5 M NH4OH. Peak identifications: 1. TRP (16.25 μM), 2. KYN (33.75 μM), 3. HKYN (68.5 μM), 4. KA (15 μM), 5. AA (15 μM), 6. XA (33.75 μM). Other CEC-ESI-MS conditions are the same as described in Fig. 3.
The overall retention time of all six upstream KP metabolites increases slightly with the increase in pH in the range of 9.0–10.0. To obtain the best fine-tuned pH, we have calculated the average efficiency (Navg), S/N and Rs for all metabolites as shown in Fig. 4e, f, and g, respectively. The Navg is highest and similar for all six metabolites for a pH range of 9.25 to 9.50 (~11,000 plates) but gradually decreases when pH ≥ 9.50. The S/N for all six metabolites shows a somewhat erratic trend. First, S/N slightly decreases from pH 9.25–9.75, increases at pH 10, and then finally decreases again at pH 10.25. At pH 9.25, all neighboring peaks are baseline resolved with Rs more than 1.5 except for TRP/KYN, which remains unchanged irrespective of pH. Although the S/N is somewhat lower at pH 9.25 compared to that for pH 10.0, we have still chosen pH 9.25 as the optimum pH because the efficiency is highest and the maximum number of upstream KP metabolite peaks are resolved.
It is well-known in CEC-MS that the concentration of volatile BGE can influence both Rs and run time as well as S/N. As shown in chromatograms and the plots (Fig. S5 (a–f), when the concentration of (NH4)2CO3 was increased from 15 to 25 mM, the run times only increase slightly, but the Navg and S/N initially drops and then remains unchanged. In contrast, the Rs for most metabolites also remain unchanged. Therefore, 15 mM (NH4)2CO3 was considered the optimum concentration for BGE because the total run time was the shortest, and Navg and S/N were the highest. Better gaussian peak shape of the last eluting XA (peak 6) is another merit for using 15 mM (NH4)2CO3 at pH 9.25.
3.1.2. Effect of monomer concentration
Polymerization solutions containing 8, 14, 40, 48, and 60 mg/mL of AMPS monomer were prepared for covalent attachment of the AMPS ligand to the silanized column wall. Chromatograms and the corresponding N, S/N, and Rs curves are shown in Fig. 5 (a–h). Increasing the AMPS concentration in the mixture increases the interaction of the polar KP analytes with the stationary phase, eventually increasing the migration time. In addition, the peak shapes of the metabolites also improve because increasing the content of AMPS monomer increases the surface area of the stationary phase, decreasing column overload. For the six upstream KP metabolites, the baseline separation of TRP-KYN seems challenging. We varied the AMPS monomer concentration in the polymerization mixture with the hope of improving the Rs of the TRP/KYN peak pair. The Rs of TRP/KYN was indeed enhanced from 0.5 to 1.0 at 40 mg/mL. We have chosen 40 mg/mL of AMPS as optimum instead of 48 mg/mL because Rs of TRP/KYN peak pair remains unchanged, but the overall analysis time significantly increases, and the peak shape of XA (peak 6) deteriorates at higher AMPS concentrations.
Fig. 5.

Effect of monomer (AMPS) concentration in the polymerization mixture for the separation of six upstream KP metabolites. The AMPS concentration for the chromatograms in (a–e) was varied to 8, 14, 40, 48 and 60 mg/mL, respectively. The plots shown in (f-h) represents efficiency (N), signal-to-noise (S/N) ratio and resolution (Rs) of six upstream KP metabolites. Mobile phase: 15 mM (NH4)2CO3, pH 9.25. Other conditions and peak identification are the same as Fig. 3 and Fig. 4, respectively.
3.1.3. Effect of column length
One way to increase N and, consequently, Rs is to increase the column length. However, this can be problematic in HPLC, where column backpressure is also increased. In contrast, using OT-CEC capillaries when subjected to a high voltage provide higher efficiency with increasing column length. For example, Navg for a 62.2 cm column length was 22,000, which was almost double to 40,000 for an increased length of 77.2 cm (data not shown). It is now well established that, unlike the plug flow in pressure-driven HPLC, the electrically driven flow rate in OT-CEC has a flat flow profile. The separation is achieved by electrophoretic migration of solutes and differential partitioning between the stationary, and mobile phases. Therefore, the column length can be advantageously varied to optimize the separation. Using the optimum AMPS concentration of 40 mg/mL, we varied the column length while keeping the applied voltage constant at variable field strength. As shown in Fig. 6, the Rs between the critical pair of TRP and KYN increased from 0.9 to 1.2 upon increasing the column length from 62.2 to 72.2 cm. Finally, TRP and KYN were baseline separated (Rs = 1.5) when the column length was further increased to 77.2 cm. Attaining the separation of the critical pair of TRP and KYN did not require any further method optimization but instead resulted in a simple and straightforward Rs improvement.
Fig. 6.

Effect of column length at a fixed voltage for the separation of six KP metabolites. Column length was varied at 62.2, 72.2, and 77.2 cm, respectively. Other conditions and peak identifications are the same as Figs. 3 and 4.
For the simultaneous separation of nine KP metabolites, we first conducted an experiment of variation of pH from 7.5 to 9.2, and the optimum pH condition was found to be 8.25 (data not shown). Next, both the applied voltage and the column length were varied while the ratio of a volt per length and pH remained constant in each case (Fig. S6 a, b, c). The Navg increased from 40,000 to 200,000 when the column length increased from 62.2 to 150 cm at a constant volt/length of 0.12 kV/cm. For a 62.2 cm column length, Rs of eight pairs TRP/KYN, KYN/HKYN, HKYN/KYNA, KYNA/HAA, HAA/PA, PA/AA, AA/XA, and XA/QA were 0.4, 1.3, 16, 2.2, 0.4, 0.9, 1.9, and 2.4, respectively with a total run time of ~ 30 min (Fig. S6 a). Upon increasing the column length to 77.2 cm, only the KYN (peak 2) /HKYN (peak 3) pair showed improved resolution (Rs = 2.1), but no further improvement of Rs was seen for the remaining pairs of metabolites. However, the total run time now increased to ~44 min (Fig. S6b). Although the overall retention time was further increased to 142 min using the longest column of 150 cm, the best separation for all metabolites was achieved (Fig. S6 c). Nonetheless, all seven peak pairs of KP metabolites was baseline resolved except for PA(peak6)/AA (peak 7) pair (Rs = 0.8).
3.1.4. Optimized separation of nine KP metabolites
To achieve baseline separation with a further decrease in run time, we studied the combined effect of applied voltage with the application of internal pressure or external pressure (Fig. 7a–d). First, upon increasing the internal pressure from 100 to 950 mbar (at a constant voltage of 20 kV), the Rs between TRYP (peak 2)/KYN (peak 3) was slightly improved, whereas the Rs between PA (peak 7)/AA (peak8) deteriorated. However, the overall run time decreased from 127 to 115 min (Fig. 7a versus 7b). A slight decrease in applied voltage to 18 kV resulted in improving the Rs of PA/AA from 0.5 to 1.6 while still maintaining the baseline Rs of TRP/KYN peak pair (Fig. 7c). Note that a decrease in applied voltage increased the run time slightly for the early eluting metabolite peaks (i.e., 1–7). However, for highly charged metabolites such as XA (peak8) with an effective charge of −1.9 and QA (peak 9) with an effective charge of −2.0, the run time essentially remains unchanged. Finally, using an external pressure of 2 bar (Fig. 7d), the EOF becomes so fast that the run time drops and loss of selectivity resulted in zero EPM differences of the KP metabolites across the OT-CEC column. Overall, 18 kV applied voltage, 950 mbar internal pressure, pH 8.25, 15 mM (NH4)2CO3 provided the optimum conditions for the simultaneous separation of all nine KP metabolites in less than 115 min.
Fig. 7.

The combined effect of the variation of pressure and voltage for the simultaneous separation of nine KP metabolites. 1. THIO (850 μM), 2. TRP (7.5 μM), 3. KYN (15 μM), 4. HKYN (25 μM), 5. KA (8.34 μM), 6. HAA (32.5 μM), 7. PA (30 μM), 8. AA (12.5 μM), 9. XA (40 μM), 10. QA (150 μM). Mobile phase: 15 mM (NH4)2CO3, pH 8.25. The applied voltage of 18 and 20 kV and internal pressure 100 mbar and 950 mbar, the external pressure of 2.0 bar were used. Other conditions and parameters are the same as described in Fig. 3, except a longer column of 150 cm length was used.
It is evident that performing ~two hours run per sample is not practical for developing clinical assays. However, in this manuscript, the quantitation of six metabolites (TRP, KYN, KA, AA, PA, QA) in plasma samples of human subjects is reported and all of them could be simultaneously separated and quantitated within 30 min. A clinician could pick any of those methods for quantitation of the desired KP metabolites. The separation of nine KP metabolites is reported to show the power of capillary electrophoresis to simultaneously resolve all nine metabolites of the KP. A future experiment could incorporate programming the external pressure to the method after the elution of the 7th metabolite to reduce the run time because it is only the last two metabolites (XA, QA) that are retained very long at pH 8.20 (Fig. 7c).
3.1.5. Separation of downstream and related metabolites
We develop a relatively faster separation for the three downstream (HAA, PA, QA) along with three more related metabolites (TRM, HTRP, HIAA) of KP [Fig. 8 (a,b)]. For the same column length of 77.2 cm, buffer pH was compared at 9.25 and 9.75. All six metabolites are baseline resolved at pH 9.75, with an overall analysis time of less than 30 min. Interestingly, the reversal of the elution order of HAA/PA peak pair was observed with HAA eluting later than PA at a higher pH value of 9.75. Obviously, this reversal is related to the pKa value of 10.1 for the phenolic proton in HAA, imparting an increased negative charge, hence decreasing effective EPM towards the MS end.
Fig. 8.

Separation of three downstream metabolites (peaks 4–6) and three KP-related metabolites (peaks 1–3) at pH 9.25 and 9.75. Mobile phase: 15 mM (NH4)2CO3 at (a) pH 9.25 and (b) pH 9.75. Peak identifications: 1. TRPM (6 μM), 2. HTRP (30 μM), 3. HIAA (18 μM), 4. PA (30 μM), 5. HAA (100 μM), 6. QA (210 μM). Other CEC-ESI-MS conditions are the same as Fig. 3.
3.2. System suitability parameters
The system suitability parameters such as the day-to-day and column-to-column repeatability of migration times, peak areas, and relative sensitivities [defined as instrument detection limit (IDL)] of the KP metabolites were tested.
Using the conditions optimized for separation of all nine metabolites (discussed in Section 3.1.4), excellent 1–2% RSD for intra-day repeatability of retention times of the six early eluting metabolites was achieved. However, somewhat higher, i.e., 5–8% RSD for three later eluting metabolites (AA, QA, and XA) were obtained. In general, the inter-day repeatability of retention times ranged from 1–7% RSD (Table S2).
For peak area, intra-day repeatability and inter-day repeatability ranged from 2–15% and 6–16%, respectively (Table S2). The use of S/N to evaluate the limit of detection (LOD) is sometimes ambiguous when ion noise is low and highly variable. Because noise is random, it is hard to precisely determine the baseline region selected for noise calculation. Therefore, an alternative sensitivity parameter, known as instrument IDL calculation (Table S3) based on the statistical confidence level, was performed [45]. The IDL is defined as the smallest signal or amount of analyte that is statistically greater than zero within a specified probability of being correct. Note that IDL calculation could serve not only as a means of characterizing instrument performance but also for high and low background noise conditions (see inset Box C in Table S3 for example calculation). As tabulated in Table S3, The IDL value (counts or concentration) obtained for intra-day (% RSD 4–8, n = 8 runs) and inter-day (% RSD 6–11, n = 2 days) measurement signifies the least amount of specific KP metabolite is detectable and distinguishable from the background with a 99%probability. The only exception was XA, which provided a significantly higher % RSD for both intra-day and inter-day.
3.3. Method validation
The assay in the commercial plasma sample was validated following the FDA guidelines [53,54]. The validation parameters include linearity, LOD, LOQ, accuracy and precision.
3.3.1. Linearity, LOD and LOQ
The parameters of the linear regression function such as slope and intercept value of the equation, linear correlation coefficient, linearity range, LOD and LOQ are listed in Table 1. As shown in Fig. S7, a linear response of the peak area was observed over a concentration range of 14.4–57.6 μg/mL, 0.8–3.4 μg/mL, 14–137 ng/mL, 9–190 ng/mL, 12–118 ng/mL and 33–900 ng/mL for TRP, KYN, AA, KA, PA, and QA, respectively. These linear ranges were sufficient to quantitate all the aforementioned KP metabolite (except PA) in low and high inflammation plasma samples. The correlation coefficient values were higher than 0.998 in each case. The experimental LOD and LOQ varied between 31–1000 nM and 100–10,000 nM, respectively, for all metabolites. The results in Table 2 list the endogenous amount of five KP metabolites determined in commercial healthy human plasma. Literature values are in good agreement for TRP (48.7 ± 11.6 μM) [55], KYN (1.35±0.26 μM) [56], and KYNA (30±7 nM) [57], whereas comparatively higher value for AA (30±10 nM) [57], and lower value for QA (470±47 nM) [58] are measured in this commercial human plasma sample.
Table 1.
Parameters for linear regression function, †*Limit of detection (LOD) and †*limit of quantitation (LOQ) for six KP metabolites in human plasma.
| Analyte | Linearity Range (μg/mL) | Correlation Coefficient | Calibration Curve | S/N at experimental LOD | LOD (experimental), nM | S/N at experimental LOQ | LOQ (experimental), nM |
|---|---|---|---|---|---|---|---|
| TRP | 14.4–57.6 | 0.9994 | y = 20.1(±0.3) × − 50.3(±0.4) | 3 | 31 | 832 | 10,000 |
| KYN | 0.8–3.4 | 0.9986 | y = 55(±2) × − 1.14(±0.05) | 4 | 250 | 15 | 506 |
| AA | 14–137 | 0.9981 | y = 3.05(±0.04) × −0.083(±0.003) | 2 | 50 | 8 | 100 |
| KA | 9–190 | 0.9999 | y = 3.8(±0.3) × − 0.048(±0.003) | 7 | 50 | 9 | 100 |
| PA | 12–118 | 0.9990 | y = 6.5(±0.4) × − 0.002(±0.003) | 2 | 100 | 10 | 1000 |
| QA | 33–900 | 0.9995 | y = 58(±7) × − 0.28(±0.02) | 5 | 50 | 8 | 100 |
The LOD is defined as the concentration at which S/N = 2 and LOQ is defined as the concentration at which S/N = 10.
The injection sizes used in LOD measurement are: 5 mbar, 100 s for TRP, KYN, AA and HKYN, 5 mbar X 50 s for KYNA, QA, HAA, and PA, 5 mbar X 25 s for XA. The Injection sizes used in LOQ measurement are 5 mbar X 100 s for TRP, and KYN, 5 mbar X 50 s for KYNA, QA, HAA and AA, 5 mbar X 25 s for HKYN, and XA, 5 mbar X 10 s for PA.
Table 2.
†Endogenous concentration of five KP metabolites in the commercial human plasma sample.
| AA nM | AA ng/mL | KA nM | KA ng/mL | QA nM | QA ng/mL | TRP μM | TRP μg/mL | KYN μM | KYN μg/mL | |
|---|---|---|---|---|---|---|---|---|---|---|
| day 1 | 80 | 10.9 | 51 | 9.6 | 250 | 42 | 50.9 | 10.39 | 1.20 | 0.25 |
| day 2 | 86 | 11.8 | 44 | 8.3 | 270 | 45 | 49.9 | 10.19 | 1.08 | 0.23 |
| day 3 | 85 | 11.6 | 48 | 8.7 | 310 | 52 | 50.2 | 10.25 | 1.16 | 0.24 |
| Average | 83 | 11.4 | 48 | 8.7 | 277 | 46 | 50.3 | 10.28 | 1.15 | 0.24 |
| SD | 3 | 0.4 | 3 | 0.5 | 25 | 4 | 0.4 | 0.08 | 0.05 | 0.01 |
| %RSD | 3 | 3 | 6 | 6 | 9 | 9 | 1 | 1 | 4 | 4 |
The endogenous concentrations are the naturally produced amounts of specific metabolites per unit volume of human plasma (see experimental Section 2.6). Example calculations for endogenous concentration measurement are shown in the supplementary Fig. S7 (Text box B).
3.3.2. Recovery, accuracy and precision
The relative recoveries and accuracy in terms of percent deviations were estimated by measuring spiked samples of six KP metabolites (TRP, KYN, AA, KA, PA, and QA) at three concentrations (low, medium and high) with 3 replicates of each (n = 3). As shown in Table 3, intra-day recoveries of AA, PA, KYNA, QA, TRP, and KYN varied between 94–104%, 97–103%, 90–114%, 98–110%, 92–104% and 90–114%, respectively. A lower recovery was obtained for KYN and KA at the medium spiked concentration because the spiked value (8 μM) is significantly higher than the experimental LOQ of 506 nM (Table 3). Intra-day accuracy (%deviations) was within 10% for all metabolites except for KYN and KA, with a maximum deviation of 11% and 13%, respectively, perhaps due to their higher extraction efficiency. The precision of the assay expressed by the % RSD of the concentration values was measured at three different spike levels. Intra-day repeatability was within 11% RSD for all metabolites except for KYNA with a 24% RSD (Table 3). Overall, the precision was excellent at the highest spiked concentration.
Table 3.
Intra-day recovery, accuracy and assay precision for validation of the analytical method developed.
| Analyte (conc.) | Spike level | †%Recovery | *Accuracy (% deviation) | Precision (% RSD) |
|---|---|---|---|---|
| AA (nM) | 100 | 102 ± 6 | 3 ± 1 | 6 |
| 501 | 94 ± 4 | 5 ± 4 | 4 | |
| 1002 | 104 ± 3 | 4 ± 3 | 3 | |
| PA (nM) | 96 | 97 ± 5 | 5 ± 3 | 5 |
| 561 | 103.3 ± 0.2 | 3.3 ± 0.2 | 0.2 | |
| 962 | 102.1 ± 0.9 | 2.1 ± 0.9 | 0.9 | |
| KA (nM) | 50 | 114 ± 27 | 13 ± 7 | 24 |
| 100 | 90 ± 5 | 6 ± 3 | 5 | |
| 1003 | 101 ± 3 | 2.8 ± 0.5 | 3 | |
| QA (nM) | 197 | 110 ± 10 | 5 ± 4 | 9 |
| 1077 | 106 ± 11 | 8 ± 6 | 11 | |
| 5385 | 98 ± 6 | 5 ± 3 | 6 | |
| TRP (μM) | 71 | 92 ± 6 | 5 ± 3 | 7 |
| 142 | 103 ± 2 | 3 ± 2 | 2 | |
| 282 | 104 ± 3 | 4 ± 3 | 3 | |
| KYN (μM) | 4 | 114 ± 6 | 11 ± 4 | 5 |
| 8 | 90.0 ± 0.9 | 8.7 ± 0.7 | 1 | |
| 16 | 98.3 ± 0.5 | 1.5 ± 0.5 | 0.5 |
The assay recovery for the validation was calculated as follows: spiked recovery= 100 × (measured concentration for spiked sample - the measured concentration for nonspiked sample)/spiked value;
measured concentration of spiked sample = mean basal concentration (X) + spiked conc;
measured concentration for nonspiked sample = mean basal concentration (X).
mean basal concentration is determined as an unknown concentration value obtained from the calibration curve shown in Fig. S7; spiked value = added standard concentration.
The assay accuracy (% deviation) = 100 × І(measured concentration for spiked sample - the theoretical concentration for spiked sample)І/ the theoretical concentration for the spiked sample.
Theoretical concentration for spiked sample = mean basal concentration + added standard concentration.
Inter-day recoveries of AA, PA, KA, QA, TRP, and KYN listed in Table 4 varied between 92 and 104%, 95–104%, 96–98%, 100–111%, 90–104%, and 90–118%, respectively indicating no significant interference of the excipients in the plasma. Inter-day accuracy was within 10% for all metabolites except for KYN and KA, with a maximum deviation of 14% and 15%, respectively. Note that KA has the higher extraction efficiencies on day 1 and 2, but for day 3 the efficiencies reduced very significantly to 61%, due to the stability issue of the standard mixture. Example calculations for recovery and % deviation are shown in Fig. S2 (text box A). Inter-day reproducibility was within 9% RSD for all metabolites except for QA and KYNA, with a maximum of 13% and 18% RSD, respectively (Table 4).
Table 4.
Inter-day (n = 3 days) recovery, accuracy and precision for validation of the analytical method developed.
| Recovery | Accuracy | Precision | |||||||||||
|---|---|---|---|---|---|---|---|---|---|---|---|---|---|
| Analyte (Conc.) | Spike level | day1 | day2 | day3 | inter-day | %Deviation | %RSD | ||||||
| day1 | day2 | day3 | inter-day | day1 | day2 | day3 | inter-day | ||||||
| AA (nM) | 100 | 102 | 108 | 104 | 104 ± 3 | 3.4 | 6.4 | 5.9 | 5 ± 1 | 5.9 | 10 | 11 | 9 ± 2 |
| 501 | 93.8 | 94.5 | 89 | 92 ± 2 | 5.3 | 8.7 | 9.4 | 8 ± 2 | 4.4 | 10 | 4.2 | 6 ± 3 | |
| 1002 | 104 | 104 | 105 | 104 ± 4 | 3.9 | 4 | 5.4 | 4.4 ± 0.7 | 3.1 | 3.8 | 5 | 4.0 ± 0.8 | |
| PA (nM) | 96 | 96.6 | 105 | 84.7 | 95 ± 8 | 4.9 | 6.6 | 18 | 10 ± 6 | 5.1 | 6.2 | 16 | 9 ± 5 |
| 561 | 103 | 100 | 101 | 101 ± 1 | 3.3 | 1.5 | 2.2 | 2.3 ± 0.7 | 0.2 | 1.7 | 2 | 1.3 ± 0.8 | |
| 962 | 102 | 106 | 104 | 104 ± 2 | 2.1 | 6.5 | 3.8 | 4 ± 2 | 0.9 | 4.2 | 3.4 | 3 ± 1 | |
| KA (nM) | 50 | 114 | 117 | 61 | 97 ± 26 | 13.3 | 11 | 20 | 15 ± 4 | 24 | 18 | 12 | 18 ± 5 |
| 100 | 90.3 | 107 | 90.4 | 96 ± 8 | 6.4 | 6.6 | 6.5 | 6.5 ± 0.1 | 5.1 | 7.4 | 10 | 8 ± 2 | |
| 1003 | 101 | 94.3 | 98.5 | 98 ± 3 | 2.8 | 5.5 | 2.9 | 4 ± 1 | 2.6 | 4.5 | 1.6 | 3 ± 1 | |
| QA (nM) | 197 | 110 | 89.6 | 116 | 105 ± 11 | 4.7 | 6.1 | 6.9 | 5.9 ± 0.9 | 9.2 | 14 | 15 | 13 ± 3 |
| 1077 | 106 | 107 | 121 | 111 ± 7 | 8.4 | 5.8 | 16 | 10 ± 4 | 11 | 7.3 | 0.6 | 6 ± 4 | |
| 5385 | 98 | 103 | 98 | 100 ± 2 | 5 | 3.7 | 2.3 | 4 ± 1 | 5.9 | 3.5 | 3 | 4 ± 1 | |
| TRP (μM) | 71 | 92.4 | 89.4 | 87.4 | 90 ± 2 | 4.8 | 6.2 | 7.3 | 6 ± 1 | 6.8 | 0.9 | 1.8 | 3 ± 3 |
| 142 | 103 | 101 | 104 | 103 ± 1 | 2.5 | 1 | 3.1 | 2.2 ± 0.9 | 2.1 | 1.9 | 1.3 | 1.8 ± 0.3 | |
| 282 | 104 | 103 | 104 | 103.7 ± 0.5 | 3.8 | 2.2 | 3.2 | 3.1 ± 0.7 | 3.2 | 0.8 | 1.8 | 2 ± 1 | |
| KYN (μM) | 4 | 114 | 118 | 123 | 118 ± 4 | 11 | 14 | 18 | 14 ± 3 | 5 | 0.6 | 0.8 | 2 ± 2 |
| 8 | 90 | 89.6 | 90.6 | 90.1 ± 0.4 | 8.7 | 9.2 | 8.1 | 8.7 ± 0.5 | 0.9 | 2.2 | 3 | 2.0 ± 0.9 | |
| 16 | 98.3 | 99.4 | 98.8 | 98.8 ± 0.5 | 1.5 | 3.1 | 2.3 | 2.3 ± 0.7 | 0.5 | 3.3 | 2.3 | 2 ± 1 | |
The assay recovery for the validation was calculated as follows: spiked recovery = 100 × (measured concentration for spiked sample - the measured concentration for nonspiked sample)/spiked value.
The measured concentration of spiked sample = Mean basal concentration (X) + spiked conc.
the measured concentration for nonspiked sample = Mean basal concentration (X).
Mean basal concentration is determined as an unknown concentration value obtained from the calibration curve shown in Fig. S2 and text box A.
Spiked value = added standard concentration.
The assay accuracy (% deviation) = 100 × І(measured concentration for spiked sample - the theoretical concentration for spiked sample)І/ the theoretical concentration for the spiked sample. Theoretical concentration for spiked sample = Mean Basal concentration + added standard concentration.
3.4. Robustness
The robustness of the CEC-MS column was evaluated using the optimized conditions discussed in Section 3.1. The column-to-column repeatability (columns prepared from the same batch of polymerization mixture) is demonstrated in Fig. 9. Clearly, the tR of one low retained KP metabolite (i.e., TRP) and two moderately retained KP metabolites (KA and PA) are very close on three columns with intercolumn %RSD (n = 40 runs on each column) of tR in the range of 4.5–5.7%. However, the tR repeatability of highly retained KP metabolite (i.e., QA) is 10%, somewhat higher due to retention time uncertainty caused by peak broadening (Table S4). Still, both polar charged compounds (PA and QA) are baseline resolved, whereas they are hard to retain and separate by the commonly used C-18 reversed-phase HPLC columns [21].
Fig. 9.

Column-to-column repeatability of the elution band profile of four KP metabolites. Peak identifications: 1. TRP (25 μM), 2. KA (15 μM), 3. PA (15 μM), 4. QA (150 μM) for a set of three AMPS columns. Injection size 5 mbar for 75 s, column length 73.2 cm. Note that the highly negatively charged metabolite (QA) is retarded more on columns no. 2 and 3. The critical resolution is satisfactory with all three columns. Other CEC-MS conditions are the same as discussed in Fig. 3 or Section 2.8. The inset plot shows the retention time stability of four KP metabolites for 200 injections. The arrow indicates a gap of four days after thirty-five hrs. of run time followed by three days of continuous measurements. The inset table shows the mean and %RSD for all four metabolites for 200 injections on a single column.
For peak area, inter-column repeatability ranged from 18 to 29% (Table S4). The comparatively high standard deviations of the measured peak areas were due to the MS signal variations, the background noise, and the variance from injection to injection. However, this intercolumn %RSD for peak area was significantly lowered to 15–18% using peak area ratio (Table S5, row 12).
The column lifetime, which is a test of column aging, was tested as well. It was observed that the column was still fully functional with no peak broadening even after 200 runs (Fig. S8). Furthermore, excellent repeatability in tR for all four KP metabolites (2% RSD for TRP, KA, PA, and 4% RSD for QA) (Fig. 9 inset plot and inset table) with no loss in column efficiency (data not shown) was observed. The %RSD for peak area ratio ranged from 7 to 12% (Table S4). Therefore, the intracolumn repeatability is proven to be reliable for quantitation and could be further improved when deuterated internal standards are used for quantitation.
3.5. Test for inflammation
The CRP, interacting with Interleukin-6 (IL-6), is a lever generated marker of inflammation previously associated with cardiovascular and diabetes risk. On the other hand, TNF-α is an acute-phase protein secreted into the bloodstream as an immunologic response [59]. One pathway by which these two aforementioned inflammatory biomarkers may contribute to the symptoms of depression is the activation of the enzyme IDO. Following analytical validation, the quantitation method was applied to test the plasma samples of patient diagnosed with depressive symptoms classified as a high degree of inflammation (i.e., CRP >3 mg/L) and a low degree of inflammation (i.e., CRP < 3 mg/L). The results in Tables 5 and 6 show the content of the five KP metabolites determined in plasma of 34 subjects at time t1 and t2, respectively, for both low and high inflammatory biomarkers (CRP and TNF-α). Besides the content of metabolites, data expressing the following ratios KYN/TRP, AA/TRP, KA/TRP, QA/TRP, AA/KYN, KA/KYN, QA/KYN, KA/AA, QA/AA, and QA/KA, has been added as additional variables. To determine whether the difference between the two means is statistically significant, we compared the mean intervals for low and high inflammatory groups. If the confidence intervals overlap, we conclude that the difference between groups is not statistically significant. If there is no overlap, the difference is substantial. For time t1, the mean of KYN, AA, KA, QA, and the six pair of metabolite (KYN/TRP, KA/TRP, AA/KYN, QA/KYN, KA/AA, QA/AA, and QA/KA) ratios show a significant difference between the low and high degree of inflammation as determined by CRP and TNF-α (Table 5). For time t2, the mean of KYN, AA, KYNA, and eight pair of metabolite ratios (KYN/TRP, AA/TRP, KA/TRP, KA/KYN, QA/KYN, KA/AA, QA/AA, QA/KA) show significant differences. The concentration of neurotoxic QA decreases from time t1 to t2 among the low CRP group of patients. Furthermore, the numerical value of the ratios for AA/TRP, AA/KYN, and KA/KYN decreased at a faster rate for low CRP than the high CRP group of patients as the collection time increases from t1 to t2.
Table 5.
Mean plasma concentrations of tryptophan metabolites and relative ratios of the metabolites in the low and high inflammatory groups of patients measured at time t1.
| Inflammatory marker | C-reactive protein (CRP) | Tumor necrosis factor-α (TNF-α) | ||
|---|---|---|---|---|
| *Low (+/−¥SD) | **High (+/−¥SD) | †Low (+/−¥SD) | ††High (+/−¥SD) | |
| TRP (μM) | 56 (4) | 54 (3) | 65 (7) | 67 (6) |
| KYN (μM) | 3.9 (0.2) | 5.1 (0.2) | 3.6 (0.2) | 3.2 (0.1) |
| AA (nM) | 221 (7) | 243 (6) | 212 (7) | 225 (5) |
| KA (nM) | 119 (4) | 144 (4) | 106 (2) | 90 (5) |
| QA (nM) | 1000(44) | 890 (12) | 1030 (70) | 1000 (17) |
| KYN/TRP | 0.071 (0.007) | 0.093 (0.006) | 0.055 (0.007) | 0.047 (0.004) |
| AA/TRP | 0.0040 (0.0003) | 0.0045 (0.0003) | 0.0033 (0.0004) | 0.0033 (0.0003) |
| KA/TRP | 0.0021 (0.0002) | 0.0026 (0.0002) | 0.0016 (0.0002) | 0.0013 (0.0001) |
| QA/TRP | 0.018 (0.002) | 0.0164 (0.0009) | 0.016 (0.002) | 0.015 (0.001) |
| AA/KYN | 0.056 (0.003) | 0.048 (0.002) | 0.059 (0.003) | 0.071 (0.003) |
| KA/KYN | 0.030 (0.002) | 0.028 (0.001) | 0.030 (0.002) | 0.028 (0.002) |
| QA/KYN | 0.25 (0.02) | 0.176 (0.007) | 0.29 (0.02) | 0.31 (0.01) |
| KA/AA | 0.54 (0.02) | 0.59 (0.02) | 0.50 (0.02) | 0.40 (0.02) |
| QA/AA | 4.5 (0.2) | 3.7 (0.1) | 4.9 (0.4) | 4.4 (0.1) |
| QA/KA | 8.4 (0.5) | 6.2 (0.2) | 9.7 (0.7) | 11.1 (0.6) |
Mean (n = 11 subjects),.
Mean (n = 6 subjects).
Mean (n = 3 subjects).
Mean (n = 4 subjects).
SD of ratio (Y/X) = Y/X × √ [(SD of Y/Y)2 + (SD of X/X)2−(2 × covariance (Y, X)/(Y × X)]. X and Y are the mean value for any two metabolites. Covariance is zero assuming X and Y are independent.
Table 6.
Mean plasma concentrations of KP metabolites and relative ratios of the metabolites in the low and high inflammatory groups of patients measured at time t2.
| Inflammatory marker | C-reactive protein (CRP) | Tumor necrosis factor-α (TNF-α) | ||
|---|---|---|---|---|
| *Low (+/−¥SD) | **High (+/−¥SD) | †Low (+/−¥SD) | ††High (+/−¥SD) | |
| TRP (μM) | 52 (4) | 47 (3) | 57 (4) | 52 (7) |
| KYN (μM) | 4.0 (0.2) | 4.5 (0.2) | 3.8 (0.1) | 4.3 (0.2) |
| AA (nM) | 195 (6) | 206 (4) | 177 (5) | 166 (4) |
| KA (nM) | 94 (4) | 120 (5) | 24 (1) | 24 (1) |
| QA (nM) | 900 (31) | 880 (20) | 850 (46) | 930 (28) |
| KYN/TRP | 0.076 (0.007) | 0.095 (0.008) | 0.066 (0.005) | 0.08 (0.01) |
| AA/TRP | 0.0037 (0.0003) | 0.0044 (0.0003) | 0.0031 (0.0002) | 0.0032 (0.0004) |
| KA/TRP | 0.0018 (0.0002) | 0.0026 (0.0002) | 0.00042 (0.00004) | 0.00046 (0.00006) |
| QA/TRP | 0.017 (0.002) | 0.019 (0.001) | 0.015 (0.001) | 0.018 (0.002) |
| AA/KYN | 0.049 (0.002) | 0.046 (0.003) | 0.047 (0.002) | 0.039 (0.002) |
| KA/KYN | 0.024 (0.001) | 0.027 (0.002) | 0.0064 (0.0004) | 0.0056 (0.0004) |
| QA/KYN | 0.23 (0.01) | 0.20 (0.01) | 0.22 (0.01) | 0.22 (0.01) |
| KA/AA | 0.48 (0.03) | 0.58 (0.03) | 0.137 (0.008) | 0.145 (0.008) |
| QA/AA | 4.6 (0.2) | 4.3 (0.1) | 4.8 (0.3) | 5.6 (0.2) |
| QA/KA | 9.5 (0.5) | 7.3 (0.4) | 35 (3) | 39 (2) |
Mean (n = 11),.
Mean (n = 6).
Mean (n = 3).
Mean (n = 4).
SD of ratio (Y/X) = Y/X × √ [(SD of Y/Y)2 + (SD of X/X)2−(2 × covariance (Y, X)/(Y × X)]. X and Y are the mean value for any two metabolites. Covariance is zero assuming X and Y are independent.
Because of the non-normal distribution of the metabolites, the relationship among the various combination of metabolites was examined using Pearson’s rank correlation coefficient (Pearson’s r) and p-value. As shown in Table 7, plasma AA-KA metabolite pair provide the highest statistical significance in both low and high CRP patients (Pearson’s p = 0.004 and 0.0001, respectively). In contrast, the plasma KYN-KA metabolite pair was the least significant among the high CRP group of patients (Pearson’s p = 0.0246). A similar trend was observed for Pearson’s correlation term r, where plasma AA-KA metabolite pair provided the highest correlation (r = 0.8909) among the high CRP patients. In contrast, the plasma KYN-AA metabolite pair was least correlated among low CRP patients (r = 0.5570). The representative correlation plots for AA-KA and KYN-AA are shown in Fig. S7.
Table 7.
Correlation between significant plasma KP metabolite pairs for low and high CRP patient samples at time t1 or t2.
| Pearson’s correlation pairs | r value | †df | ‡ p-value | sample type |
|---|---|---|---|---|
| AA-KA | 0.8909 | 10 | 0.000101 | High CRP |
| AA-KA | 0.5877 | 20 | 0.004025 | Low CRP |
| KYN-AA | 0.5570 | 20 | 0.007087 | Low CRP |
| AA-QA | 0.7057 | 10 | 0.010338 | High CRP |
| KYN-AA | 0.6783 | 10 | 0.015322 | High CRP |
| KA-QA | 0.6543 | 10 | 0.020957 | High CRP |
| KYN-KA | 0.6412 | 10 | 0.024635 | High CRP |
degrees of freedom, df = n-2, n = number of patient samples;.
values reported as Pearson’s-p test is significant at p<0.01 for the first three correlation pairs and p<0.05 for the last four correlation pairs, n = 12 in high CRP and n = 22 in low CRP.
4. Conclusions
A reliable and repeatable OT-CEC-ESI-MS/MS method was developed using a sulfonated capillary prepared by graft co-polymerization. Six upstream metabolites, three downstream and three related metabolites, as well as the simultaneous separation of all nine KP metabolites were optimized for a total run time of 26, 30 and 113 min, respectively. To the best of our knowledge, this is the first reported application for the simultaneous separation of the entire nine metabolites of KP.
Precision for intra-day and inter-day repeatability of retention time was acceptable for all analytes and ranged from 1 to 2% and 1–7%, respectively. The exceptions were HAA, XA, and QA, where % RSD was borderline acceptable. For peak area, the intra-day and inter-day repeatability varied from 2 to 15% and 6–16%, respectively. Relative IDL sensitivity for intra-day and inter-day repeatability ranged from 4 to 8% RSD and 6–11% RSD, respectively, for all metabolites except for XA. Using the same mobile phase conditions, the AMPS column retains peak integrity, even after 200 injections. In future experiments, modifying the functional group on the surface of the covalent bonded capillary column may further improve the peak shape, resulting in higher repeatability of migration time and peak area.
The method was validated on a commercial human plasma. Analytical figures of merit such as linearity, recovery, accuracy, and assay precision were suitable for the intended purpose. The experimental LOD and experimental LOQ for all nine KP metabolites were in the range of 31–1000 nM and 100–10,000 nM, respectively. The endogenous concentration measurements of KP metabolites are mostly consistent with the previous studies. Typically, out of the five metabolites measured, three metabolites (TRP, KYN and KA) showed levels that match well with the literature value. In contrast, some differences were found for AA and QA endogenous levels.
The ultimate goal of this optimized CEC-ESI-MS/MS method was to determine the concentration of KP metabolites in the human plasma sample with low and high inflammation. At time t1, the reported plasma level was significantly different and range from 3.9 ± 0.2 μM to 5.1 ± 0.2 μM for KYN, from 221 ± 7 nM to 243 ± 6 nM for AA, 119 ± 4 nM to 144 ± 4 nM for KA and 1000 ± 44 nM to 890 ± 12 nM for QA in low and high inflammation, respectively as determined by CRP and TNF-α. At time t2, a similar trend was observed for all metabolites mentioned above except for QA, where there was no significant difference in plasma level of low vs. high inflammation. Besides individual metabolite concentration, the statistical correlation was also found for several metabolite pairs. For example, a significant mean difference is observed in the case of AA/KYN for time t1 and AA/TRP, KA/KYN for time t2. In terms of Pearson’s rank correlation coefficient, the plasma AA-KA metabolite pair provided the highest correlation in high CRP as well as provide the highest statistical significance in both low and high CRP patients (Pearson’s p < 0.01). Significant metabolite pairs with r value >0.55 were: KYN-AA (r = 0.5570, p = 0.0071) in low CRP and AA-QA (r = 0.7057, p = 0.0103), KYN-AA (r = 0.6783, p = 0.0153), KA-QA (r = 0.6543, p = 0.0209) and KYN-KA (r = 0.6412, p = 0.0246) in high CRP. Nevertheless, here, we followed a modest goal in providing statistical correlation among few KP metabolite concentrations and test their significance. Future studies should provide a detailed analysis for a large population for the correlation levels of neuroprotective and neurotoxic KP metabolites, which will pave the way for potential drug formulation.
The established OTCEC-MS/MS method has the following principal advantages for quantifying inflammation in human plasma: (1) chromatographic separation with highly selective MRM ensure rugged assay for clinical samples; (2) the sample preparation and clean up process is straightforward; (3) no derivatization of the metabolites is necessary for analysis and the procedure only requires a minimal plasma volume (100 μL) with nL injections; (4) method validation meets the primary requirements established by the FDA.
Supplementary Material
Acknowledgments
The authors gratefully acknowledge the financial support for this project by the National Institutes of Health (1 R21 MH107985–01).
Footnotes
Declaration of Competing Interest
All authors of this manuscript declare that they have no known competing conflict of interests that may have influenced the research data reported in this paper.
Supplementary materials
Supplementary material associated with this article can be found, in the online version, at doi:10.1016/j.chroma.2021.462294.
References
- [1].Fuertig R, Ceci A, Camus SM, Bezard E, Luippold AH, Hengerer B, LC–MS/MS based quantification of kynurenine metabolites, tryptophan, monoamines and neopterin in plasma, cerebrospinal fluid and brain, Bioanalysis 8 (2016) 1903–1917 https://pubmed.ncbi.nlm.nih.gov/27524289. [DOI] [PubMed] [Google Scholar]
- [2].Metz R, Duhadaway JB, Kamasani U, Laury-Kleintop L, Muller AJ, Prendergast GC, Novel tryptophan catabolic enzyme IDO2 is the preferred biochemical target of the antitumor indoleamine 2,3-dioxygenase inhibitory compound D-1-methyl tryptophan, Cancer Res. 67 (2007) 7082–7087 https://cancerres.aacrjournals.org/content/67/15/7082. [DOI] [PubMed] [Google Scholar]
- [3].Ball HJ, Jusof FF, Bakmiwewa SM, Hunt NH, Yuasa HJ, Tryptophan catabolizing enzymes – party of three, Front. Immunol 485 (2014) 1–10 https://doi.org/, doi: 10.3389/fimmu.2014.00485. [DOI] [PMC free article] [PubMed] [Google Scholar]
- [4].Moffett JR, Namboodiri MA, Tryptophan and the immune response, Immunol. Cell Biol 81 (2003) 247–265 https://onlinelibrary.wiley.com/doi/full/10.1046/j.1440-1711.2003.t01. [DOI] [PubMed] [Google Scholar]
- [5].Phillips RS, Structure and mechanism of kynureninase, Arch. Biochem. Biophys 544 (2014) 69–74 https://www.sciencedirect.com/science/article/pii/S0003986113003408. [DOI] [PubMed] [Google Scholar]
- [6].Ueda T, Otsuka H, Goda K, Ishiguro I, Naito J, Kotake Y, The metabolism of [carboxyl-14C] anthranilic acid. I. The incorporation of radioactivity into NAD+ and NADP+, J. Biochem 84 (1978) 687–696 https://academic.oup.com/jb/article-abstract/84/3/687/2186097. [DOI] [PubMed] [Google Scholar]
- [7].Parsons CG, Danysz W, Quack G, Hartmann S, Lorenz B, Wollenburg C, Baran L, Przegalinski E, Kostowski W, Krzascik P, Chizh B, Headley PM, Novel systemically active antagonists of the glycine site of the N-methyl-D-aspartate receptor: electrophysiological, biochemical, and behavioral characterization, J. Pharmacol. Exp. Ther 283 (1997) 1264–1275 https://jpet.aspetjournals.org/content/283/3/1264. [PubMed] [Google Scholar]
- [8].Hilmas CC, Pereira EF, Alkondon M, Rassoulpour A, Schwarcz R, Albuquerque EX, The brain metabolite kynurenic acid inhibits alpha7 nicotinic receptor activity and increases non-alpha7 nicotinic receptor expression: physiopathological implications, J. Neurosci 21 (2001) 7463–7473 https://www.jneurosci.org/content/21/19/7463. [DOI] [PMC free article] [PubMed] [Google Scholar]
- [9].Wang J, Simonavicius N, Wu X, Swaminath G, Reagan J, Tian H, Ling L, Kynurenic acid as a ligand for orphan G protein-coupled receptor GPR35, J. Biol. Chem 281 (2006) 22021–22028 https://www.jbc.org/content/281/31/22021. [DOI] [PubMed] [Google Scholar]
- [10].Pinto JT, Krasnikov BF, Alcutt S, Jones ME, Dorai T, Villar MT, Artigues A, Li J, Cooper AJL, Kynurenine aminotransferase III and glutamine transaminase L are identical enzymes that have cysteine S-conjugate beta-lyase activity and can transaminate L selenomethionine, J. Biol. Chem 289 (2014) 30950–30961 https://www.jbc.org/content/289/45/30950. [DOI] [PMC free article] [PubMed] [Google Scholar]
- [11].Nematollahi A, Sun G, Jayawickrama GS, Church WB, Kynurenine aminotransferase isozyme inhibitors: a review, Int. J. Mol. Sci 17 (2016) 1–22 https://doi.org/, doi: 10.3390/ijms17060946. [DOI] [PMC free article] [PubMed] [Google Scholar]
- [12].Han Q, Cai T, Tagle DA, Li J, Structure, expression, and function of kynurenine aminotransferases in human and rodent brains, Cell. Mol. Life Sci 67 (2010) 353–368 https://link.springer.com/article/10.1007/s00018-009-0166-4. [DOI] [PMC free article] [PubMed] [Google Scholar]
- [13].Lugo-Huitron R, Muniz PU, Pineda B, Pedraza-Chaverri J, Rios C, Perez-De La Cruz V, Quinolinic acid: an endogenous neurotoxin with multiple targets, Oxid. Med. Cell. Longev 104024 (2013) 1–14 https://doi.org/, doi: 10.1155/2013/104024. [DOI] [PMC free article] [PubMed] [Google Scholar]
- [14].Jhamandas KH, Boegman RJ, Beninger RJ, Miranda AF, Lipic KA, Excitotoxicity of quinolinic acid: modulation by endogenous antagonists, Neurotox. Res 2 (2000) 139–155 https://link.springer.com/article/10.1007/BF03033790. [DOI] [PubMed] [Google Scholar]
- [15].Stone TW, Darlington LG, Endogenous kynurenines as targets for drug discovery and development, Nat. Rev. Drug Discov 1 (2002) 609–620 https://www.nature.com/articles/nrd870. [DOI] [PubMed] [Google Scholar]
- [16].Pérez-De La Cruz V, Köningsberg M, Santamaría A, Kynurenine pathway and disease: an overview, CNS Neurol. Disord. Drug Targets 6 (2007) 398–410 https://www.ingentaconnect.com/content/ben/cnsnddt/2007/00000006/00000006/-art00004. [DOI] [PubMed] [Google Scholar]
- [17].Chen Y, Guillemin GJ, Kynurenine pathway metabolites in humans: disease and healthy states, Int. J. Tryptophan Res 2 (2009) 1–19 https://doi.org/, doi: 10.4137/IJTR.S2097. [DOI] [PMC free article] [PubMed] [Google Scholar]
- [18].Schwarcz R, The kynurenine pathway of tryptophan degradation as a drug target, Curr. Opin. Pharmacol 4 (2004) 12–17 https://www.sciencedirect.com/science/article/abs/pii/S1471489203002029. [DOI] [PubMed] [Google Scholar]
- [19].Eckstein JA, Ammerman GM, Reveles JM, Ackermann BL, Simultaneous profiling of multiple neurochemical pathways from a single cerebrospinal fluid sample using GC/MS/MS with electron capture detection, J. Mass Spectrom 43 (2008) 782–790 https://onlinelibrary.wiley.com/doi/10.1002/jms.1376. [DOI] [PubMed] [Google Scholar]
- [20].Notarangelo FM, Wu HQ, Macherone A, Graham DR, Schwarcz R, Gas chromatography/tandem mass spectrometry detection of extracellular kynurenine and related metabolites in normal and lesioned rat brain, Anal. Biochem 421 (2011) 573–581 https://www.sciencedirect.com/science/article/pii/-S0003269711008037. [DOI] [PMC free article] [PubMed] [Google Scholar]
- [21].Wang X, Davis I, Liu A, Miller A, Shamsi SA, Improved separation and detection of picolinic acid and quinolinic acid by capillary electrophoresis-mass spectrometry: application to analysis of human cerebrospinal fluid, J. Chromatogr. A 1316 (2013) 147–153 https://www.sciencedirect.com/science/article/pii/S0021967313015793. [DOI] [PMC free article] [PubMed] [Google Scholar]
- [22].Dazzi C, Candiano G, Massazza S, Ponzetto A, Varesio L, New high-performance liquid chromatographic method for the detection of picolinic acid in biological fluids, J. Chromatogr. B 751 (2001) 61–68 https://www.sciencedirect.com/science/article/pii/S0378434700004503. [DOI] [PubMed] [Google Scholar]
- [23].Hervé C, Beyne P, Jamault H, Delacoux E, Determination of tryptophan and its Kynurenine pathway metabolites in human serum by high-performance liquid chromatography with simultaneous ultraviolet and fluorimetric detection, J. Chromatogr. B. Biomed. Sci. Appl 675 (1996) 157–161 10.1016/0378-4347(95)00341. [DOI] [PubMed] [Google Scholar]
- [24].Vignau J, Jacquemont MC, Lefort A, Imbenotte M, Lhermitte M, Simultaneous determination of tryptophan and kynurenine in serum by HPLC with UV and fluorescence detection, Biomed. Chromatogr 18 (2004) 872–874 10.1002/bmc.445. [DOI] [PubMed] [Google Scholar]
- [25].Vaarmann A, Kask A, Mäeorg U, Novel and sensitive high-performance liquid chromatographic method based on electrochemical coulometric array detection for simultaneous determination of catecholamines, kynurenine and indole derivatives of tryptophan, J. Chromatogr. B 769 (2002) 145–153 10.1016/S1570-0232(01)00639-0. [DOI] [PubMed] [Google Scholar]
- [26].de Jong WH, Smit R, Bakker SJ, de Vries EG, Kema IP, Plasma tryptophan, kynurenine and 3-hydroxykynurenine measurement using automated on-line solid phase extraction HPLC tandem mass spectrometry, J. Chromatogr. B 877 (2009) 603–609 10.1016/j.jchromb.2009.01.015. [DOI] [PubMed] [Google Scholar]
- [27].Möller M, Du Preez JL, Harvey BH, Development and validation of a single analytical method for the determination of tryptophan and its kynurenine metabolites in rat plasma, J. Chromatogr. B 898 (2012) 121–129 https://www.sciencedirect.com/science/article/pii/S1570023212002553. [DOI] [PubMed] [Google Scholar]
- [28].Amirkhani A, Rajda C, Arvidsson B, Bencsik K, Boda K, Seres E, B, Markides KE, Vécsei L, Bergquist J, Interferon-β affects the tryptophan metabolism in multiple sclerosis patients, Eur. J. Neurol 12 (2005) 625–631 https://onlinelibrary.wiley.com/doi/full/10.1111/j.14681331.2005.01041. [DOI] [PubMed] [Google Scholar]
- [29].Yamada K, Miyazaki T, Shibata T, Hara N, Tsuchiya M, Simultaneous measurement of tryptophan and related compounds by liquid chromatography electrospray ionization tandem mass spectrometry, J. Chromatogr. B. Biomed. Life Sci 867 (2008) 57–61 https://www.sciencedirect.com/science/article/pii/S1570023208001712. [DOI] [PubMed] [Google Scholar]
- [30].Liao X, Zhu J, Rubab M, Feng Y, Poon R, An analytical method for the measurement of acid metabolites of tryptophan-NAD pathway and related acids in urine, J. Chromatogr. B 878 (2010) 1003–1006 https://www.sciencedirect.com/science/article/pii/S1570023210001029. [DOI] [PubMed] [Google Scholar]
- [31].Geiger M, Hogerton AL, Bowser MT, Capillary electrophoresis, Anal. Chem 84 (2012) 577–596 https://pubs.acs.org/doi/10.1021/ac203205a. [DOI] [PubMed] [Google Scholar]
- [32].Chankvetadze B, Enantioseparations by using capillary electrophoretic techniques. The story of 20 and a few more years, J. Chromatogr. A 1168 (2007) 45–70 https://www.sciencedirect.com/science/article/pii/S0021967307013441. [DOI] [PubMed] [Google Scholar]
- [33].Fanali S, Chiral separations by CE employing CDs, Electrophoresis 30 (2009) 203–210 https://onlinelibrary.wiley.com/doi/full/10.1002/elps.200900056. [DOI] [PubMed] [Google Scholar]
- [34].Preinerstorfer B, Lämmerhofer M, Lindner W, Advances in enantioselective separations using electromigration capillary techniques, Electrophoresis 30 (2009) 100–132 https://onlinelibrary.wiley.com/doi/abs/10.1002/elps.200600411. [DOI] [PubMed] [Google Scholar]
- [35].Ramautar R, Demirci A, Jong GJD, Capillary electrophoresis in metabolomics, Trends Anal. Chem 25 (2006) 455–466 https://www.sciencedirect.com/science/article/pii/S016599360600040.9. [Google Scholar]
- [36].Shamsi SA, Miller BE, Capillary electrophoresis-mass spectrometry: recent advances to the analysis of small achiral and chiral solutes, Electrophoresis 25 (2004) 3927–3961 https://onlinelibrary.wiley.com/doi/10.1002/elps.200406131. [DOI] [PubMed] [Google Scholar]
- [37].Ramautar R, Somsen GW, Jong GJD, CE-MS for metabolomics: developments and applications in the period 2014–2016, Electrophoresis 38 (2017) 190–202 https://onlinelibrary.wiley.com/doi/full/10.1002/elps.201000378. [DOI] [PMC free article] [PubMed] [Google Scholar]
- [38].Weber PL, Malis M, Palmer SD, Klein TL, Lunte SM, Capillary zone electrophoresis separation of tryptophan and its metabolites, including quinolinic acid, J. Chromatogr. B Biomed. Sci Appl 697 (1997) 263–268 https://www.sciencedirect.com/science/article/pii/S0378434797000947. [DOI] [PubMed] [Google Scholar]
- [39].Tenorio-López FA, Valle-Mondragón L, Martínez-Lazcano JC, Sánchez Mendoza A, Ríos C, Pastelín-Hernández G, Pérez-Severiano F, CZE Determination of quinolinic acid in rat brain tissue and plasma, Chromatographia 65 (2007) (2007) 725–731 https://link.springer.com/article/10.1365/s10337-007-0241-7. [Google Scholar]
- [40].Malone MA, Zuo H, Lunte SM, Smyth MR, Determination of tryptophan and Kynurenine in brain microdialysis samples by capillary electrophoresis with electrochemical detection, J. Chromatogr. A 700 (1995) 73–80 https://www.sciencedirect.com/science/article/pii/002196739401191G. [Google Scholar]
- [41].Arvidsson B, Johannesson N, Citterio A, Righetti PG, Bergquist J, High throughput analysis of tryptophan metabolites in a complex matrix using capillary electrophoresis coupled to time-of-flight mass spectrometry, J. Chromatogr. A 1159 (2007) 154–158 https://www.sciencedirect.com/science/article/pii/S0021967307007492. [DOI] [PubMed] [Google Scholar]
- [42].Wang X, Davis I, Liu A, Shamsi SA, Development of a capillary zone electrophoresis-electrospray ionization-mass spectrometry assay with a sulfonated capillary for profiling picolinic acid and quinolinic acid formation in Multienzyme System, Electrophoresis 34 (2013) 1828–1835 https://www.ncbi.nlm.nih.gov/pmc/articles/PMC4153595. [DOI] [PMC free article] [PubMed] [Google Scholar]
- [43].Dong J, Ou J, Dong X, Wu R, Ye M, Zou H, Preparation and evaluation of rigid porous polyacrylamide-based strong cation-exchange monolithic columns for capillary electrochromatography, J. Sep. Sci 30 (2007) 2986–2992 https://www.onlinelibrary.wiley.com/toc/16159314/2007/30/17. [DOI] [PubMed] [Google Scholar]
- [44].Hewavitharana AK, Abu Kassim NS, Shaw PN, Standard addition with internal standardization as an alternative to using stable isotope labelled internal standards to correct for matrix effects-Comparison and validation using liquid chromatography- tandem mass spectrometric assay of vitamin D, J. Chromatogr. A 1553 (2018) 101–107 https://pubmed.ncbi.nlm.nih.gov/29680744/07. [DOI] [PubMed] [Google Scholar]
- [45].Wells G, Prest H, RussIV CW, Why use signal-to-noise as a measure of ms performance when it is often meaningless? Tech. Overv. Agilent (2011) https://www.agilent.com/cs/library/technicaloverviews/public/5990-8341EN.pdf. [Google Scholar]
- [46].pH and Buffers , http://www.csun.edu/~jm77307/pH%20and%20Buffers.pdf (accessed 23 2019).
- [47].PubChem, Benzene compound summary https://pubchem.ncbi.nlm.nih.gov/compound/benzene (accessed July 23 2019).
- [48].PubChem, Indole compound summary. https://pubchem.ncbi.nlm.nih.gov/compound/indole (accessed July 23 2019).
- [49].PubChem, Quinoline compound summary. https://pubchem.ncbi.nlm.nih.gov/compound/quinoline (accessed July 23 2019).
- [50].PubChem, Pyridine compound summary. https://pubchem.ncbi.nlm.nih.gov/compound/pyridine (accessed July 23 2019).
- [51].Functional groups and chemistry of the macromolecules. https://cnx.org/contents/QLDFAxbb@1/Bis2A-2-1-Functional-Groups-andchemistry-of-the-Macromolecules (accessed July 30 2019).
- [52].A formula to calculate the net charge of a molecule with an indefinite number of acid-base groups https://iubmb.onlinelibrary.wiley.com/templates/jsp/_ux3/_pericles/pdf-viewer/-web/viewer.html?file=/doi/pdfdirect/10.1016/0307-4412%2886%29901767#page=4 (accessed November 15 2020).
- [53].Möller M, Du Preez JL, Harvey BH, Development and validation of a single analytical method for the determination of tryptophan and its kynurenine metabolites in rat plasma, J. Chromatogr. B Biomed. Life Sci 898 (2012) 121–129. [DOI] [PubMed] [Google Scholar]
- [54].US DHHS, FDA and CDER Guidance For Industry, Bioanalytical Method Validation, 2001. Available from: http://www/fda.gov/cder/guidance/index.htm.
- [55].Psychogios N, Hau DD, Peng J, Guo AC, Mandal R, Bouatra S, Sinelnikov I, Krishnamurthy R, Eisner R, Gautam B, Young N, Xia J, Knox C, Dong E, Huang P, Hollander Z, Pedersen TL, Smith SR, Bamforth F, Greiner R, McManus B, Newman JW, Goodfriend T, Wishart DS, The human serum metabolome, PLoS ONE 6 (2011) 1–23 10.1371/journal.pone.0016957. [DOI] [PMC free article] [PubMed] [Google Scholar]
- [56].Hervé C, Beyne E, Jamault H, Delacoux E, Determination of tryptophan and it kynurenine pathway metabolites in human serum by high-performance liquid chromatography with simultaneous ultraviolet and fluorimetric detection, J. Chromatogr. B 898 (2012) 121–129. [DOI] [PubMed] [Google Scholar]
- [57].Duranton F, Cohen G, De Smet R, Rodriguez M, Jankowski J, Vanholder R, Argiles A, European uremic toxin work group, normal and pathologic concentrations of uremic toxins, J. Am. Soc. Nephrol. JASN 23 (2012) 1258–1270. [DOI] [PMC free article] [PubMed] [Google Scholar]
- [58].Smythe GA et al. , Ecni GC-MS Analysis of picolinic and quinolinic acids and their amides in human plasma, csf, and brain tissue, in: Allegri G, Costa CVL, Ragazzi E, Steinhart H, Varesio L (eds) Developments in Tryptophan and Serotonin Metabolism, Advances in Experimental Medicine and Biology, vol 527. Springer, Boston, MA, 2003. doi: 10.1007/978-1-4615-0135-0_83. [DOI] [PubMed] [Google Scholar]
- [59].Chocano-Bedoya PO, Mirzaei F, O’Reilly EJ, Lucas M, Okereke OI, Hu FB, Rimm EB, Ascherio A, C-reactive protein, interleukin-6, soluble tumor necrosis factor α-receptor 2 and incident clinical depression, J. Affect Disord 163 (2014) 25–32. [DOI] [PMC free article] [PubMed] [Google Scholar]
Associated Data
This section collects any data citations, data availability statements, or supplementary materials included in this article.