

Abstract
Despite recent advances in imaging for myocardial deformation, left ventricular ejection fraction (LVEF) is still the most important index for systolic function in daily practice. Its role in multiple fields (e.g., valvular heart disease, myocardial infarction, cancer therapy-related cardiac dysfunction) has been a mainstay in guidelines. In addition, assessment of LVEF is vital to clinical decision-making in patients with heart failure. However, notable limitations to LVEF include poor inter-observer reproducibility dependent on observer skill, poor acoustic windows, and variations in measurement techniques. To solve these problems, methods for standardization of LVEF by sharing reference images among observers and artificial intelligence for accurate measurements have been developed. In this review, we focus on the standardization of LVEF using reference images and automated LVEF using artificial intelligence.
Keywords: Ejection fraction, Artificial intelligence, Echocardiography, Machine learning
Introduction
Despite recent advances in imaging for myocardial deformation, left ventricular ejection fraction (LVEF) is still the most important index for systolic function in daily practice. Its role in multiple fields (e.g., valvular heart disease, myocardial infarction, cancer therapy-related cardiac dysfunction) has been a mainstay in guidelines [1–3]. For example, in the case of heart failure with reduced ejection fraction, renin-angiotensin system (RAS) inhibitors or beta-blockers have been shown to improve the prognosis. On the other hand, routine administration of RAS inhibitors or beta-blockers is not recommended for heart failure with preserved ejection fraction [4]. This is a typical example in which LVEF is an important index in cardiovascular clinical practice. However, notable limitations to LVEF include poor inter-observer reproducibility dependent on observer skill, poor acoustic windows, and variations in measurement techniques [5]. To solve these problems, methods for standardization of LVEF by sharing reference images among observers and artificial intelligence for accurate measurements have been developed.
In addition, due to an aging population and the prevalence of lifestyle-related diseases, the number of patients who visit hospitals for cardiovascular diseases is very high. In the intensive care unit, there are cases in which it is necessary to make a visual judgment of function using echocardiographic images due to time constraints. Recently, in an environment with a rapidly increasing number of confirmed/suspected COVID-19 patients, non-specialists, such as emergency physicians, are more likely required to perform this examination in the infection control room [6]. Development of an automatic analysis tool for echocardiographic images is desired as a decision support system.
In this review, we focus on the standardization of LVEF using reference images and automated LVEF using artificial intelligence (AI).
Measurement of LVEF
LVEF is an index of LV contractility that indicates the degree of change in LV volume from diastole to systole. It is calculated by subtracting the end-systolic LV volume from the end-diastolic LV volume and dividing it by the end-diastolic LV volume. There is no definitive consensus on the normal value, as it is affected by age, gender, race, measurement method, and so forth. Based on the guidelines of the American Society of Echocardiography and reports from Japan, the lower limit of normal for LVEF is set at around 50% in many institutions [7–9]. Several methods have been proposed to measure LVEF with echocardiography (Fig. 1). A comparison of the advantages between different techniques for the measurement of LVEF is shown in Table 1. The most common quantitative method is the biplane disk-summation method. In this method, the LV is divided into 20 disks along the long axis. The volume is calculated from the sum of the cross-sectional areas of the disks using the long axis and the short axis of each disk. In clinical practice, the LV volume is calculated by tracing the LV endocardium in 4-chamber and 2-chamber views at the end-systolic and end-diastolic phases.
Fig. 1.

Calculation of left ventricular ejection fraction using M-mode, B-mode, and 3-dimensional echocardiography. In the guidelines, if applicable, 3D echocardiography is recommended to measure left ventricular ejection fraction. LV left ventricle, LA left atrium
Table 1.
Comparison of advantages and disadvantages between different techniques for measurement of ejection fraction
| Methods | Availability | Assumptions | Reproducibility | Speed |
|---|---|---|---|---|
| Eyeball | Always | Dependent on observer skill | Low | Instant |
| M-mode | Widely used | Dependent on geometric assumptions | Low/modest | Quick |
| B-mode | Generally used | Minimizes mathematic assumptions | Low/modest | Needs tracing |
| 3D | Readily available | Independent of geometric assumptions | High | Dependent on machine |
| AI | Not yet | Black box | High | Dependent on machine |
3D 3-dimensional, AI artificial intelligence
Reproducibility of LVEF
Cardiac magnetic resonance (CMR) imaging represents the gold standard in the quantification of LVEF. The reproducibility of CMR measurements is superior to echocardiography in most studies [10–12] The biplane disk-summation method using echocardiography has a measurement error of approximately 10% for LVEF [13]. In the field of cancer therapy-related cardiac dysfunction, this value is equal to a diagnostic criterion (10% decrease from baseline). Small changes in LVEF may not necessarily represent true changes due to reproducibility issues [14]. In addition, a large variability in LVEF measurements may occur at different centers, and therapies may be confounded when decisions are made based solely on LVEF. Against this backdrop, a reproducible method is necessary for the measurement of LVEF.
Eyeball LVEF
Eyeball EF is the “appearance EF”, which is the LVEF estimated by experience based on the appearance (size and movement) of the LV. The guideline of the American Society of Echocardiography clearly states that the biplane-disk method should be used to evaluate LVEF [9]. On the other hand, the guideline of the American Society of Intensive Care Medicine states that LV function should be qualitatively evaluated in intensive care settings [15]. The limitations of eyeball EF are that it is dependent on the experience of the examiner and it has relatively poor reproducibility. The results of our previous multicenter study involving 13 centers showed that eyeball EF varied from center to center, with five of the 13 centers differing by more than 3% in the absolute value of LVEF (Fig. 2) [16].
Fig. 2.

Overestimation and underestimation of visual LVEF between laboratories in Japan. Six laboratories overestimated visual EF, and seven laboratories underestimated visual EF compared with reference values. Two laboratories modestly overestimated and three laboratories modestly underestimated (bold)
Several papers have reported a quality assessment program in a clinical setting [17, 18]. The investigators used reference cases as a standard to reduce inter-observer variability. Reference LVEFs were provided by echocardiographic expert reviews. In these studies, intervention with reference images could improve the reproducibility of visually estimated LVEF [17, 19, 20]. In our previous multicenter study, we prepared reference images of three apex cross-sectional images from 20 to 70% EF and showed that the inter-institutional variability could be reduced to less than 3% by using the reference images. In addition, a learning session using reference images also resulted in less misclassifications of LVEF, especially in mild to moderately impaired LVEF, regardless of observers’ experience [16]. These results suggest that a simple learning session with reference images can minimize inter-observer variability and misclassification in practitioners with varied experience.
Reliability and accuracy are separate aspects of echocardiographic measurements. When you get the same incorrect answer all the time, a result can be reliable and inaccurate. We can use shooting at a target as an example to clarify the definitions of reliability and accuracy. Figure 3 shows all combinations of reliability and accuracy. Some ideas can be implemented to improve accuracy and reliability. If we can get a stable trace line of LV with practice, the reliability will improve. Furthermore, a learning system for accurate EF using reference images will increase accuracy. Based on this theory, we believe that learning with reference images can help to increase accuracy in measurements of LVEF.
Fig. 3.

Reliability vs accuracy. Novice observers often had inaccurate and low precision of measurements. Expert observers sometimes had high precision and inaccurate measurements
Automated LVEF
Automated LVEF is key to improving reproducibility. There are various steps required to measure LVEF automatically (Fig. 4).
Identification of the end-diastolic and end-systolic phases from the ECG.
Detection of the boundary between the cardiac cavity and the myocardium.
Tracking the endocardial boundary.
Calculation of LV volumes at end-diastole and end-systole.
Fig. 4.

Steps of LVEF measurement. The process of LVEF measurement involves four steps
Trials have been conducted to automatically measure LVEF using combinations of these steps. However, because of the variation in position and size of the heart, the technology for automatic LV tracing using the pattern matching method has limitations in tracking. In addition, it is not always possible to obtain a clear image of the cardiac cavity boundary in all patients. To overcome this issue, a tracing method called "knowledge-based systems" has been developed, which calculates the most appropriate tracing line by installing a database of multiple cases and tracing examples. This has made it possible to draw the optimal trace line with high accuracy. In a global multicenter study of fully automated software for calculating LVEF, a relatively high correlation coefficient of about 0.7–0.8 was obtained [21, 22]. On the other hand, one of the limitations of knowledge-based algorithms is that even in cases with good image quality, the similarity of data may result in incorrect tracing. For example, Fig. 5 shows a case of fully automated tracing of the LV using Auto EF, but a large tracing line was drawn from the left to the right ventricle because the ventricle was not identified properly by the algorithm. This is a field where further improvement in accuracy is expected with AI algorithms.
Fig. 5.

A case of fully automated tracing of the left ventricular cavity using auto EF algorithm. A large tracing line was drawn from the left to the right ventricle because the ventricle was not identified properly. RV right ventricle, LV left ventricle
AI for LVEF
In recent years, with the development of computer technology, the accuracy of automated diagnosis of medical images by machine learning has been improved. In 2012, deep learning was shown to have high accuracy in image classification, where the computer learns the features extracted by repeated trials. Deep learning can be regarded as a type of machine learning, but its potential as a self-encoding and universal approximator has led to more accurate results than conventional machine learning [23, 24]. This algorithm was combined with the development of highly sophisticated techniques for the prevention of overlearning and gradient vanishing. It is now possible to obtain more accurate results than traditional machine learning [25–30]. Deep learning does not require the setting of feature values by humans, and by learning many supervised data, it is becoming possible for “computer eyes to judge medical images” (Fig. 6). This process seems to be the learning process of “human eyes to judge medical images” and may be particularly useful in the field of diagnosis by visual appearance (e.g., eyeball LVEF).
Fig. 6.

Conventional artificial intelligence (AI) and new AI. In conventional artificial intelligence (AI), left ventricular volumes should be calculated to measure the left ventricular ejection fraction (LVEF). In deep learning, left ventricular volumes can be directly estimated without tracking the endocardial borders
When we apply the deep learning algorithm to estimate LVEF, there are many problems in the echocardiographic data. For examples, there are differences in echocardiographic images between different venders, making it necessary to output the common image parts from DICOM data. We should consider which parts of the image should be analyzed as input data. After obtaining the image location, image size, number of images, frame rate, and heart rate from the DICOM tag information, the image is extracted based on the location information. Unnecessary information (such as the name of the hospital and date and time) included outside the echocardiographic image should be removed. The image size is standardized and reduced by rescaling and resampling pixels. For image standardization, there are many issues to be considered, such as which portions should be cropped, whether it is necessary to adjust the scale, and what size is appropriate [31].
Since LVEF is measured by left ventricular volume in end-diastole and end-systole, it may be possible to predict LVEF by the two time periods. However, there is a possibility of improving the accuracy by using more images for training, and it is necessary to try a method that incorporates time series data. We created a three-dimensional CNN (3DCNN) model using 340 echocardiographic videos labeled with the LVEF calculated by experts. This 3DCNN model consists of convolutional and pooling layers with an input of 10 echocardiographic images per heartbeat, and finally outputs a continuous value from 0 to 1 by a sigmoid function through all coupling layers. The model was validated in a cohort independent from the one used for training, and the correlation coefficient was 0.92 (p < 0.001), indicating that the model was able to predict LVEF with high accuracy by using echocardiographic images (Fig. 7) [32].
Fig. 7.
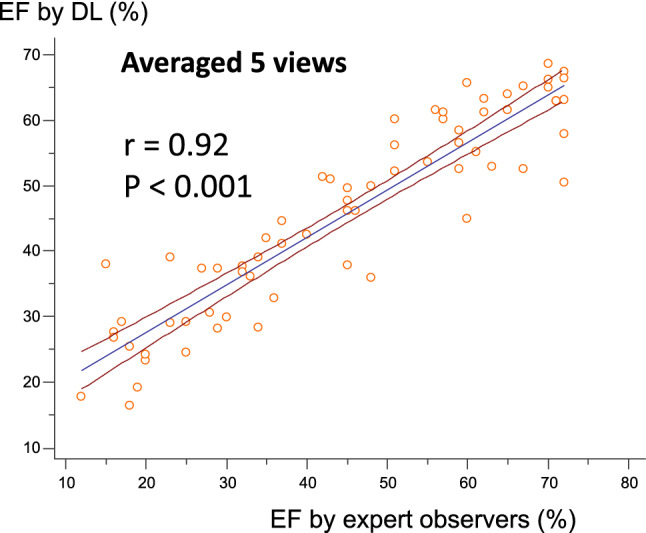
Correlation between ejection fraction (EF) by deep learning (DL) and by expert observers. The correlation is excellent in the independent cohort
In principle, it is possible to calculate LVEF using only 2-chamber and 4-chamber views, but in daily practice, the practitioner must also refer to other echocardiographic views. Therefore, it is expected that the accuracy of LVEF can be improved by adding 3ch, short, and long-axis images. The 95% prediction error calculated from the 5-section average root-mean-square-error by the 3DCNN model is about 14%, while the prediction accuracy of LVEF via segmentation using U-net is about 20% [33, 34]. Direct estimation of LVEF by 3DCNN seemed to be better. The accuracy of the 3DCNN model was AUC > 0.99 when the LVEF was divided into LVEF > 50% and LVEF < 50% [32]. Since LVEF is an important index for deciding the course of treatment in emergency heart failure, the model may be useful in clinical practice when making rapid treatment decisions.
Further refinement of the method is expected by increasing the number of echocardiographic images. In response to these preliminary results, the Japan Society of Ultrasonics in Medicine and the Society of Echocardiography, with support from the Japan Agency for Medical Research and Development (AMED) (Fig. 8), have jointly started to create a database in which videos of 2- and 4-chamber images and their associated LVEF values are recorded. Using this large amount of data, it is thought that it is possible to create a highly accurate LVEF prediction model.
Fig. 8.

Japan Agency for Medical Research and Development (AMED)-supported projects. The Japan Society of Ultrasonics in Medicine (JSUM) and the Japanese Society of Echocardiography started to gather images from multiple centers. NCVC National Cerebral and Cardiovascular Center
Conclusions
LVEF is an important index for visual evaluation. However, there are some limitations when measuring LVEF due to poor inter-observer reproducibility, limited acoustic windows, and variations in measurement techniques. It is likely to be a good match for deep learning that captures the characteristics of images. Recently, several studies have demonstrated automated quantification of ejection fraction from echocardiographic acquisitions [32–34]. We hope that the AI technology will transfer to the clinical setting [35].
Funding
No funding.
Declarations
Conflict of interest
The authors have no conflicts of interest to declare.
Ethical approval
All procedures followed were in accordance with the ethical standards of the responsible committee on human experimentation (institutional and national) and with the Helsinki Declaration of 1964 and later versions.
Footnotes
Publisher's Note
Springer Nature remains neutral with regard to jurisdictional claims in published maps and institutional affiliations.
References
- 1.Izumi C, Eishi K, Ashihara K, et al. JCS/JSCS/JATS/JSVS 2020 guidelines on the management of valvular heart disease. Circ J. 2020;84:2037–2119. doi: 10.1253/circj.CJ-20-0135. [DOI] [PubMed] [Google Scholar]
- 2.Doherty JU, Kort S, Mehran R, et al. ACC/AATS/AHA/ASE/ASNC/HRS/SCAI/SCCT/SCMR/STS 2017 appropriate use criteria for multimodality imaging in valvular heart disease: a report of the American college of cardiology appropriate use criteria task force, American association for thoracic surgery, American heart association, american society of echocardiography, American society of nuclear cardiology, heart rhythm society, society for cardiovascular angiography and interventions, society of cardiovascular computed tomography, society for cardiovascular magnetic resonance, and society of thoracic surgeons. J Am Coll Cardiol. 2017;70:1647–1672. doi: 10.1016/j.jacc.2017.07.732. [DOI] [PubMed] [Google Scholar]
- 3.Nagueh SF, Smiseth OA, Appleton CP, et al. Recommendations for the evaluation of left ventricular diastolic function by echocardiography: an update from the american society of echocardiography and the european association of cardiovascular imaging. J Am Soc Echocardiogr. 2016;29:277–314. doi: 10.1016/j.echo.2016.01.011. [DOI] [PubMed] [Google Scholar]
- 4.Tsutsui H, Isobe M, Ito H, et al. JCS 2017/JHFS 2017 guideline on diagnosis and treatment of acute and chronic heart failure—digest version. Circ J. 2019;83:2084–2184. doi: 10.1253/circj.CJ-19-0342. [DOI] [PubMed] [Google Scholar]
- 5.Bunting KV, Steeds RP, Slater LT, et al. A Practical guide to assess the reproducibility of echocardiographic measurements. J Am Soc Echocardiogr. 2019;32:1505–1515. doi: 10.1016/j.echo.2019.08.015. [DOI] [PubMed] [Google Scholar]
- 6.Kusunose K. Steps to use artificial intelligence in echocardiography. J Echocardiogr. 2020 doi: 10.1007/s12574-020-00496-4. [DOI] [PMC free article] [PubMed] [Google Scholar]
- 7.Daimon M, Watanabe H, Abe Y, et al. Normal values of echocardiographic parameters in relation to age in a healthy Japanese population: the JAMP study. Circ J. 2008;72:1859–1866. doi: 10.1253/circj.CJ-08-0171. [DOI] [PubMed] [Google Scholar]
- 8.Fukuda S, Watanabe H, Daimon M, et al. Normal values of real-time 3-dimensional echocardiographic parameters in a healthy Japanese population: the JAMP-3D Study. Circ J. 2012;76:1177–1181. doi: 10.1253/circj.CJ-11-1256. [DOI] [PubMed] [Google Scholar]
- 9.Lang RM, Badano LP, Mor-Avi V, et al. Recommendations for cardiac chamber quantification by echocardiography in adults: an update from the American Society of Echocardiography and the European Association of Cardiovascular Imaging. J Am Soc Echocardiogr. 2015;28:1–39 e14. doi: 10.1016/j.echo.2014.10.003. [DOI] [PubMed] [Google Scholar]
- 10.Hoffmann R, von Bardeleben S, ten Cate F, et al. Assessment of systolic left ventricular function: a multi-centre comparison of cineventriculography, cardiac magnetic resonance imaging, unenhanced and contrast-enhanced echocardiography. Eur Heart J. 2005;26:607–616. doi: 10.1093/eurheartj/ehi083. [DOI] [PubMed] [Google Scholar]
- 11.Karamitsos TD, Hudsmith LE, Selvanayagam JB, et al. Operator induced variability in left ventricular measurements with cardiovascular magnetic resonance is improved after training. J Cardiovasc Magn Reson. 2007;9:777–783. doi: 10.1080/10976640701545073. [DOI] [PubMed] [Google Scholar]
- 12.Maffei E, Messalli G, Martini C, et al. Left and right ventricle assessment with cardiac CT: validation study vs. Card MR Eur Radiol. 2012;22:1041–1049. doi: 10.1007/s00330-011-2345-6. [DOI] [PMC free article] [PubMed] [Google Scholar]
- 13.Thavendiranathan P, Grant AD, Negishi T, et al. Reproducibility of echocardiographic techniques for sequential assessment of left ventricular ejection fraction and volumes: application to patients undergoing cancer chemotherapy. J Am Coll Cardiol. 2013;61:77–84. doi: 10.1016/j.jacc.2012.09.035. [DOI] [PubMed] [Google Scholar]
- 14.Onishi T, Fukuda Y, Miyazaki S, et al. Practical guidance for echocardiography for cancer therapeutics-related cardiac dysfunction. J Echocardiogr. 2021;19:1–20. doi: 10.1007/s12574-020-00502-9. [DOI] [PMC free article] [PubMed] [Google Scholar]
- 15.Levitov A, Frankel HL, Blaivas M, et al. Guidelines for the appropriate use of bedside general and cardiac ultrasonography in the evaluation of critically ill patients—part II: cardiac ultrasonography. Crit Care Med. 2016;44:1206–1227. doi: 10.1097/CCM.0000000000001847. [DOI] [PubMed] [Google Scholar]
- 16.Kusunose K, Shibayama K, Iwano H, et al. Reduced variability of visual left ventricular ejection fraction assessment with reference images: the Japanese Association of Young Echocardiography Fellows multicenter study. J Cardiol. 2018;72:74–80. doi: 10.1016/j.jjcc.2018.01.007. [DOI] [PubMed] [Google Scholar]
- 17.Johri AM, Picard MH, Newell J, et al. Can a teaching intervention reduce interobserver variability in LVEF assessment. JACC Cardiovasc Imaging. 2011;4:821–829. doi: 10.1016/j.jcmg.2011.06.004. [DOI] [PubMed] [Google Scholar]
- 18.Wu W-CH, Frikha Z, Girerd N, et al. Reproducibility in echocardiographic assessment of diastolic function in a population based study (The STANISLAS Cohort Study) PLoS ONE. 2015;10:e0122336. doi: 10.1371/journal.pone.0122336. [DOI] [PMC free article] [PubMed] [Google Scholar]
- 19.Akinboboye O, Sumner J, Gopal A, et al. Visual estimation of ejection fraction by two-dimensional echocardiography: the learning curve. Clin Cardiol. 1995;18:726–729. doi: 10.1002/clc.4960181208. [DOI] [PubMed] [Google Scholar]
- 20.Thavendiranathan P, Popović ZB, Flamm SD, et al. Improved interobserver variability and accuracy of echocardiographic visual left ventricular ejection fraction assessment through a self-directed learning program using cardiac magnetic resonance images. J Am Soc Echocardiogr. 2013;26:1267–1273. doi: 10.1016/j.echo.2013.07.017. [DOI] [PubMed] [Google Scholar]
- 21.Leung KE, Bosch JG. Automated border detection in three-dimensional echocardiography: principles and promises. Eur J Echocardiogr. 2010;11:97–108. doi: 10.1093/ejechocard/jeq005. [DOI] [PubMed] [Google Scholar]
- 22.Yang L, Georgescu B, Zheng Y et al. A fast and accurate tracking algorithm of left ventricles in 3D echocardiography. Proceedings/IEEE international symposium on biomedical imaging: from nano to macro IEEE international symposium on biomedical imaging: NIH Public Access. 2008; p.221 [DOI] [PMC free article] [PubMed]
- 23.Schmidhuber J. Deep learning in neural networks: an overview. Neural Netw. 2015;61:85–117. doi: 10.1016/j.neunet.2014.09.003. [DOI] [PubMed] [Google Scholar]
- 24.LeCun Y, Bengio Y, Hinton G. Deep learning. Nature. 2015;521:436–444. doi: 10.1038/nature14539. [DOI] [PubMed] [Google Scholar]
- 25.Kusunose K, Haga A, Abe T, et al. Utilization of artificial intelligence in echocardiography. Circ J. 2019;83:1623–1629. doi: 10.1253/circj.CJ-19-0420. [DOI] [PubMed] [Google Scholar]
- 26.Johnson KW, Soto JT, Glicksberg BS, et al. Artificial intelligence in cardiology. J Am Coll Cardiol. 2018;71:2668–2679. doi: 10.1016/j.jacc.2018.03.521. [DOI] [PubMed] [Google Scholar]
- 27.Dey D, Slomka PJ, Leeson P, et al. Artificial intelligence in cardiovascular imaging: JACC state-of-the-art review. J Am Coll Cardiol. 2019;73:1317–1335. doi: 10.1016/j.jacc.2018.12.054. [DOI] [PMC free article] [PubMed] [Google Scholar]
- 28.Lessmann N, van Ginneken B, Zreik M, et al. Automatic calcium scoring in low-dose chest CT using deep neural networks with dilated convolutions. IEEE Trans Med Imaging. 2018;37:615–625. doi: 10.1109/TMI.2017.2769839. [DOI] [PubMed] [Google Scholar]
- 29.van Hamersvelt RW, Zreik M, Voskuil M, et al. Deep learning analysis of left ventricular myocardium in CT angiographic intermediate-degree coronary stenosis improves the diagnostic accuracy for identification of functionally significant stenosis. Eur Radiol. 2019;29:2350–2359. doi: 10.1007/s00330-018-5822-3. [DOI] [PMC free article] [PubMed] [Google Scholar]
- 30.Zhang N, Yang G, Gao Z, et al. Deep learning for diagnosis of chronic myocardial infarction on nonenhanced cardiac cine MRI. Radiology. 2019;291:606–617. doi: 10.1148/radiol.2019182304. [DOI] [PubMed] [Google Scholar]
- 31.Kusunose K, Haga A, Inoue M, et al. Clinically feasible and accurate view classification of echocardiographic images using deep learning. Biomolecules. 2020;10:665. doi: 10.3390/biom10050665. [DOI] [PMC free article] [PubMed] [Google Scholar]
- 32.Kusunose K, Haga A, Yamaguchi N, et al. Deep learning for assessment of left ventricular ejection fraction from echocardiographic images. J Am Soc Echocardiogr Off Publ Am Soc Echocardiogr. 2020 doi: 10.1016/j.echo.2020.01.009. [DOI] [PubMed] [Google Scholar]
- 33.Zhang J, Gajjala S, Agrawal P, et al. Fully automated echocardiogram interpretation in clinical practice. Circulation. 2018;138:1623–1635. doi: 10.1161/CIRCULATIONAHA.118.034338. [DOI] [PMC free article] [PubMed] [Google Scholar]
- 34.Asch FM, Poilvert N, Abraham T, et al. Automated echocardiographic quantification of left ventricular ejection fraction without volume measurements using a machine learning algorithm mimicking a human expert. Circ Cardiovasc Imaging. 2019;12:e009303. doi: 10.1161/CIRCIMAGING.119.009303. [DOI] [PMC free article] [PubMed] [Google Scholar]
- 35.Kusunose K, Haga A, Abe T, et al. Utilization of artificial intelligence in echocardiography. Circulation J. 2019 doi: 10.1253/circj.CJ-19-0420. [DOI] [PubMed] [Google Scholar]