

Abstract
Commercial airport activity can adversely impact air quality in the vicinity of airports, and millions of people live close to major airports in the United States. Because of these potential impacts, a systematic literature review was conducted to identify peer reviewed literature on air quality near commercial airports and assess the quality of the studies. The systematic review included reference database searches in PubMed, Web of Science, and Google Scholar, inclusive of years 2000 through 2020. We identified 3,301 articles, and based on the inclusion and exclusion criteria developed, seventy studies were identified for extraction and evaluation using a combination of supervised machine learning and manual screening techniques. These studies consistently showed that ultrafine particulate matter (UFP) is elevated in and around airports. Furthermore, many studies show elevated levels of particulate matter under 2.5 microns in diameter (PM2.5), black carbon, criteria pollutants, and polycyclic aromatic hydrocarbons as well. Finally, the systematic review, while not focused on health effects, identified a limited number of on-topic references reporting adverse health effects impacts, including increased rates of premature death, pre-term births, decreased lung function, oxidative DNA damage and childhood leukemia. More research is needed linking particle size distributions to specific airport activities, and proximity to airports, characterizing relationships between different pollutants, evaluating long-term impacts, and improving our understanding of health effects.
Keywords: Turbine Engine Emissions, Air Monitoring, Air Quality Modeling, Ultrafine particulate matter
1. Introduction
A recent study by Yim et al (2015) assessed global, regional and local health impacts of civil aviation emissions, using modeling tools that address environmental impacts at different spatial scales. The study attributed approximately 16,000 premature deaths per year globally to global aviation emissions, with 87% attributable to particulate matter under 2.5 microns in diameter (PM2.5). The study concludes that about a third of these mortalities are attributable to PM2.5 exposures within 20 kilometers of an airport. While there are considerable uncertainties associated with such estimates, these results suggest that in addition to the contributions of PM2.5 emissions to regional air quality, impacts on public health of these emissions in the vicinity of airports are an important concern. The study did not address relative contributions of specific components of PM2.5, such as black carbon (BC), and size fractions, such as ultrafine particulate matter (UFP), which contribute to the adverse health impacts resulting from exposure to the PM2.5 mixture (U. S. EPA, 2019).
A literature review was conducted in 2015 by the Airport Cooperative Research Program (ACRP; Kim et al., 2015), and focused on a wide range of peer reviewed sources, including university research as well as authoritative sources such as state agencies, the Federal Aviation Administration (FAA) and airport monitoring programs. Since the publication of the 2015 ACRP literature review, a number of studies conducted in the U. S. have been published which concluded that UFP concentrations are elevated downwind of commercial airports, and that proximity to an airport also increases particle number concentrations within residences. Particle number concentrations (PNC) are often measured as a proxy for UFP. This is because UFP is usually defined as particles with a diameter of less than 100 nanometers (nm), and most of the particle number concentration is below 100 nm. ACRP plans to update this review.
In addition to emissions from turbine engine aircraft, other sources, including piston engine aircraft, ground support equipment, and vehicle traffic all contribute to pollution levels in the vicinity of commercial airports. Turbine engine aircraft in particular emit large amounts of UFP. The UFP attributable to aircraft emissions has been associated with lung inflammation in individuals with asthma (Habre et al., 2018). In addition, He et al. (2018) found that particle composition, size distribution and internalized amount of particles all contributed to promotion of reactive organic species in bronchial epithelial cells.
Airport air pollution can also disproportionately impact sensitive subpopulations. Henry et al. (2019) studied impacts of several California airports on surrounding schools and found that over 65,000 students spend 1 to 6 hours a day during the academic year being exposed to airport pollution, and the percentage of impacted students was higher for those who were economically disadvantaged. Rissman et al. (2013) studied PM2.5 at the Hartsfield-Jackson Atlanta International Airport and found that the relationship between minority population percentages and aircraft-derived particulate matter was found to grow stronger as concentrations increased.
Although there is a significant body of research on air quality impacts in the vicinity of airports and the potential for adverse health effects from UFP, a systematic literature review of recent research on impacts of commercial airport emissions on air quality in close proximity to airports has not been conducted. Application of systematic review methods to air pollution issues was recently discussed in Lam et al. (2020). Lam et al. point out that while a narrative review can provide a comprehensive overview of the scientific literature, a systematic review evaluates the literature in a systematic, transparent, and reproducible manner. This approach reduces the potential for bias and can help mitigate potential perception of “cherry-picking” data. Thus, we conducted a systematic review to achieve the following objectives:
Identify peer reviewed literature on air quality near commercial airports
Assess the quality of the studies, and
Summarize evidence of pollutants most impacted and most likely health risks.
The focus of this systematic review was impacts of commercial airports dominated by jet aircraft activity; thus, studies that focused on ground service equipment or piston engine activity were excluded. Moreover, since this study did not focus on piston engine aircraft, emission impacts of lead due to its use as an additive in aircraft gasoline was not addressed.
2.0. Methods
The criteria used to select search terms and guide inclusion and exclusion of studies for this systematic review are presented below in Table 1.
Table 1.
Inclusion/exclusion criteria.
| Metric | Criteria | |
|---|---|---|
| Include if: | Exclude if: | |
| 1. Pollutant type | Contains particulate matter or a chemical pollutant other than lead. | Does not contain particulate matter or a chemical pollutant. Or The pollutant is lead. |
| 2. Data type |
On-Topic1 Contains a data type listed below: -Measured ambient air concentrations -Regression model ambient air concentrations -Dispersion Air Quality Modeling (Examples: AERMOD, CALPUFF, SCICHEM, ADMS-Airport, LASPORT) Supplemental1 Does not contain an on-topic data type, but contains a supplemental data type listed below: - Airplane emissions, emission rates, and emission inventories -Indoor air concentrations (intrusion) -Personal air monitoring (residential or occupational) -Daily exposure estimates (mg/day) and doses (mg/kg/day) -Health impacts -Health risks |
Does not contain an on-topic or supplemental data type of interest. Exclude examples include: -Regional modeling -Global modeling -Emissions and emission rate for non-aircraft activities (ground support) |
| 3. Geographic location | U.S. or International | n/a |
| 4. Airport type | Commercial and reliever airports (i.e., turbine or jet engine aircraft) | Not a commercial or reliever airport, such as military |
| 5. Distance from airport | At and within 20 km of airport |
>20 km from airport |
Included studies with an on-topic data type underwent data extraction and evaluation and were considered for inclusion in the summary of finding. Included studies with a supplemental data type were not further evaluated because they are considered out of scope.
The initial literature was conducted using reference database searches in PubMed, Web of Science, and Google Scholar. Results from these sources were deduplicated to produce a unique set of 3,287 articles. An additional 14 references were also identified from relevant articles. The reference database search began with creating sets of keywords related to emissions, airports, and measurements based on the selection criteria in Table 1, with database-specific modifications as needed. For a citation to be included, the citation had to meet the search strategy for each keyword set. The basic limits applied for all databases included English language only and a date range of 2000 to 2020. For Web of Science, research areas were also limited to those most likely to contain relevant data. Following the literature search relevant literature was identified using the inclusion and exclusion criteria (Table 1) in three screening steps: supervised clustering using text analytics, title/abstract (TiAb) screening, and full-text screening. As depicted in Figure 1, 70 studies were ultimately selected for extraction and evaluation.
Figure 1.
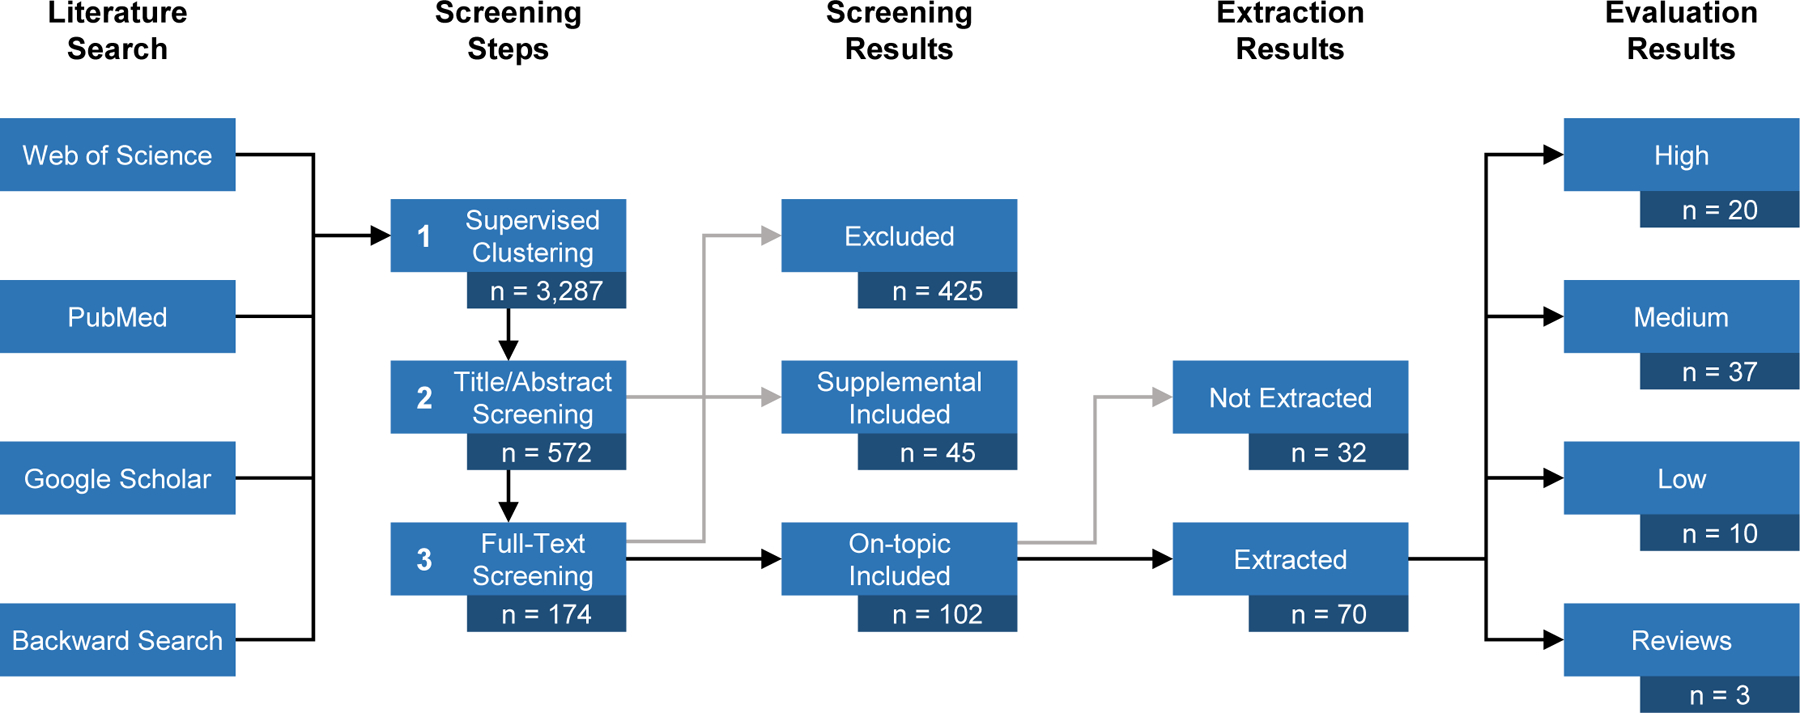
Systematic review literature flow diagram.
The first screening step, supervised clustering, was conducted using ICF International’s Document Classification and Topic Extraction Resource , DoCTER, which clusters studies that are expected to be more similar to one another using seed studies to inform automated text analysis of the titles and abstracts (Varghese et al., 2018). This screening step resulted in 558 articles that were predicted as “includes” based on relevance to the search criteria. The second screening step involved manual title/abstract screening of 572 references (558 articles from the initial literature search and 14 from background search) in the program litstreamtm (Lam et al., 2020). Articles were tagged as “On-Topic Include”, “Supplemental Include”, or “Exclude” per the criteria in Table 1. The screening was conducted by a single reviewer, with quality assurance review of approximately 10% of the studies by a second independent reviewer. At this step, 174 studies were tagged as on-topic “Includes”. The third screening step, also conducted in litstreamtm, involved screening the full-text articles of the on-topic “Include” references from title/abstract screening. Portable document format (PDF) versions were obtained for 154 of 174 articles. On-topic references were re-classified as “On-Topic Include”, “Supplemental Include”, or “Exclude” as necessary. After full-text screening, the total number of articles classified as “On-Topic Include”, “Supplemental Include”, or “Exclude” were 102, 45, and 425, respectively.
While 102 references were tagged as “On-Topic Include” after TiAB or full-text screening, 70 U.S. and European articles were prioritized for extraction. Articles which were not extracted included those not available in PDF, some references which were more than 3 years old, and those identified from a backward search. In addition, some references which did not have PDFs to facilitate full text screening were also excluded. Extraction was conducted using litstreamtm and involved recording the following information:
Study type: Primary or Review
Supplemental data type: Emissions, Indoor Air, Personal Monitoring, Health
Pollutant name
Metric: Mass concentration, Particle number concentration (PNC), Particle size distribution (PSD)
Ambient air data type: Monitoring, Dispersion Model, Statistical/Regression Model
Health data type: Health Effect, Intake, Risk
Is air quality impacted?
Is health impacted?
Airport Name, State, Country
Sample location: On-Airport or Off-Airport
Contextual information: Airport Operation or Aircraft Data (presence or absence)
Source attribution: Take-off/landing, APU, run-up, other
A list of the extracted studies is included in the supplemental information. In addition, Figure 2 provides a heatmap of studies by publication year. Articles that were extracted were also evaluated using the criteria in Table 2 to assess data reliability, relevance, and robustness. Each article was assigned an overall rating of High (n = 20), Medium (n = 37), or Low (n = 10). Review articles (n=3) were not rated. It is important to remember that when integrating the articles into an assessment for a particular purpose, the importance of each individual criterion may vary. Also, these ratings were based on level of peer review and publication in a scholarly format; however, such ratings are subjective since publication decisions can be affected by decisions other than quality of investigations (Wells and Little, 2009). Furthermore, it should be noted that while we ranked studies with longer duration monitoring higher, studies that include extensive monitoring over a shorter time period can provide data with valuable insights.
Figure 2.
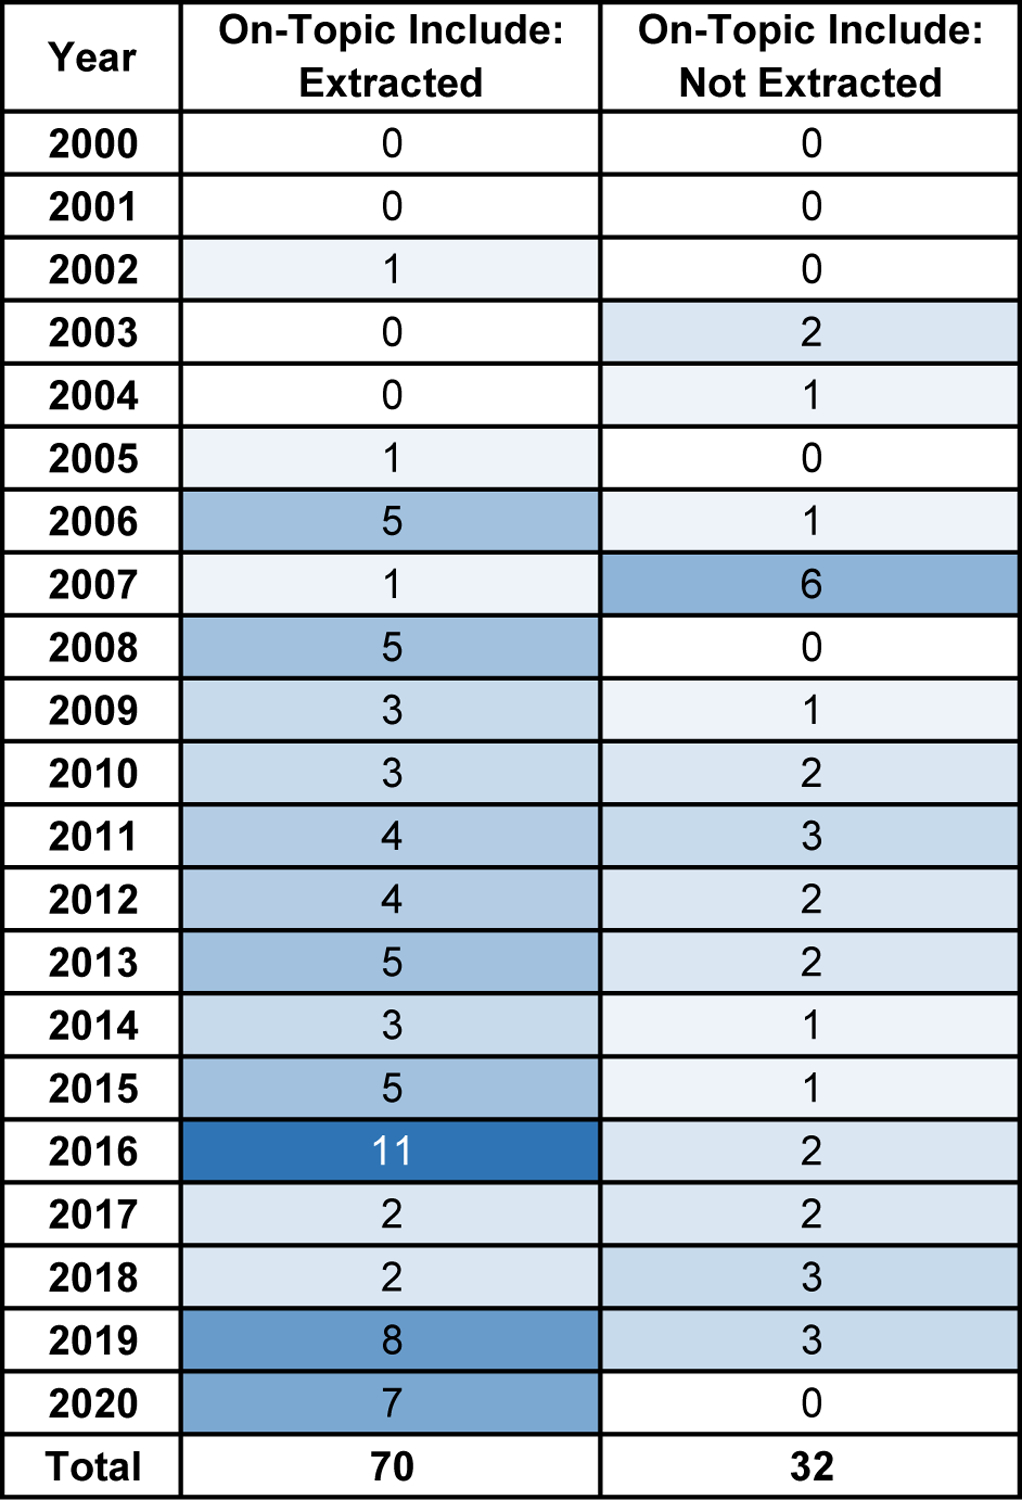
Heatmap of studies by publication year.
Table 2.
Data quality criteria.
| Metrica | Rating | Criteria |
|---|---|---|
| Data Reliability | ||
| Source of Data (all) |
Low | • Conference proceedings • Published journal articles from peer or non-peer reviewed journals that lack a scholarly formatb. |
| Medium | • Pre-published peer-reviewed journal articles • Published journal articles that are not peer-reviewed, but follow a scholarly formatb. • Non-peer-reviewed government reports or databases |
|
| High | • Published peer-reviewed journal articles • Peer-reviewed government reports or databases |
|
| Not Reliable (all) |
Unacceptable | • Newspapers and magazines containing news • Editorials, letters to the editor, book reviews |
| Relevance and Robustness | ||
| Uncertainty Analysis (all) |
Low | • Limited or no uncertainty analysis |
| Medium | • --- | |
| High | • Robust qualitative or quantitative uncertainty analysis | |
| Temporal (all) |
Low | • Sampling or modeling conducted over 0 to <3 months |
| Medium | • Sampling or modeling conducted over ≥ 3 months to <12 months | |
| High | • Sampling or modeling conducted over ≥12 months (long term) | |
| Spatial (all) |
Low | • Off-airport only and not in immediate vicinity of aircraft |
| Medium | • On-airport grounds, but not in immediate vicinity of aircraft | |
| High | • Immediate vicinity of aircraft, as well as on grounds and off airport | |
| Background (all) |
Low | • Analysis did not consider background levels. |
| Medium | • --- | |
| High | • Analysis considered background levels | |
| Source Attribution (all) |
Low | • No source attribution |
| Medium | • Qualitative discussion of source attribution | |
| High | • Quantitatively attributed to specific sources at airport | |
| Sampling, Analytical, and/or Modeling Methodology (all) |
Low |
Monitoring • Outdated data collection or analysis methods, or • Limited sampling and analytical methodology information provided. Modeling • Model is not widely accepted or is not described in enough to detail to assess applicability to scenario, or • Only limited model inputs discussed. |
| Medium | • --- | |
| High |
Monitoring • Current data collection/analysis/modeling methods and • Robust sampling and analytical methodology information provided Modeling • Widely accepted or sound model that is germane to scenario and inputs are well described as to their basis. |
|
| Model Evaluation (model only) |
Low | • Limited or no model evaluation |
| Medium | • --- | |
| High | •Model has been evaluated through peer review, corroboration with monitoring data, and/or benchmarking against other models. | |
| Reporting (all) |
Low | • Only limited summary statistics (i.e., only mean and standard deviation or regressions) or incomplete summary statistics (i.e., missing number of samples) are reported and no raw data is provided. |
| Medium | • --- | |
| High | • Extensive summary statistics are reported or raw data is provided. | |
3.0. Results and Discussion
This systematic literature review corroborates many findings of the 2015 literature review conducted by the ACRP, in particular that UFP is highly elevated at the airport and persists downwind. Of the 70 selected studies, 33 were conducted in the U. S. These airports are listed in Table 3. In addition, Figure 3 provides a heatmap of studies by pollutant and country. Twelve studies focused on one airport, LAX. Three were reliever rather than commercial airports (Santa Monica, Hartford, and Teterboro). Fifty of the selected studies included monitoring results, 21 included dispersion modeling, 18 included statistical analyses, and health effects were reported in 11. Furthermore, on-airport air monitoring and/or modeling was conducted for about 50% of the studies, whereas off-airport monitoring (within 20 km) and/or modeling was conducted in about 70% of the studies.
Table 3.
U.S. Airports represented in this systematic review.
| City | Airport | Locid | |
|---|---|---|---|
| CA | Burbank | Bob Hope | BUR |
| CA | Los Angeles | Los Angeles International | LAX |
| CA | San Francisco | San Francisco International | SFO |
| CA | San Jose | Norman Y Mineta San Jose International | SJC |
| CA | Santa Monica | Santa Monica Municipal | SMO |
| CT | Hartford | Hartford-Brainard | HFD |
| GA | Atlanta | Hartsfield-Jackson Atlanta International | ATL |
| MA | Boston | General Edward Lawrence Logan International | BOS |
| NJ | Teterboro | Teterboro | TEB |
| NV | Las Vegas | McCarran International | LAS |
| NY | Albany | Albany International | ALB |
| NY | New York | Laguardia | LGA |
| RI | Providence | Theodore Francis Green State | PVD |
| TX | Dallas-Fort Worth | Dallas-Fort Worth International | DFW |
| VA | Roanoke | Roanoke-Blacksburg Regional/Woodrum Field | ROA |
Figure 3.

Heatmap of studies by pollutant and country.
3.1. Ultrafine Particulate Matter
A number of early studies (2003 to 2011) found elevated UFP concentrations at fixed site monitor locations (Westerdahl et al., 2008; Zhu et al., 2011; Hsu et al., 2013 , 2014; Hu et al., 2009; Choi et al., 2013; Klapmeyer and Marr, 2012). U. S. studies conducted in the last ten years showed similar results to earlier studies, although they tended to examine air quality further away from the airport using mobile monitoring or dispersion modeling (Hudda et al, 2014, 2016, 2018, 2020; Hudda and Fruin; 2016; Riley et al., 2016; Yu et al., 2019; Shirmohammadi et al., 2017). These studies focused on Los Angeles International, Hartsfield-Jackson in Atlanta, and Logan Airport in Boston. Several of these studies (Hudda et al., 2014; Shirmohammadi et al., 2017; Hudda et al., 2020) showed concentrations under landing approach paths several times background concentrations. Similar results were found outside the U. S. (Stacey et al., 2020; Masiol et al., 2017; (Keuken et al., 2015; Pirhadi et al.; 2020) Since this review, two more studies with similar findings have been published (Austin et al., 2021; Ungeheuer et al., 2021; Zhang et al., 2020).
Hudda et al. (2018) investigated PNC inside and outside 16 residences in the Boston metropolitan area. They found elevated PNC within several kilometers of Boston Logan International Airport (BOS). They also found that aviation related PNC infiltrated indoors and resulted in significantly higher indoor PNC. In another study in the vicinity of Logan airport, Hudda et al. (2016) analyzed PNC impacts of aviation activities. They found that at sites 4.0 and 7.3 km from the airport, average PNCs were 2 and 1.33-fold higher, respectively, when winds were from the direction of the airport compared to other directions, indicating that aviation impacts on PNC extend many kilometers downwind of Logan airport. Furthermore, PNCs were positively correlated with flight activity after taking meteorology, time of day and week, and traffic volume into account. This correlation was not found with other pollutants. Similarly, Hudda and Fruin (2016) found that PNC was higher in areas under landing jet trajectories. Finally, they used a diffusion charging instrument to simulate alveolar lung deposition, and found a five-fold increase in deposited surface area concentration 2 to 3 kilometers downwind from the airport, decreasing to two-fold 18 km downwind. Riley et al. (2016) took extensive measurements in neighborhoods around Los Angeles International Airport and Hartsfield-Jackson International Airport in Atlanta. They found a 3 to 5-fold increase in PNCs in transects under landing approach pathways. Shirmhammadi et al. (2017) also took measurements at Los Angeles International Airport (LAX) and found PNCs were four times greater adjacent to the airport than on nearby major freeways. Stacey (2019) conducted a literature survey and concluded that the literature consistently reports PNCs close to airports are significantly higher than locations distant and upwind of airports, and that the particle size distribution is different from traditional road traffic, with more extremely fine particles. Results of a monitoring study of communities near Seattle-Tacoma International Airport was also recently released (University of Washington, 2019). It also found higher levels of UFP near the airport. Furthermore, the impacted area was larger than at near roadway sites. The PM associated with aircraft landing activity was also smaller with lower black carbon concentrations than near-roadway samples.
3.2. PM2.5 and PM10
The majority of studies that address the criteria pollutant PM focus on PM2.5 or smaller particles. The levels found in airport measurement studies vary, ranging from relatively low levels to those that are close to or exceeding the NAAQS. In addition, results are less consistent than for UFP.
At LAX in 2005–2006, Zhu et al. (2011) observed that daily mean PM2.5 concentrations collected up to 600 m from the take-off runway were significantly greater (p < 0.001) than at a background site. However, Shirmohammadi et al. (2017) observed PM2.5 concentrations were generally lower at LAX than inside freeways within the impact zone, although, as mentioned in the introduction, particle number concentrations were greater. At Santa Monica Municipal (SMO) mobile monitoring conducted by Choi et al. (2013) in 2008 and 2011 showed comparable or lower concentrations in a residential neighborhood 120–480 m predominately downwind of SMO as compared to a neighborhood located in perpendicular wind to the airport. Similarly, Hudda et al. (2020) observed that PM2.5 concentrations were not elevated during impact-sector winds relative to non-impact-sector winds at a residence approximately 1.3 km from BOS. Higher PM2.5 concentrations were observed from a wind direction that indicated long-range transport of aerosols from regional sources upwind. PM2.5 was not correlated with flight activity, suggesting PM2.5 was primarily from sources other than aircraft. Air quality modeling studies (Rissman et al., 2013; Woody et al., 2016) indicate higher PM2.5 concentrations near airports. In London, however, two measurement studies at Heathrow Airport showed similar or lower concentrations at the airport than in central London (Stacey et al. 2020; Masiol et al., 2017).
3.3. Black Carbon
Studies indicate that black carbon (BC) is elevated in the vicinity of airports, as far away as 10 km. Westerdahl et al. (2008) and Zhu et al. (2011) observed elevated BC at take-off downwind of LAX. BC is emitted by a variety of combustion sources in addition to aircraft. Westerdahl et al. calculated a 12-fold increase in BC immediately downwind of the airport, although concentrations were comparable or lower than observed at nearby freeways. Zhu et al. (2011) observed that BC decreased markedly with increasing distance from the runway because of atmospheric dispersion processes, however elevated levels were still observed at 600 m downwind as compared to background. Furthermore, at Logan Airport, Hudda et al. (2020) observed that, in contrast to the PM2.5 results discussed above, BC was 1.3-fold elevated during impact-sector winds than non-impact-sector winds at a residence sampled 1.3 km from the airport in 2017. Finally, at T.F. Green Airport, Dodson et al. (2009) developed regression models which found that aircraft activity contributed 24 to 28% of the total BC based on measurements in 2005–2006 from five sites located 0.16 to 3.7 km from the airport. However, international studies have not shown a clear association (Masiol et al., 2017; Kueken et al., 2015, Pirhadi et al., 2020).
3.4. Gaseous Criteria Pollutants
In general, most on-airport studies in the U. S. showed slightly elevated concentrations of gaseous criteria pollutants, specifically carbon monoxide (CO), nitrogen dioxide (NO2), and sulfur dioxide (SO2), even though concentrations are often still below national ambient air quality standards. Off-airport studies had more varied results, but some studies show aviation contributions up to 12 km from the airport. Moreover, nitrogen oxides are more likely to be elevated than sulfur or carbon oxides. Ground support equipment and motor vehicles also contribute to these pollutants, especially NO2 (as well as NO). Among the studies that address these pollutants, Hudda et al. (2020) observed at Logan airport that levels of oxides of nitrogen (NO, NO2, and NOx), and CO are significantly higher (1.1 to 1.9-fold elevations) in impact sector winds than non-impact sector winds. At up to 12 km from LAX, Hudda et al. (2014) observed elevated nitrogen oxides, with similar NO2 and particle number spatial patterns suggesting a common pollutant source. A number of other studies also showed elevated concentrations for one of more of these criteria pollutants (Riley et al., 2016, NO2; Choi et al., 2013, CO; Diez et al., 2012, NO2, CO, SO2). However, study results were inconclusive for some pollutants (Choi et al., 2013, NO; Hudda et al, 2014, CO and SO2; Adamkiewicz et al., 2010, NO2; Klapmeyer and Marr, 2012, CO2 and NO2). International studies also showed elevated levels of pollutants for many air pollutants (Carlslaw et al., 2012; Schurmann et al., 2007; Yu et al., 2004; Valotto and Varin, 2016; Sidimonetti et al., 2015; Masiol and Harrison, 2015).
3.5. Hazardous Air Pollutants
Very few studies assess hazardous air pollutants (HAPs), other than polycyclic aromatic hydrocarbons (PAHs). Past speciation work indicated formaldehyde and acetaldehyde make up a large percentage of total hydrocarbons from turbine engine aircraft (12 and 4 percent respectively); while earlier work characterized PAH emissions (U. S. EPA and U. S. FAA, 2009; U. S. EPA, 2009).
At LAX in 2003, Westerdahl et al. (2008) observed particle-phase polycyclic aromatic hydrocarbon (PM-PAH) concentrations two orders of magnitude higher at downwind location than upwind locations, although aircraft dominated areas showed lower PM-PAH than vehicular traffic areas. PM-PAH values observed at the site 500 m downwind of landings are only slightly elevated above the coastal background. In 2005, Zhu et al. (2011) reported ambient air concentrations for both particulate phase and vapor phase PAHs collected from the blast fence and at a control site. A greater amount of PAH mass was in the vapor phase than in the particle phase. The levels of vapor-phase PAH were consistently higher at the LAX blast fence than at background site. For both sites, naphthalene comprised 80 to 85% of the total vapor-phase PAH mass. The semi-volatile PAHs (from phenanthrene to chrysene) were consistently higher at the LAX blast fence than the background site, whereas, the high molecular weight PAHs (from benzo[a] pyrene to indeno[1,2,3-cd]pyrene) were lower at the blast fence than the background site.
In a residential area near SMO in California in 2008, markedly elevated concentration peaks of particle bound PAH (PB-PAH) were observed up to 600 m downwind of SMO and 250 m perpendicular to the prevailing wind directions. PB-PAH was associated with jet takeoffs but not with other aircraft operations such as idling, descents or takeoffs by reciprocal-engine aircrafts . During a freeway closure event near SMO in 2011, Choi et al. (2013) observed highly elevated PB-PAH ambient air concentration which were likely explained by jet take-offs. At a residential site 1.3 km from BOS, observed significantly higher PB-PAH concentrations in impact sector wind than non-impact-sector wind.
3.6. Health Effects
This systematic review only identified a limited number of on-topic references with health effects, impact or risk data (Figure 4). While this literature review was not intended to capture all relevant health effect studies, having focused on ambient air data, we summarize here the studies that were identified using our search parameters. Additionally, the systematic review focused on peer-reviewed articles from databases, rather than government or airport studies which may be more likely address public health issues. Potential endpoints identified in this literature review are as follows:
Figure 4.

Heatmap of studies by type of health data.
Yim et al. (2015) assessed global, regional and local health impacts of civil aviation emissions, using modeling tools that address environmental impacts at different spatial scales. The study attributed approximately 16,000 premature deaths per year globally to global aviation emissions, with 87% attributable to PM2.5. The study concludes that about a third of these mortalities are attributable to PM2.5 exposures within 20 kilometers of an airport.
Wing et al. (2020) evaluated whether UFPs from jet aircraft emissions are associated with increased rates of pre-term birth among pregnant mothers living within 15 km downwind of LAX. The study, consisted of 147,186 mothers who gave birth between 2008 a and 2016. The study concludes that aircraft emissions play an etiologic role, independent of noise and traffic-related pollution. Specifically, the odds ratio (OR) per interquartile range (IQR) increase relative to UFP exposure was 1.04.
Lammers et al. (2020) investigated respiratory and cardiopulmonary outcomes in 21 healthy adults who were repeatedly exposed to ambient air in a mobile laboratory set up 300 m from the runway at Amsterdam Schipol Airport (2 to 5 visits, 5 hours each). Total PNC was significantly associated with decreased lung function, primarily a decrease in forced vital capacity (FVC) and prolonged corrected QT (duration of ventricular repolarization corrected for heart rate). The authors observed small effects after only a single 5 hr exposure. These effects were mainly associated with particles < 20 nm.
At LAX, Hudda and Fruin (2016) measured alveolar lung deposited surface area (ALDSA), which is the fraction of lung deposited surface area (LDSA) deposited in the alveolar region of the lung. The particle number concentration increases in the areas impacted by LAX are accompanied by pronounced decreases in particle size and increases in ALDSA concentration.
Using ambient PM0.25 collected adjacent and downwind from LAX in 2016 as well as PM directly sampled from diluted exhaust of turbine and diesel engines, He et al. (2018) demonstrated adverse responses in human bronchial epithelial (16HBE) cells, specifically effects on cell viability/cytotoxicity, ROS activity and inflammatory mediators release. The paper suggested that elemental composition and oxidative potential of the PM samples seem to explain these biological responses.
Cavallo et al. (2006) characterized the exposure to several polyaromatic hydrocarbons (PAHs) and evaluated the genotoxic and oxidative effects in airport personnel (n=14) at Da Vinci airport in Rome, Italy. Air sample were collected at the airport apron, building, and terminal/office areas. Urine and blood samples were collected from exposed individuals (those that work in close proximity to the airport) and control individuals (those that work in the administrative offices of the airport). Genotoxic effects and early direct-oxidative DNA damage were evaluated by micronucleus and formamidopyrimidine DNA glycosylase (Fpg) modified comet assay (Shukla et al., 2011) on lymphocytes and exfoliated buccal cells, and by chromosomal aberrations and sister chromatid exchange analyses. Urinary OH-pyrene did not show differences between exposed and controls, although the controls may have low daily exposure to PAH. The results found an induction of sister chromatid exchange due to PAH exposure and an increase of total chromosomal aberrations. Senkayi, et al. (2014) evaluated whether there is an association between childhood leukemia cases and airport emissions in Texas over a 10-year period. The work concluded that an association exists based on 1) comparison of distance to airports with incidence ratios in census blocks, and 2) regression model to predict childhood leukemia incidences based on benzene emissions from various sources.
Recently, a systematic review of health effects associated with exposure to jet engine emissions in the vicinity of airports was published (Bendtsen et al., 2021). This study concluded that literature on health effects was sparse but jet engine emissions have physicochemical properties similar to diesel exhaust particles, and that exposure to jet engine emissions is associated with similar adverse health effects as exposure to diesel exhaust particles and other traffic emissions.
3.7. Data Strengths and Limitations
The papers identified in these studies consistently showed UFP is elevated in and around airports. The most recent studies have heavily focused on UFP and addressed gradients with increasing distance from airports. Furthermore, most of the studies addressed contributions from background and freeways, and at least qualitatively characterized airport and aircraft data with respect to air quality.
However, a lack of standard methods and instrumentation make comparisons of measured concentrations among studies difficult. In addition, there are very few long-term studies. Finally, only a few airports have been studied, making it difficult to provide broad generalizations when differences in airport and aircraft operations, geography, and meteorology have a significant impact on the results.
3.8. Recommendations for Future Work
This literature review underscores the need for research in a number of key areas:
Characterization of ambient particle size distribution from specific aircraft activities (i.e., take-off and landing). While research shows the near airport environment is a hotspot for PM2.5 and UFP, particle size distributions may vary spatially within that environment depending on where different types of activity occur. This spatial distribution (i.e. take-off and landing) needs to be better characterized.
Investigation of particle size distribution changes with increasing distance from the airport.
Attribution of concentrations to individual source types. For example, roadway traffic emissions from nearby freeways may make a significant contribution to ambient concentrations in the vicinity of airports.
Assessment of the relationship between UFP and other pollutants, especially HAPs.
Improvement of the understanding of the health effects and impacts of pollutants and disparate impacts on minority or disadvantaged communities as well as children.
Conducting long-term studies to capture variation in ambient concentrations across years and seasons.
Conducting studies at more airports to capture differences in airport source types (e.g., aircraft fleet mixes), source operations, airport layout and location, surrounding geography, and meteorology.
Supplementary Material
Footnotes
Publisher's Disclaimer: Disclaimer
The views expressed in this article are those of the authors and do not necessarily represent the views or policies of the U. S. Environmental Protection Agency.
References
- Adamkiewicz G, Hsu HH, Vallarino J, Melly SJ, Spengler JD, Levy JI, 2010. Nitrogen dioxide concentrations in neighborhoods adjacent to a commercial airport: a land use regression modeling study. Environ. Health 9: 73. 10.1186/1476-069x-9-73 [DOI] [PMC free article] [PubMed] [Google Scholar]
- Austin E, Xiang J, Gould T, Shirai J, Yun S, Yost M, Larson T, Seto E 2021. Distinct Ultrafine Particle Profiles Associated with Aircraft and Roadway Traffic. Environ. Sci. Technol 55: 2847–2858. 10.1021/acs.est.0c05933 [DOI] [PMC free article] [PubMed] [Google Scholar]
- Bendtsen KM, Bengtsen E, Saber A, Vogel U 2021. A review of health effects associated with exposure to jet engine emissions in and around airports. Environ. Health 20:10. 10.1186/s12940-020-00690-y [DOI] [PMC free article] [PubMed] [Google Scholar]
- Carslaw DC, Beevers SD, Ropkins K, Bell MC, 2006. Detecting and quantifying aircraft and other on-airport contributions to ambient nitrogen oxides in the vicinity of a large international airport. Atmos. Environ 40: 5424–5434. 10.1016/j.atmosenv.2012.02.020 [DOI] [Google Scholar]
- Cavallo D, Ursini CL, Carelli G, Iavicoli I, Ciervo A, Perniconi B, Rondinone B, Gismondi M, Iavicoli S, 2006. Occupational exposure in airport personnel: characterization and evaluation of genotoxic and oxidative effects. Toxicology, 223: 26–35. 10.1016/j.tox.2006.03.003 [DOI] [PubMed] [Google Scholar]
- Choi W, Hu SS, He ML, Kozawa K, Mara S, Winer AM, Paulson SE, 2013. Neighborhood-Scale Air Quality Impacts of Emissions from Motor Vehicles and Aircraft. Atmos. Environ 80: 310–21. 10.1016/j.atmosenv.2013.07.043 [DOI] [Google Scholar]
- Diez DM, Dominici F, Zarubiak D, Levy JI, 2012. Statistical approaches for identifying air pollutant mixtures associated with aircraft departures at Los Angeles International Airport. Environ. Sci. Technol 46: 8229–8235. doi: 10.1021/es3007172 [DOI] [PubMed] [Google Scholar]
- Habre R, Zhou H, Eckel S, Enebish T, Fruin S, Bastain T, Rappaport E Gilliland F, 2018. Environ. Int 118: 48–59. 10.1016/j.envint.2018.05.031 [DOI] [PMC free article] [PubMed] [Google Scholar]
- He R-W, Shirmohammadi F, Gerlofs-Nijland ME, Sioutas C,, Cassee FR, 2018. Pro-inflammatory responses to PM(0.25) from airport and urban traffic emissions. Sci.Total Environ 640–641, 997–1003. 10.1016/j.scitotenv.2018.05.382 [DOI] [PubMed] [Google Scholar]
- Henry RC, Mohan S, Yazdani S 2019. Estimating potential air quality impact of airports on children attending the surrounding schools. Atmos. Environ, 212: 128–135. 10.1016/j.atmosenv.2019.05.046 [DOI] [Google Scholar]
- Hsu HH, Adamkiewicz G, Houseman EA, Zarubiak D, Spengler JD, Levy JI, 2014. Contributions of aircraft arrivals and departures to ultrafine particle counts near Los Angeles International Airport. Sci. Total Environ 444: 347–55. 10.1016/j.scitotenv.2012.12.010. [DOI] [PubMed] [Google Scholar]
- Hudda N, Durant LW, Fruin SA, Durant JL, 2020. Impacts of Aviation Emissions on Near-Airport Residential Air Quality. Environ Sci Technol 50: 8580–8588. doi: 10.1021/acs.est.0c01859 [DOI] [PubMed] [Google Scholar]
- Hudda N, Simon NC, Zamore W, Durant JL, 2018. Aviation-related impacts on ultrafine number concentrations outside and inside residences near an airport. Environ. Sci. Technol 52: 1765–1772. 10.1021/acs.est.7b05593 [DOI] [PMC free article] [PubMed] [Google Scholar]
- Hudda N, Simon MC, Zamore W, Brugge D, Durant JL, 2016. Aviation emissions impact ultrafine particle concentrations in the greater Boston area. Environ. Sci. Technol 50: 8514–8521. 10.1021/acs.est.5b05313 [DOI] [PMC free article] [PubMed] [Google Scholar]
- Hudda N, Fruin SA, 2016. International airport impacts to air quality: Size and related properties of large increases in ultrafine particle number concentrations. Environ. Sci. Technol 50: 3362–3370. 10.1021/acs.est.5b05313 [DOI] [PubMed] [Google Scholar]
- Hudda N, Gould T, Hartin K, Larson TV, Fruin SA, 2014. Emissions from an international airport increase particle number concentrations 4-fold at 10 km downwind. Environ. Sci. Technol 48: 6628–35. 10.1021/es5001566 [DOI] [PMC free article] [PubMed] [Google Scholar]
- Keuken MP, Moerman M, Zandveld P, Henzing JS, Hoek G, 2015. Total and size-resolved particle number and black carbon concentrations in urban areas near Schiphol airport (the Netherlands). Atmos. Environ 104: 132–142. 10.1016/j.atmosenv.2015.01.015 [DOI] [Google Scholar]
- Kim B, Nakada K, Wayson R, Christie S, Paling C, Bennett M, Raper D, Raps V, Levy J, Roof C 2015. Understanding Airport Air Quality and Public Health Studies Related to Airports. Airport Cooperative Research Program, ACRP Report 135. https://trid.trb.org/view/1364659 [Google Scholar]
- Klapmeyer ME, Marr LC. (2012). CO2, NOx, and particle emissions from aircraft and support activities at a regional airport. Environ. Sci. Technol. 46: 10974–10981. 10.1021/es302346x [DOI] [PubMed] [Google Scholar]
- Lam J, Vesterinen HM, Woodruff TJ Chapter 8 – Systematic reviews and metaanalyses of air pollution epidemiological studies. In: Khreis H, Nieunhuijsen, Zietsman J, Ramani T (eds.) Traffic-Related Air Pollution Elsevier, 2020, pp. 183–205. 10.1016/B978-0-12-818122-5.00008-9 [DOI] [Google Scholar]
- Lammers A, Janssen NAH, Boere AJF, Berger M, Longo C, Vijverberg SJH, Neerincx AH, Mailtand-van der Zee AH, Cassee FR, 2020. Effects of short-term exposures to ultrafine particles near an airport in healthy subjects. Environ. Int 141: 105779. 10.1016/j.envint.2020.105779 [DOI] [PubMed] [Google Scholar]
- Masiol M, Harrison RM, 2015. Quantification of air quality impacts of London Heathrow Airport (UK) from 2005 to 2012. Atmos. Environ 116: 308–319. 10.1016/j.atmosenv.2015.06.048 [DOI] [Google Scholar]
- Pirhadi M, Mousavi A, Sowlat MH, Janssen NAH, Cassee FR, Sioutas C, 2020. Relative contributions of a major international airport activities and other urban sources to the particle number concentrations (PNCs) at a nearby monitoring site. Environ. Pollut, 260: 114027. 10.1016/j.envpol.2020.114027 [DOI] [PubMed] [Google Scholar]
- Riley EA, Gould T, Hartin K, Fruin SA, Simpson SD, Yost MG, Larson T, 2016. Ultrafine particle size as a tracer for aircraft turbine emissions. Atmos. Environ 139: 20–29. 10.1016/j.atmosenv.2016.05.016. [DOI] [PMC free article] [PubMed] [Google Scholar]
- Rissman J, Arunachalam S, BenDor T, West JJ, 2013. Equity and health impacts of aircraft emissions at the Hartfield-Jackson Atlanta International Airport, Landsc. Urban Plan. 1 20: 234–247. 10.1016/j.landurbplan.2013.07.010 [DOI] [Google Scholar]
- Schurmann G, Schafer K, Jahn C, Hoffmann H, Bauerfeind M, Fleuti E, Rappengluck B, 2007. The impact of NOx, CO and VOC emissions on the air quality of Zurich airport. Atmos. Environ 41: 103–118. 10.1016/j.atmosenv.2006.07.030 [DOI] [Google Scholar]
- Senkayi SN, Sattler ML, Rowe N, Chen VCP, 2014. Investigation of an association between childhood leukemia incidences and airports in Texas. Atmos. Pollut. Res 5: 189–195. 10.5094/apr.2014.023 [DOI] [Google Scholar]
- Shirmohammadi F, Sowlat MH, Hasheminassab S, Saffari A, Ban-Weiss G, Sioutas C 2017. Emission rates of particle number, mass and black carbon by the Los Angeles International Airport (LAX) and its impact on air quality in Los Angeles. Atmos. Environ 151: 82–93. 10.1016/j.atmosenv.2016.12.005 [DOI] [Google Scholar]
- Shukla AK, Pragya P, Chowdhuri DK, 2011. A modified alkaline Comet assay for in vivo detection of oxidative DNA damage in Drosophila melanogaster. Mutat. Res 726: 222–226. 10.1016/j.mrgentox.2011.09.017. [DOI] [PubMed] [Google Scholar]
- Simonetti I, Maltagliati S, Manfrida G, 2015. Air quality impact of a middle size airport within an urban context through EDMS simulation. Transp. Res. D Transp. Environ 40: 144–154. 10.1016/j.trd.2015.07.008 [DOI] [Google Scholar]
- Stacey B, 2019. Measurement of ultrafine particles at airports: A review. Atmos. Environ 198: 463–477. 10.1016/j.atmosenv.2018.10.041 [DOI] [Google Scholar]
- Ungeheuer F, Pinxteren D, Vogel A 2021. Identification and source attribution of organic compounds in ultrafine particles near Frankfurt International Airport. Atmos. Chem. Phys 21: 3763–3775. 10.5194/acp-21-3763-2021 [DOI] [Google Scholar]
- U. S. Environmental Protection Agency and U. S. Federal Aviation Administration, 2019. Integrated Science Assessment for Particulate Matter. Report No. EPA/600/R-19/188 https://cfpub.epa.gov/ncea/isa/recordisplay.cfm?deid=347534 (accessed April 20, 2021. [PubMed]
- U. S. Environmental Protection Agency and U. S. Federal Aviation Administration, 2009. Aircraft Engine Speciated Organic Gases: Speciation of Unburned Organic Gases in Aircraft Exhaust. Report No. EPA-420-R-09–902 https://www.epa.gov/regulations-emissions-vehicles-and-engines/organic-gas-speciation-profile-aircraft (accessed January 22, 2021).
- U. S. Environmental Protection Agency, 2009. Characterization of Emissions from Commercial Aircraft Engines during the Aircraft Particle Emissions eXperiment (APEX) 1 to 3. Report No. EPA-600/R-09/130 https://cfpub.epa.gov/si/si_public_record_report.cfm?dirEntryId=213064&Lab=NRMR (accessed January 22, 2021).
- University of Washington, 2019. Mobile ObserVations of Ultrafine Particles: The Mov-UP study report https://deohs.washington.edu/mov-up
- Valotto G, Varin C, 2016. Characterization of hourly NOx atmospheric concentrations near the Venice International Airport with additive semi-parametric statistical models. Atmos. Res 167: 216–223. 10.1016/j.atmosres.2015.07.023 [DOI] [Google Scholar]
- Varghese A, Cawley M, & Hong T (2018). Supervised clustering for automated document classification and prioritization: a case study using toxicological abstracts. Environ. Syst. Decis, 38: 398–414. 10.1007/s10669-017-9670-5 [DOI] [Google Scholar]
- Wells K, Littell JH, 2009. Study quality assessment in systematic reviews of research on intervention effects. Res. Soc. Work Pract 19:52–62. https://www.researchgate.net/publication/235635931 [Google Scholar]
- Westerdahl D, Fruin SA, Fine PL, Sioutas C, 2008. The Los Angeles International Airport as a source of ultrafine particles and other pollutants to nearby communities. Atmos. Environ 42: 3142–3155. 10.1016/j.atmosenv.2007.09.006 [DOI] [Google Scholar]
- Wing SE, Larson TV, Hudda N, Boonyarattaphan S, Fruin S, Ritz B, 2020. Preterm Birth among Infants Exposed to in Utero Ultrafine Particles from Aircraft Emissions. Environ. Health Perspect 128: 47002. 10.1289/ehp5732 [DOI] [PMC free article] [PubMed] [Google Scholar]
- Woody MC, Wong HW, West J, Arunachalam S, 2016. Multiscale predictions of aviation-attributable PM2.5 for US airports modeled using CMAQ with plume-in-grid and an aircraft-specific 1-D emission model. Atmos. Environ 147: 384–394. doi: 10.1016/j.atmosenv.2016.10.016 [DOI] [Google Scholar]
- Yim SHL, Lee GL, Lee IH, Allroggen F, Ashok A, Caiazzo F, Eastham SD, Malina R, Barrett SRH, 2015. Global, regional and local health impacts of civil aviation emissions. Environ. Res. Lett 10: 034001. 10.1088/1748-9326/10/3/034001/meta [DOI] [Google Scholar]
- Yu KN, Cheung YP, Cheung T, Henry RC, 2004. Identifying the impact of large urban airports on local air quality by nonparametric regression. Atmos. Environ 38: 4501–4507. 10.1016/j.atmosenv.2004.05.034 [DOI] [Google Scholar]
- Zhang X, Karl M Zhang L Wang J, 2020. Influence of Aviation Emission on the Particle Number Concentration near Zurich Airport. Environ. Sci. Technol 54: 14161–14171. 10.1021/acs.est.0c02249 [DOI] [PubMed] [Google Scholar]
- Zhu Y, Fanning E, Yu RC, Zhang Q, Froines JR, 2011. Aircraft emissions and local air quality impacts from takeoff activities at a large International Airport. Atmos. Environ 45: 6525–6533. 10.1016/j.atmosenv.2011.08.062 [DOI] [Google Scholar]
Associated Data
This section collects any data citations, data availability statements, or supplementary materials included in this article.