

Abstract
Background:
Histone modifications are major factors that define chromatin states and have functions in regulating gene expression in eukaryotic cells. Chromatin immunoprecipitation coupled with high-throughput sequencing (ChIP-seq) technique has been widely used for profiling the genome-wide distribution of chromatin-associating protein factors. Some histone modifications, such as H3K27me3 and H3K9me3, usually mark broad domains in the genome ranging from kilobases (kb) to megabases (Mb) long, resulting in diffuse patterns in the ChIP-seq data that are challenging for signal separation. While most existing ChIP-seq peak-calling algorithms are based on local statistical models without account of multi-scale features, a principled method to identify scale-free board domains has been lacking.
Methods:
Here we present RECOGNICER (Recursive coarse-graining identification for ChIP-seq enriched regions), a computational method for identifying ChIP-seq enriched domains on a large range of scales. The algorithm is based on a coarse-graining approach, which uses recursive block transformations to determine spatial clustering of local enriched elements across multiple length scales.
Results:
We apply RECOGNICER to call H3K27me3 domains from ChIP-seq data, and validate the results based on H3K27me3’s association with repressive gene expression. We show that RECOGNICER outperforms existing ChIP-seq broad domain calling tools in identifying more whole domains than separated pieces.
Conclusion:
RECOGNICER can be a useful bioinformatics tool for next-generation sequencing data analysis in epigenomics research.
Keywords: coarse-graining, ChIP-seq, peak calling, histone modification
Author summary:
Histone modifications play an important role in defining chromatin states and regulating gene expression. Many histone modifications and other chromatin-binding protein factors can mark broad domains across multiple scales in the genome. From ChIP-seq data, such broad domains are more challenging to identify than sharp peaks. In this work, we present RECOGNICER, an innovative computational method for identifying cross-scale broad domains using a coarse-graining approach. RECOGNICER can be a useful tool for ChIP-seq data analysis.
INTRODUCTION
Chromatin states are critical in regulating gene expression and maintaining cell identity [1,2]. Histone modifications are known to be functional marks of chromatin states and are associated with gene regulation [3,4]. Chromatin immunoprecipitation followed by high-throughput sequencing (ChIP-seq) technique has been commonly used for profiling such chromatin marks in the whole genome [5,6]. An increasing number of ChIP-seq data sets generated from a variety of cell systems have become publicly available for studying epigenomics and gene regulation [7]. Efficient computational analysis of ChIP-seq data is essential for extracting biological insights for functional and mechanistic studies [8,9].
Unlike transcription factors that usually bind DNA in a sequence-specific manner at a localized region [10], many histone modifications tend to spread on multiple nucleosomes in the chromatin and appear as broad domains on larger scales, such as H3K27me3 [11] and H3K9me2 [12]. Broad domains with specific histone marks can help stabilize the chromatin state and propagate the state through cell division robustly [13,14]. Broad H3K4me3 domains at promoter regions are reported to be associated with consistent transcriptional activation of cell identity genes and tumor suppressor genes [15,16]. Active enhancer histone mark H3K27ac can form broad domains that implicate super-enhancers, large regions bound by many transcription factor molecules functionally important in stem cell development and cancer [17–19]. The mechanism of formation of broad domains are known for several histone modifications, including H3K9me3 [20] and H3K27me3 [11]. The appearance of broad domains in ChIP-seq data goes beyond those for histone modifications, chromatin-interacting proteins including histone modifying enzymes also exhibit such patterns [21].
Computational tools for detecting signals from ChIP-seq data, or “peak calling”, have been extensively developed primarily for analyzing binding profiles of transcription factors, most of which exhibit narrow peaks. We previously developed SICER for analyzing histone modification ChIP-seq data and it has been widely applied as a broad domain calling method [22]. SICER uses a spatial-clustering approach to connect nearby small signals into broad domains under a Poisson-derived statistical model. Other methods for broad signal detection include RSEG, which uses a Hidden Markov Model (HMM) for identifying broad epigenomic domains [23], and MUSIC, which uses a multiscale decomposition approach for multi-scale ChIP-seq peak calling [24]. In a review comparing different ChIP-seq analysis tools [9], both RSEG and SICER were recommended as the proper choices for de novo broad ChIP-seq peak calling methods, as they outperform other existing tools under the default parameter settings. Nevertheless, it remains a non-trivial problem in the ChIP-seq computational analysis for detect large-scale chromatin domains.
In theoretical physics, coarse-graining is an approach that uses the physical quantity with its simpler form on the larger (coarse) scale to represent those with complex forms or configurations on the smaller (fine) scale in order to reduce the calculation complexity while maintaining the physical nature of the system [25,26]. Motivated by the multi-scale biophysical nature of hierarchical chromatin structure and the observation of histone modification domains on distinct length scales [22], we adapt the idea of coarse-graining and develop RECOGNICER (Recursive coarse-graining identification for ChIP-seq enriched regions), a new computational method for identifying board enrichment domains from ChIP-seq data across multiple scales. We test RECOGNICER on simulated data and publicly available ChIP-seq datasets and demonstrate that RECOGNICER is able to detect signal-enriched domains across a wide range of scales. We also show that RECOGNICER outperforms several existing methods in detecting integral domains covering gene loci. This principled method can serve as a new approach for broad domain identification in ChIP-seq data analytics.
RESULTS
The RECOGNICER algorithm is based on a coarse-graining approach, which uses the recursive block transformation to automatically determine spatial clustering of local enriched elements across multiple length scales (Fig. 1). It takes the mapped sequence read data from a ChIP-seq experiment as input, and produces the identified genome-wide domains as output. The flow chart of the RECOGNICER algorithm is shown in Fig. 2. A detailed description of the algorithm can be found in the Methods section.
Figure 1. The RECOGNICER method: coarse-graining schematic.

(A) Block transformation: The state of a block on the coarse scale is determined by its corresponding blocks on the fine scale according to the simplest majority rule (3 choose 2). Blue indicates blocks designated as “1”; white indicates blocks designated as “0”. (B–D) Analysis procedure: (B) Coarse-graining by recursive block transformation; (C) Domain retrieval to identify candidate regions on every scale; (D) Domain significance determination.
Figure 2.

Flow chart for the RECOGNICER algorithm.
We first use synthetic ChIP-seq data and real ChIP-seq experimental data to demonstrate RECOGNICER’s ability to identify broad domains across multiple scales. The synthetic dataset is generated by simulating mapped reads in both simulated foreground regions (domains) and background regions (other regions in human Chromosome 1) under various signal-to-noise ratio. The foreground regions are simulated as a number of domains whose size follows a single exponential distribution with a characteristic length of 100 kb and randomly placed across human Chromosome 1. The real experimental dataset is H3K27me3 ChIP-seq for human CD4+ T cells [5] from Chromosome 1, as H3K27me3 is a known histone mark that forms broad domains [11]. At each around of the recursive block transformation, we compute the auto-correlation curve and plot the fitted characteristic auto-correlation length in the absolute unit of bp against the coarse-graining scale at this around. We show that the auto-correlation length remains around 100 kb for the synthetic data, as expected (Fig. 3A), while the real ChIP-seq experimental data exhibit a growing auto-correlation along with coarse-graining (Fig. 3B). These results indicate that RECOGNICER can capture the multi-scale feature of actual histone modification broad domains. Indeed, when using RECOGNICER to identify significant domains from the whole-genome ChIP-seq dataset for human CD4+ T cells, we observe that the size of identified H3K27me3 domains ranges from kb to Mb (Fig. 3C), indicating the high-order hierarchical organization of chromatin structure.
Figure 3. Performance and robustness of RECOGNICER in ChIP-seq domain identification.
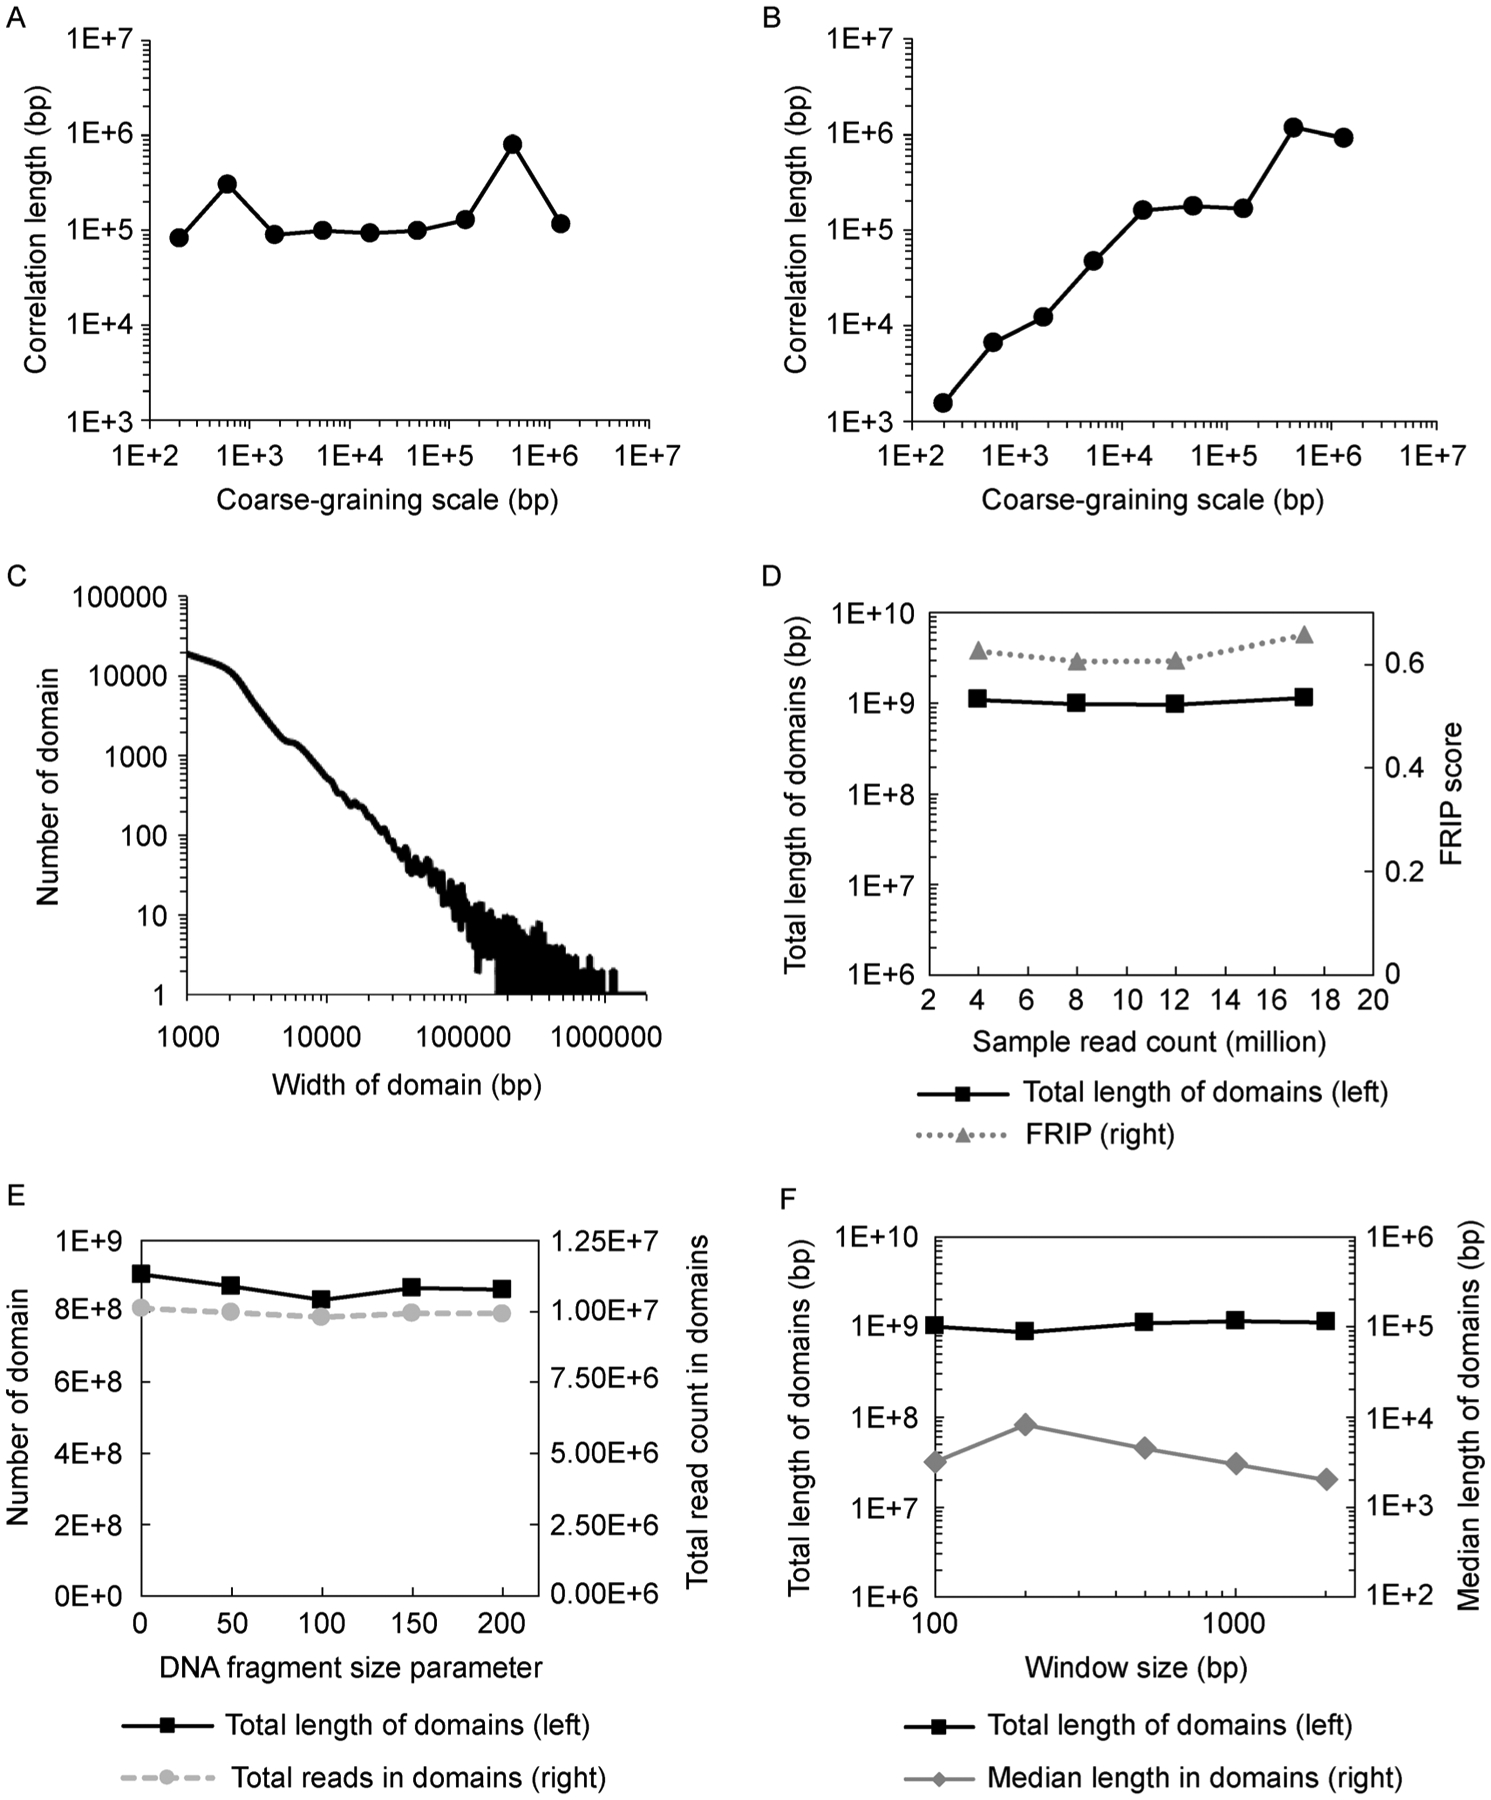
(A,B) Auto-correlation length changes during coarse-graining. For synthetic data (A) where domain size follows a single exponential distribution with a characteristic length of 100 kb, the auto-correlation lengths stably confirm this characteristic. While for real H3K27me3 ChIP-seq data (B), the auto-correlation length varies along coarse-graining, indicating that H3K27me3 domains have various characteristic sizes across multiple scales, as captured by RECOGNICER. (C) Size (width) distribution of H3K27me3 domains in CD4+ T cells identified by RECOGNICER. (D) The total aggregate length of identified domains (left vertical axis) and the fraction of reads in identified domain regions (FRIP score, right vertical axis) from ChIP-seq data with different total read counts (x-axis) randomly sampled from human CD4+ T cell H3K27me3 dataset. (E) The total aggregate length of identified domains (left vertical axis) and the total read count in identified domains (right vertical axis) from the human CD4 + T cell H3K27me3 dataset using various DNA fragment sizes (x-axis). (F) The total aggregate length of domains (left vertical axis) and the median domain length (right vertical axis) identified from human CD4+ T cell H3K27me3 dataset using different initial window sizes (x-axis).
We then test the robustness of RECOGNICER to ChIP-seq sample sequencing depths and to the model parameters including DNA fragment size and Initial window size. We randomly sample down the human CD4+ T cell H3K27me3 ChIP-seq dataset from 17.23 million reads to as few as 4 million reads, and find that the total aggregate length of identified H3K27me3 domains in the genome largely remains unchanged (Fig. 3D). In addition, although sequence read count varies, the fraction of reads in called peak/domain regions (FRIP score [27]) stays at the same level. This result indicates that RECOGNICER is able to identify domains from unsaturated ChIP-seq datasets with shallow sequencing depth. DNA fragment size parameter is used to determine the center position of the ChIP DNA fragment wrapping around the nucleosome that each single-end sequence read represents. Because RECOGNICER is designed for identifying broad domains especially on large scales, the precise location of individual DNA fragments within the local neighboring regions is not expected to drastically affect the genome-wide result. As shown in Fig. 3E, the total length of identified domains and total read count in domains are not sensitive to this parameter. Initial window size determines the data resolution. Because of the cross-scale nature of the coarse-graining approach, the performance of RECOGNICER is also robust to the choice of Initial window size (Fig. 3F).
Using the H3K27me3 ChIP-seq dataset for human CD4+ T cells [5], we compare the performance of RECOGNICER with SICER [22], RSEG [23], and MUSIC [24], using default parameters. As shown in the two example loci in Fig. 4, the domains identified with RECOGNICER are broader, and can capture the whole integral signal enriched pattern from diffuse data patterns on a large scale, while the other methods tend to identify narrower domains as breaking one big domain into small pieces.
Figure 4. Examples of H3K27me3 board domains identified using different tools.

(A) H3K27me3 marks the silent gene PTGER3 (left) while an active gene ZRANB2 (right) is not marked. (B) Two H3K27me3 broad domains are bounded at chromatin regions flanking an active gene FOXJ3.
In order to systematically quantify such differences in an unbiased and biologically meaningful approach, we then compare the performances of RECOGNICER and other methods by assessing the functional association of the identified H3K27me3 domains. Catalyzed by Polycomb Repressive Complex 2 (PRC2), H3K27me3 are known to be associated with repressed transcription, and have been reported to form board domains covering the entire gene body regions [11,28,29]. Therefore, if a transcriptionally inactive gene is associated with H3K27me3 mark, we expect that the entire gene body region should be more likely to be covered by one H3K27me3 domain as a functionally integral unit (defined as “cover” in Fig. 5A), rather than partially overlapped with multiple H3K27me3 domains segmented in pieces (defined as “overlap” in Fig. 5A). Based on this assumption, we systematically survey 9 different cell types that have both high-quality H3K27me3 ChIP-seq data and gene expression profiling data (microarray or RNA-seq) available from the ENCODE consortium [30], focusing on the unexpressed genes unanimously associated with H3K27me3 domains identified by 4 different computational methods, SICER [22], RSEG [23], MUSIC [24], and RECOGNICER, and examine how many of these genes are entirely covered by one H3K27me3 domain as identified by each method. As shown in Fig. 5B, for 8 out of the 9 cell types, RECOGNICER-identified H3K27me3 domains cover more repressed genes in the entire gene bodies than the other 3 methods. This result indicates that RECOGNICER outperforms existing methods in detecting functionally integral domains from broad histone mark ChIP-seq data.
Figure 5. RECOGNICER-identified H3K27me3 domains fully cover more repressed genes.

(A) Schematic illustration of the definitions of “cover” vs “overlap”. Yellow bars represent gene body loci from the transcription start site (TSS, arrow) to the transcription termination site (TTS). Red brackets represent H3K27me3 domains. (B) Numbers of unexpressed genes that are entirely covered (solid bar) or partially overlapped (striped bar) by H3K27me3 domains identified in several ENCODE cell lines using different methods. For each cell type, only the unexpressed genes that are unanimously associated with H3K27me3 domains from all four methods are included in the analysis.
DISCUSSION
Using a coarse-graining approach, RECOGNICER enables us to identify broad enrichment regions from ChIP-seq data across multiple length scales from kb to Mb. RECOGNICER is a principled method that accounts for the multi-scale nature of the formation of broad chromatin marks such as H3K27me3 and H3K9me3. It has robust performance and is not sensitive to sequencing depths or saturation of the ChIP-seq experiment, hence provides a cost-effective solution for broad histone mark ChIP-seq studies, because the data for such histone marks are diffuse and are usually much more difficult to reach saturation than ChIP-seq data with narrow peaks.
The RECOGNICER algorithm is intuitive and the domain identification does not need much parameter tuning, as a convenient feature for users. In fact, the only parameter to be set by users is the statistical threshold for the significant domains. Other featured parameters including DNA fragment size, Initial window size, and block transformation rule are self-optimized and preset. As shown in the previous section, the performance of RECOGNICER is not sensitive to the choices of DNA fragment size or Initial window size. This feature can make the method transferrable across different ChIP-seq experiments, different cell systems, and different saturation levels of the data without the necessity for users to spend much effort on tuning parameters.
As any computational model and bioinformatics method, RECOGNICER has its limitations. One potential caveat is that RECOGNICER could falsely merge two domains that are separated by gaps on the fine scale into one domain on the coarse scale, while the fine-scale gaps could be functionally meaningful rather than simply diffuse noise. As RECOGNICER is designed for capturing the genome-wide patterns and characteristics of chromatin states, such individual cases should be specifically monitored by users, who can also take in other information such as specific featured regions or masked regions.
In conclusion, RECOGNICER is a principled computational method for identifying broad domains from ChIP-seq data, using a coarse-graining approach based on theoretical physics concepts. RECOGNICER is able to detect extremely board chromatin domains across a wide range of scales. We show that RECOGNICER outperforms several existing ChIP-seq broad peak detection tools based on the unbiased biologically meaningful association of the identified H3K27me3 domains with gene annotation and expression information. Adapted from physics concepts and implemented as an open-source package, RECOGNICER can be a useful bioinformatics tool for the genomics and epigenomics research community.
METHODS
The RECOGNICER algorithm includes three main steps: coarse-graining by recursive block transformation, candidate domain retrieval with boundary determination, and significance determination (Fig. 1). The input is a ChIP-seq mapped reads data file in the BED format. The final output is the identified domains in the ENCODE broad-Peak format [27].
Recursive block transformation
Block transformation is a process to convert a long array into a short array by compressing the information from multiple elements into one element. A block transformation can be performed recursively. Starting from an array of blocks each containing a binary number “0” or “1”, we first set a block transformation factor L. In each round of the block transformation process, L number of consecutive blocks on the original scale are grouped together and form a coarse-grained block. The binary signal associated with the coarse-scale block is determined by a majority rule. To facilitate the majority rule, L is generally chosen to be an odd integer. In practice, we adopt the simplest majority rule, i.e., L = 3. In this case, 0 or 1 block designated with “1” on the original fine scale will yield a block designated with “0” on the coarse scale; 2 or 3 fine-scale blocks designated with “1” will yield a coarse-scale block designated with “1” (Fig. 1A). In doing so, we can keep the scale increasing at the mildest rate during coarse-graining so that it can capture signals on as many scales as possible.
To process a ChIP-seq dataset, we first partition each chromosome in the genome into equal-sized non-overlapping windows. We place mapped ChIP-seq reads into the windows. For single-end sequencing data, the position of each read should be shifted from its 5′ end coordinate downstream by half of the average DNA fragment size in the sample in order to reflect the center position of the ChIP DNA fragment this read represents. At the initial state, all windows with read counts above a threshold are determined as blocks designated with “1”. The remaining blocks are designated with “0”. The threshold is usually set as the average read count in a window as if all sequence reads are randomly placed in the mappable genome. With these windows serving as the initial blocks, we perform the block transformations recursively and identify the coarse-grained enriched regions across every scale (Fig. 1B).
The final result of coarse-graining depends on the choice of the phase of the blocks (i.e., where we start course-graining). The value of a block in the next coarse scale may be either “1” or “0” depending on the different phases in the block transformation. To avoid this arbitrariness, we perform a phase optimization process as follows. In each round of the coarse-graining on a scale, block transformations are performed under all L (L = 3) possible phases. Comparing the results from the different phases, the one with the largest number of blocks designated with “1” in the coarse scale is selected.
Termination of coarse-graining
We use an auto-correlation approach to determine the largest scale in the coarse-graining, i.e., when the recursive block transformation terminates. Intuitively, once the coarse scale reaches the auto-correlation characteristic length of the identified signal pattern on this scale, the coarse-graining should stop. Otherwise the block transformation might arbitrarily connect functionally different domains. The auto-correlation function C(r) is defined as
| (1) |
where N is the total number of blocks on a scale, Xi is the value of the i-th block (1 or 0), and is the average value of X of all blocks. It is worth noting that C(r) defined in Eq. (1) is not normalized to 1. We fit the auto-correlation function with a single exponential to identify the auto-correlation correlation characteristic length λ on this scale.
| (2) |
The recursive block transformation process terminates on a scale when the auto-correlation length λ becomes less than 1 on the next coarse scale.
In the RECOGNICER algorithm, the auto-correlation monitoring and block transformation termination process is implemented as follows: (i) The block transformation will eventually coarse grain into a state of all “0”s. This should be guaranteed because of the sparsity of signals in a typical ChIP-seq sample. In case it ends with all “1”s, the user should adjust the initial window read count threshold to allow for fewer blocks designated with “1” at the starting point. (ii) From the coarsest scale, auto-correlation function is calculated for the present scale and the previous scale. For computational simplicity, only 2 points on the auto-correlation curve, C(1) and C(2), are calculated. The first point C(0) is ignored because there are additional variances embedded in this value and can confound the fitting. (iii) With the 2 points on the auto-correlation curve, the correlation characteristic length λ is fitted using a single exponential form. (iv) If the correlation characteristic lengths at the present scale and at the previous (less coarse) scale are both greater than 1, the present scale is determined as the largest and final scale. Candidate domain retrieval is then performed from this scale.
Domain retrieval and boundary determination
The coarse-graining process enables us to identify chromosomal regions of signal enrichment across length-scales. In other words, we can trace back from the coarsest scale to the finest scale and harvest putative enriched regions by taking all the “1” blocks on every scale. Also, we refine the boundary locations of each coarse domain to its finest scale, in order to gain the highest resolution (Fig. 1C).
The domain retrieval process is implemented as follows: (i) At each step of the trace-back, from a coarse scale to its immediate fine scale, a “1” block on the coarse scale indicates that the corresponding fine-scale blocks should always be clustered together as one domain. Meanwhile, the “1” blocks on the fine scale that vanish to become a “0” block on the coarse scale are retrieved but not clustered. (ii) For each boundary of a clustered domain on the coarse scale, if its two neighboring blocks on both sides of the boundary on the fine scale are both “0” (“1”), the boundary is shrunk into (expanded out of) the domain by one fine-scale block. (iii) Overlapped clustered domains due to the operation from step (ii) are merged. (iv) Two adjacent clustered domains that are separated by a gap of at most one fine-scale block are merged. Eventually, all clustered domains of various lengths (including unclustered “1” blocks on the finest scale) are completely retained as candidate enriched domains.
Significance determination
After obtaining all candidate domains in different sizes, RECOGNICER estimates the statistical significance of each domain and identifies significantly enriched domains (Fig. 1D). Similar to the strategy used in SICER [22], we compare the read counts between the ChIP sample and the control sample for each candidate domain. We generate a fold-enrichment score and calculate a p-value under a local Poisson distribution model. The false discovery rate (FDR) can then be calculated using the p-value subject to the Benjamini-Hochberg procedure [31].
Default parameter settings
In practice, all parameters in RECOGNICER are pre-set as default values for simple usability and robust performances. For most histone modification ChIP-seq experiments, DNA fragments should be mono-nucleosomal, so the default DNA fragment size is 150 bp. Initial window size is set as 200 bp by default, representing a single nucleosome plus a linker DNA region. Sometimes 1 kb can be used to gather more reads in a window from a diffuse low-coverage ChIP-seq dataset as a trade-off for the mono-nucleosomal resolution. The block transformation factor is pre-set to be 3, the mildest coarse-graining rate. Although not recommended, it can be adjusted by users.
ACKNOWLEDGEMENTS
The authors would like to thank Drs. Keji Zhao and Dustin E. Schones for helpful discussions and members of the Zang laboratory for testing the software. This work was partially supported by the U.S. National Institutes of Health (NIH) R35GM133712 to C.Z., and R01 AI121080 and R01AI139874 to W.P.
Footnotes
AVAILABILITY
RECOGNICER is implemented in Python and the source code is openly available at https://github.com/zanglab/recognicer.
The authors Chongzhi Zang, Yiren Wang and Weiqun Peng declare that they have no conflict of interests.
REFERENCES
- 1.Bernstein BE, Meissner A and Lander ES (2007) The mammalian epigenome. Cell, 128, 669–681 [DOI] [PubMed] [Google Scholar]
- 2.Goldberg AD, Allis CD and Bernstein E (2007) Epigenetics: a landscape takes shape. Cell, 128, 635–638 [DOI] [PubMed] [Google Scholar]
- 3.Kouzarides T (2007) Chromatin modifications and their function. Cell, 128, 693–705 [DOI] [PubMed] [Google Scholar]
- 4.Bannister AJ and Kouzarides T (2011) Regulation of chromatin by histone modifications. Cell Res, 21, 381–395 [DOI] [PMC free article] [PubMed] [Google Scholar]
- 5.Barski A, Cuddapah S, Cui K, Roh T-Y, Schones DE, Wang Z, Wei G, Chepelev I and Zhao K (2007) High-resolution profiling of histone methylations in the human genome. Cell, 129, 823–837 [DOI] [PubMed] [Google Scholar]
- 6.Wang Z, Zang C, Rosenfeld JA, Schones DE, Barski A, Cuddapah S, Cui K, Roh T-Y, Peng W, Zhang MQ, et al. (2008) Combinatorial patterns of histone acetylations and methylations in the human genome. Nat. Genet, 40, 897–903 [DOI] [PMC free article] [PubMed] [Google Scholar]
- 7.Mei S, Qin Q, Wu Q, Sun H, Zheng R, Zang C, Zhu M, Wu J, Shi X, Taing L, et al. (2017) Cistrome Data Browser: a data portal for ChIP-Seq and chromatin accessibility data in human and mouse. Nucleic Acids Res, 45, D658–D662 [DOI] [PMC free article] [PubMed] [Google Scholar]
- 8.Shin H, Liu T, Duan X, Zhang Y and Liu XS (2013) Computational methodology for ChIP-seq analysis. Quant. Biol, 1, 54–70 [DOI] [PMC free article] [PubMed] [Google Scholar]
- 9.Steinhauser S, Kurzawa N, Eils R and Herrmann C (2016) A comprehensive comparison of tools for differential ChIP-seq analysis. Brief. Bioinform, 17, 953–966 [DOI] [PMC free article] [PubMed] [Google Scholar]
- 10.Spitz F and Furlong EEM (2012) Transcription factors: from enhancer binding to developmental control. Nat. Rev. Genet, 13, 613–626 [DOI] [PubMed] [Google Scholar]
- 11.Pauler FM, Sloane MA, Huang R, Regha K, Koerner MV, Tamir I, Sommer A, Aszodi A, Jenuwein T and Barlow DP (2009) H3K27me3 forms BLOCs over silent genes and intergenic regions and specifies a histone banding pattern on a mouse autosomal chromosome. Genome Res, 19, 221–233 [DOI] [PMC free article] [PubMed] [Google Scholar]
- 12.Wen B, Wu H, Shinkai Y, Irizarry RA and Feinberg AP (2009) Large histone H3 lysine 9 dimethylated chromatin blocks distinguish differentiated from embryonic stem cells. Nat. Genet, 41, 246–250 [DOI] [PMC free article] [PubMed] [Google Scholar]
- 13.Bannister AJ, Zegerman P, Partridge JF, Miska EA, Thomas JO, Allshire RC and Kouzarides T (2001) Selective recognition of methylated lysine 9 on histone H3 by the HP1 chromo domain. Nature, 410, 120–124 [DOI] [PubMed] [Google Scholar]
- 14.Lachner M, O’Carroll D, Rea S, Mechtler K and Jenuwein T (2001) Methylation of histone H3 lysine 9 creates a binding site for HP1 proteins. Nature, 410, 116–120 [DOI] [PubMed] [Google Scholar]
- 15.Benayoun BA, Pollina EA, Ucar D, Mahmoudi S, Karra K, Wong ED, Devarajan K, Daugherty AC, Kundaje AB, Mancini E, et al. (2014) H3K4me3 breadth is linked to cell identity and transcriptional consistency. Cell, 158, 673–688 [DOI] [PMC free article] [PubMed] [Google Scholar]
- 16.Chen K, Chen Z, Wu D, Zhang L, Lin X, Su J, Rodriguez B, Xi Y, Xia Z, Chen X, et al. (2015) Broad H3K4me3 is associated with increased transcription elongation and enhancer activity at tumor-suppressor genes. Nat. Genet, 47, 1149–1157 [DOI] [PMC free article] [PubMed] [Google Scholar]
- 17.Lovén J, Hoke HA, Lin CY, Lau A, Orlando DA, Vakoc CR, Bradner JE, Lee TI and Young RA (2013) Selective inhibition of tumor oncogenes by disruption of super-enhancers. Cell, 153, 320–334 [DOI] [PMC free article] [PubMed] [Google Scholar]
- 18.Whyte WA, Orlando DA, Hnisz D, Abraham BJ, Lin CY, Kagey MH, Rahl PB, Lee TI and Young RA (2013) Master transcription factors and mediator establish super-enhancers at key cell identity genes. Cell, 153, 307–319 [DOI] [PMC free article] [PubMed] [Google Scholar]
- 19.Hnisz D, Abraham BJ, Lee TI, Lau A, Saint-André V, Sigova AA, Hoke HA and Young RA (2013) Super-enhancers in the control of cell identity and disease. Cell, 155, 934–947 [DOI] [PMC free article] [PubMed] [Google Scholar]
- 20.Becker JS, Nicetto D and Zaret KS (2016) H3K9me3-dependent heterochromatin: barrier to cell fate changes. Trends Genet, 32, 29–41 [DOI] [PMC free article] [PubMed] [Google Scholar]
- 21.Wang Z, Zang C, Cui K, Schones DE, Barski A, Peng W and Zhao K (2009) Genome-wide mapping of HATs and HDACs reveals distinct functions in active and inactive genes. Cell, 138, 1019–1031 [DOI] [PMC free article] [PubMed] [Google Scholar]
- 22.Zang C, Schones DE, Zeng C, Cui K, Zhao K and Peng W (2009) A clustering approach for identification of enriched domains from histone modification ChIP-Seq data. Bioinformatics, 25, 1952–1958 [DOI] [PMC free article] [PubMed] [Google Scholar]
- 23.Song Q and Smith AD (2011) Identifying dispersed epigenomic domains from ChIP-Seq data. Bioinformatics, 27, 870–871 [DOI] [PMC free article] [PubMed] [Google Scholar]
- 24.Harmanci A, Rozowsky J and Gerstein M (2014) MUSIC: identification of enriched regions in ChIP-Seq experiments using a mappability-corrected multiscale signal processing framework. Genome Biol, 15, 474. [DOI] [PMC free article] [PubMed] [Google Scholar]
- 25.Kadanoff LP (1966) Scaling laws for ising models near Tc. Physics Physique Fizika, 2, 263–272 [Google Scholar]
- 26.Goldenfeld N (2018) Lectures on Phase Transitions and the Renormalization Group, 1st ed. New Jersey: Addison-Wesley [Google Scholar]
- 27.Landt SG, Marinov GK, Kundaje A, Kheradpour P, Pauli F, Batzoglou S, Bernstein BE, Bickel P, Brown JB, Cayting P, et al. (2012) ChIP-seq guidelines and practices of the ENCODE and modENCODE consortia. Genome Res, 22, 1813–1831 [DOI] [PMC free article] [PubMed] [Google Scholar]
- 28.Schwartz YB and Pirrotta V (2007) Polycomb silencing mechanisms and the management of genomic programmes. Nat. Rev. Genet, 8, 9–22 [DOI] [PubMed] [Google Scholar]
- 29.Young MD, Willson TA, Wakefield MJ, Trounson E, Hilton DJ, Blewitt ME, Oshlack A and Majewski IJ (2011) ChIP-seq analysis reveals distinct H3K27me3 profiles that correlate with transcriptional activity. Nucleic Acids Res, 39, 7415–7427 [DOI] [PMC free article] [PubMed] [Google Scholar]
- 30.ENCODE Project Consortium. (2012) An integrated encyclopedia of DNA elements in the human genome. Nature, 489, 57–74 [DOI] [PMC free article] [PubMed] [Google Scholar]
- 31.Benjamini Y and Hochberg Y (1995) Controlling the false discovery rate: a practical and powerful approach to multiple testing. J. R. Stat. Soc. B, 57, 289–300 [Google Scholar]