

Abstract
Aims
Risk stratification in acute heart failure (HF) patients can help to decide therapies and time for discharge. The potential of growth differentiation factor 15 (GDF‐15) in HF has been previously shown. We aimed to study the importance of GDF‐15‐level variations in acute HF patients.
Methods and results
We retrospectively evaluated a cohort of patients hospitalized due to acute HF. GDF‐15 was measured both at admission and on the discharge day. Patients were followed‐up during a 3 year period. The endpoint under analysis was all‐cause mortality. GDF‐15 variation is equal to [(admission GDF‐15 − discharge GDF‐15)∕admission GDF‐15] × 100. Variation was categorized in levels of increase or decrease of GDF‐15. Patients were cross‐classified according to admission and discharge GDF‐15 cut‐off points. A Cox regression analysis was used to assess the prognostic impact of GDF‐15 variation and the impact of both admission and discharge GDF‐15 according to the cross‐classification. We studied a group of 249 patients with high co‐morbidity burden. Eighty‐one patients died at 1 year and 147 within 3 years. There was a modest decrease in GDF‐15 during hospitalization from a median value of 4087 to 3671 ng/mL (P = 0.02). No association existed between GDF‐15 variation and mortality. In multivariate analysis, patients with admission GDF‐15 ≥ 3500 ng/mL and discharge GDF‐15 ≥ 3000 ng/mL had a significantly higher 1 year death risk when compared with the remaining—hazard ratio = 2.59 (95% confidence interval: 1.41–4.76)—and a 3 year 1.76 (95% confidence interval: 1.08–2.87) higher death risk compared with those with both values below the cut‐off.
Conclusions
Growth differentiation factor 15 decreased during an acute HF hospitalization, but its variation had no prognostic implications. The knowledge of both admission and discharge GDF‐15 added meaningful information to patients' risk stratification.
Keywords: Heart failure, Growth differentiation factor 15, Prognosis
Introduction
Acute heart failure (HF) risk stratification is a cornerstone of patient management as it can help to decide the appropriateness and timing of therapies. 1 , 2 , 3 However, the performance of prognostic models or methods remains unsatisfactory in acute HF patients. The number of potential biomarkers that could improve risk stratification in acute HF has been exponentially emerging over recent years. 4 , 5 , 6 , 7 , 8
Growth differentiation factor 15 (GDF‐15) is currently one of the most attractive biomarkers that provides strong prognostic information. 9 , 10 GDF‐15 is a member of the transforming growth factor‐β superfamily and was identified in a broad range of cells. 11 , 12 , 13 , 14 GDF‐15 is produced in response to several stimuli like inflammation, oxidative stress, tissue hypoxia, and injury. 14 GDF‐15 concentrations have been shown to increase significantly in a large number of pathological conditions, including renal dysfunction, diabetes, and sepsis. 15 , 16 , 17 , 18
In models of HF and acute myocardial infarction, cardiomyocytes can be stimulated to produce GDF‐15. GDF‐15 is also produced in atherosclerotic plaques. 16 , 19 In HF patients, the production of GDF‐15 is not well understood because, despite elevated levels, its production location does not seem to be on cardiomyocites. 20 , 21 Clinical studies found GDF‐15 to be associated with all‐cause death in chronic HF patients. 12 , 14 Circulating levels of GDF‐15 have been shown to increase in chronic HF with reduced ejection fraction and to be predictive of cardiovascular outcomes. 22 , 23 Also, in the acute HF setting, its association with mortality has been previously suggested. 12 , 24 , 25 , 26
However, although GDF‐15 values decrease transiently with serelaxin in patients with acute HF, 27 the meaning of variations in GDF‐15 levels in HF patients has never been explored. We aimed to study if dynamic changes in GDF‐15 during hospital admissions due to acute HF portend prognostic implications.
Methods
We prospectively included consecutive patients in an acute HF registry. The registry took place in the Internal Medicine Department of Centro Hospitalar Universitário São João, Porto, Portugal. All patients hospitalized with the primary diagnosis of acute HF—de novo and worsening chronic HF—were eligible for inclusion in the registry. Exclusion criteria were patients in whom an acute coronary syndrome was the cause of decompensation, patients with normal echocardiogram, and patients whose symptoms were attributable to causes other than HF. An echocardiogram was performed to all patients during hospitalization. Systolic dysfunction was considered severe when left ventricular ejection fraction was <30%, moderate when ejection fraction was between 30% and 39%, and mild between 40% and 49%. Patients with left ventricular ejection fraction ≥50% were considered as having preserved systolic function. The 2008 European Society of Cardiology guidelines were used for the diagnosis of HF. 28 The physicians treating the patients were aware of the ongoing registry, but all the patient's treatment strategy, discharge, and discharge medication were a decision of the attending physician only. A complete physical examination both at admission and in the discharge day was performed to all patients, and a venous blood sample was also collected on the admission and in the discharge day. Blood was collected in serum separating tubes; samples were immediately centrifuged (4500 rotation per minute for 15 min) and then stored at −75°C within 2 h. B‐type natriuretic peptide (BNP) determination is a routine laboratory procedure in our hospital; an Abbott chemiluminescent microparticle immunoassay (two‐step immunoassay) (Abbott, Wiesbaden, Germany) is used. Haemoglobin was obtained using an automated blood counter Sysmex® XE‐5000 (Sysmex Europe GmbH, Norderstedt, Germany). Serum creatinine was measured using conventional methods with an Olympus AU5400® automated clinical chemistry analyzer Beckman Coulter® (Beckman Coulter Ireland Inc, Clare, Ireland).
The registry's protocol conformed to the ethical guidelines of the Declaration of Helsinki, and it was approved by the local ethics committee.
In order to study if dynamic changes of GDF‐15 had prognostic implications in acute HF, we retrospectively analysed a subgroup of patients in whom enough serum was stored for GDF‐15 measurement at both admission and discharge. The plasma concentrations of GDF‐15 were determined by electrochemiluminescence immunoassay on the Roche Cobas e411 (Roche Diagnostics GmbH).
Patients were followed‐up for a 3 year period. The endpoint under analysis was all‐cause mortality. Vital status was ascertained by consulting hospital registries and by telephone contact with the patients or their relatives. When no information was obtained, we consulted the Registo Nacional de Utentes; Registo Nacional de Utentes is a national platform that provides information on patient mortality. No patient was lost to follow‐up.
Statistical analysis
Admission and discharge GDF‐15 were compared using a Wilcoxon signed‐rank test. Correlation between admission and discharge GDF‐15 was tested using a Spearman correlation coefficient. Receiver operating characteristic (ROC) curves were calculated to study the association of admission and discharge GDF‐15 and of the GDF‐15 variation with mortality. The ROC curves were used to choose good cut‐off points of admission and discharge GDF‐15 to accurately predict 1 and 3 year mortality.
Growth differentiation factor 15 variation was categorized to four groups: GDF‐15 decrease ≥30%, GDF‐15 decrease <30%, GDF‐15 increase <30%, and GDF‐15 increase ≥30%. Kaplan–Meier method was used to calculate the survival curves of the four groups created.
Based on the cut‐off values of admission and discharge GDF‐15 suggested by the ROC curves, 3500 and 3000 ng/mL, respectively, patients were cross‐classified in four groups: patients with admission GDF‐15 < 3500 ng/mL and discharge GDF‐15 < 3000 ng/mL; patients with admission GDF‐15 < 3500 ng/mL and discharge GDF‐15 ≥ 3000 ng/mL; patients with admission GDF‐15 ≥ 3500 ng/mL and discharge GDF‐15 < 3000 ng/mL; and patients with admission GDF‐15 ≥ 3500 ng/mL and discharge GDF‐15 ≥ 3000 ng/mL. Survival curves according to the four groups created were determined by the Kaplan–Meier method. A multivariate Cox regression analysis was used to access the independent prognostic impact of admission and discharge GDF‐15. The four groups of admission and discharge GDF‐15 were rearranged based on the Kaplan–Meier curves. For 1 year prognostic analysis, patients with admission GDF‐15 ≥ 3500 ng/mL and discharge GDF‐15 ≥ 3000 ng/mL were compared with the remaining. For the 3 year prognostic analysis, the variable was dummy coded: reference category: patients with both admission and discharge GDF‐15 below the cut‐off, and the other two categories would be those with only one of the measurements above the cut‐off and those with both measurements above the cut‐off. Multivariate models were built accounting for potential confounders and variables known to be prognostic associated. Variables taken into consideration for adjustment were age, New York Heart Association and systolic blood pressure at admission, diabetes mellitus, arterial hypertension and atrial fibrillation history, ischaemic heart disease, discharge BNP, high‐sensitivity troponin T and C‐reactive protein, a BNP decrease of >30% during hospitalization, renal dysfunction and anaemia at discharge, systolic dysfunction, and evidence‐based therapy according to updated guidelines by the time patients were hospital admitted.
Results
We studied 249 patients hospitalized with the primary diagnosis of acute HF with GDF‐15 levels measured at the admission and discharge day. It was a group of old patients with high co‐morbidity burden; both men and women and patients with preserved and reduced ejection fraction were well represented. More than half of the patients were admitted in New York Heart Association Class IV, and natriuretic peptide system was highly activated. Median (inter‐quartile range) length of hospital stay was of 7 (5–11) days. Eighty‐one patients died at 1 year of follow‐up, and 147 patients died within 3 years. Patients' characteristics are depicted in Table 1 .
Table 1.
Patients' characteristics
| Characteristics | N = 249 |
|---|---|
| Gender: male/female, n (%) | 134 (53.8)/115 (46.2) |
| Age (years), mean (SD) | 74 (13) |
| Left ventricular ejection fraction | |
| Preserved | 76 (30.5) |
| Mild dysfunction | 23 (9.2) |
| Moderate dysfunction | 34 (13.4) |
| Severe dysfunction | 116 (46.6) |
| NYHA class at admission | |
| II | 5 (2.0) |
| III | 98 (39.4) |
| IV | 143 (57.4) |
| Systolic blood pressure at admission (mmHg), mean (SD) | 136 (30) |
| Heart rate at admission (b.p.m.), mean (SD) | 89 (22) |
| Co‐morbidities | |
| Diabetes mellitus, n (%) | 133 (53.4) |
| Arterial hypertension history, n (%) | 190 (76.3) |
| Chronic kidney disease, n (%) | 57 (22.9) |
| Smoking status | |
| Never smoker, n (%) | 144 (57.8) |
| Former smoker, n (%) | 83 (33.3) |
| Current smoker, n (%) | 22 (8.8) |
| Atrial fibrillation history, n (%) | 101 (40.6) |
| Ischaemic heart failure, n (%) | 137 (55.0) |
| Laboratory parameters | |
| Admission haemoglobin (g/dL), mean (SD) | 11.9 (2.0) |
| Discharge haemoglobin (g/dL), mean (SD) | 12.2 (2.0) |
| Admission creatinine (mg/dL), mean (SD) | 1.58 (0.73) |
| Discharge creatinine (mg/dL), mean (SD) | 1.52 (0.69) |
| Admission CRP (mg/L), median (IQR) | 22.4 (9.0–54.9) |
| Discharge CRP (mg/L), median (SD) | 11.4 (5.6–24.9) |
| Admission high‐sensitivity troponin T (ng/L), median (IQR) | 47.9 (30.9–76.6) |
| Discharge high‐sensitivity troponin T (ng/L), median (IQR) | 41.8 (27.3–71.9) |
| Admission BNP (pg/mL), median (IQR) | 1534.5 (926.7–2766.3) |
| Discharge BNP (pg/mL), median (IQR) | 727.1 (302.3–1383.6) |
| Admission GDF‐15 (ng/mL), median (IQR) | 4087.0 (2606.0–6376.5) |
| Discharge GDF‐15 (ng/mL), median (IQR) | 3671.0 (2365.0–4662.5) |
| GDF‐15 variation (%), median (IQR) | 5.9 (−23.7 to 29.4) |
| Medication | |
| Discharge BB, n (%) | 197 (79.1) |
| ACEi and/or ARB, n (%) | 200 (80.3) |
| MRA, n (%) | 67 (26.9) |
| Furosemide, n (%) | 233 (93.6) |
| Outcome | |
| 1 year all‐cause mortality | 81 (32.5) |
| 3 year all‐cause mortality | 147 (59.0) |
ACEi, angiotensin‐converting enzyme inhibitor; ARB, angiotensin II receptor blocker; BB, beta‐blocker; BNP, B‐type natriuretic peptide; CRP, C‐reactive protein; GDF‐15, growth differentiation factor 15; IQR, inter‐quartile range; MRA, mineralocorticoid receptor antagonist; NYHA, New York Heart Association; SD, standard deviation.
Admission and discharge GDF‐15 presented a greatly skewed and right tailed distribution. Median values of admission and discharge GFD15 were 4087 and 3671 ng/mL, respectively. There was a modest however statistically significant decrease in GDF‐15 during hospital stay (P = 0.02, Wilcoxon signed‐rank test) and admission and discharge GDF‐15 showed a strong and positive correlation (ρ = 0.71, P < 0.001) has depicted in Figure 1 . The GDF‐15 variation was also highly skewed distributed: median (inter‐quartile range): 5.9 (−23.7 to 29.4) %. Mortality rates at 1 and 3 years of follow‐up were 32.5% and 59.0%, respectively. Figure 2 shows the ROC curves of the association of admission GDF‐15, discharge GDF‐15, and GDF‐15 variation with 1 and 3 year all‐cause mortality. Both admission and discharge GDF‐15 were associated with all‐cause death at 1 and 3 years. However, no association was found between GDF‐15 variation and mortality at both 1 and 3 years (Figure 3 ). Survival curves are similar in patients with decreases or increases above and below 30% of GDF‐15 during hospital stay. Following the ROC curves, we propose admission GDF‐15 of 3500 ng/mL and discharge GDF‐15 of 3000 ng/mL as good cut‐off points for 1 and 3 year mortality prediction. Sensitivity, specificity, and predictive values for each cut‐off are shown in Table 2 . When patients were cross‐classified according to admission and discharge GDF‐15 categorized based on the cut‐offs derived from the ROC curves, four groups were created. Survival curves according to these four groups at 1 and 3 years of follow‐up are depicted in Figure 4 . At 1 year of follow‐up, patients with both GDF‐15 values above the cut‐off had a clear survival disadvantage when compared with all the other groups. Cut‐offs discriminated three groups with distinct survival at 3 years: patients with admission GDF‐15 ≥ 3500 ng/mL and discharge GDF‐15 ≥ 3000 ng/mL had the worst survival, while patients with admission GDF‐15 < 3500 ng/mL and discharge GDF‐15 < 3000 ng/mL had the best 3 year survival. The remaining patients gathered in a group with intermediate medium‐term prognosis. Patients with admission GDF‐15 ≥ 3500 ng/mL and discharge GDF‐15 ≥ 3000 ng/mL had a multivariate‐adjusted 2.59 [95% confidence interval (CI): 1.41–4.76] higher risk of 1 year all‐cause death than the remaining patients. When considering a medium‐term 3 year prognosis, patients with admission GDF‐15 ≥ 3500 ng/mL and discharge GDF‐15 ≥ 3000 ng/mL had a multivariate‐adjusted 1.76 (95% CI: 1.08–2.87) higher 3 year death risk than those with admission GDF‐15 < 3500 ng/mL and discharge GDF‐15 < 3000 ng/mL. Table 3 shows crude and multivariate‐adjusted hazard ratio of 1 and 3 year mortality according to groups of admission and discharge GDF‐15. Patients with admission levels of GDF‐15 ≥ 3500 ng/mL or discharge ≥3000 ng/mL had a non‐significant 39% higher 3 year mortality than those with both values below the defined cut‐offs. Patients with admission and discharge GDF‐15 values above the cut‐off values showed a 1.52 (95% CI: 1.01–2.30, P = 0.04) higher risk of death than all the remaining patients and a non‐significant 40% increase in 3 year death risk compared with those with only one of the values above the cut‐off. When GDF‐15 variation along hospital stay was also accounted for in the multivariate model, results were similar (data not shown).
Figure 1.
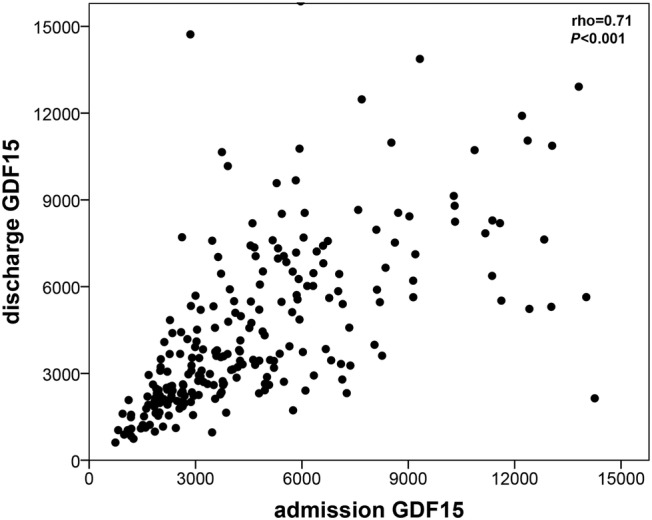
Scattered dot of the correlation between admission and discharge growth differentiation factor 15 (GDF‐15). A strong positive correlation exists between admission and discharge GDF‐15 levels in acute heart failure patients.
Figure 2.
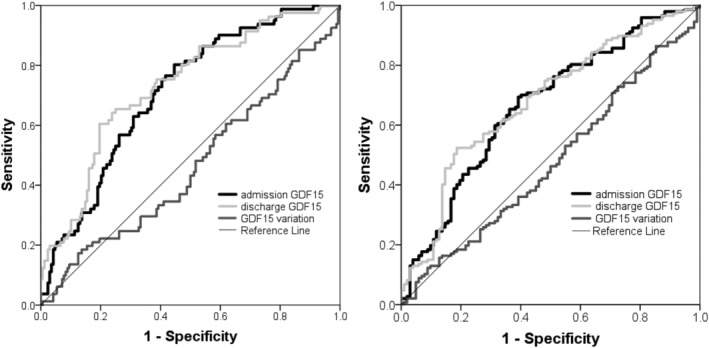
Receiver operating characteristic curves of the association of admission and discharge growth differentiation factor 15 (GDF‐15) and of the GDF‐15 variation with 1 year (left) and 3 year (right) mortality.
Figure 3.
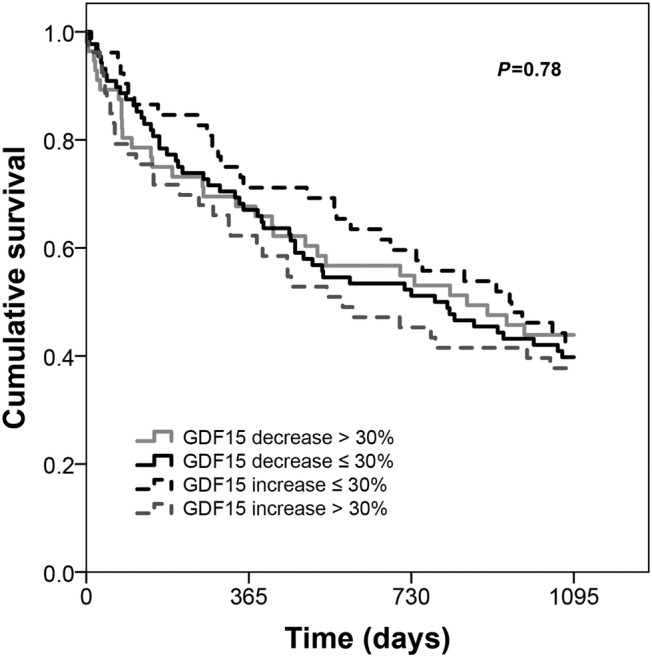
Kaplan–Meier curves according to growth differentiation factor 15 (GDF‐15) variation. GDF‐15 variation during hospitalization due to acute heart failure is not prognostic associated.
Table 2.
Sensitivity, specificity, VPP, and VPN of admission and discharge GDF‐15 in acute HF mortality prediction
| Sensitivity | Specificity | VPP | VPN | ||
|---|---|---|---|---|---|
| 1 year mortality | Admission GDF‐15 3500 ng/mL | 81.5 | 49.4 | 43.7 | 84.7 |
| Discharge GDF‐15 3000 ng/mL | 82.7 | 48.8 | 43.7 | 85.4 | |
| 3 year mortality | Admission GDF‐15 3500 ng/mL | 70.7 | 53.9 | 68.8 | 56.1 |
| Discharge GDF‐15 3000 ng/mL | 72.1 | 53.9 | 69.2 | 57.3 |
GDF‐15, growth differentiation factor 15; HF, heart failure; VPN, negative predictive value; VPP, positive predictive value.
Figure 4.
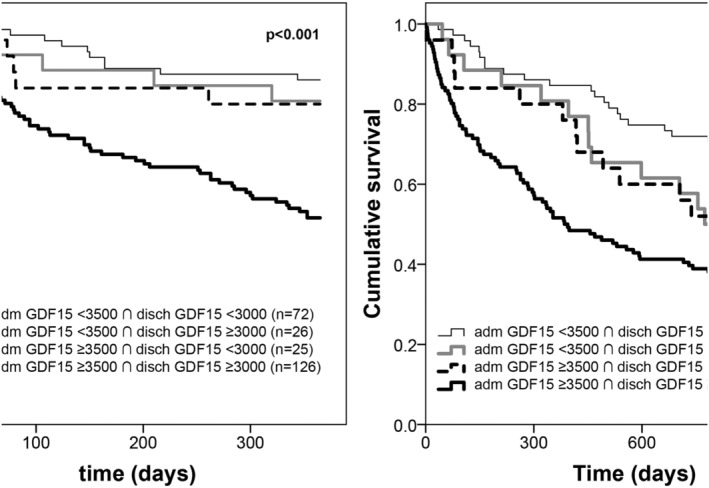
Kaplan–Meier survival curves of groups of patients cross‐classified according to cut‐off points of admission and discharge growth differentiation factor 15 (GDF‐15). Group 1: admission GDF‐15 < 3500 ng/mL and discharge GDF‐15 < 3000 ng/mL (n = 72, 28.9); Group 2: admission GDF‐15 < 3500 ng/mL and discharge GDF‐15 ≥ 3000 ng/mL (n = 26, 10.4%); Group 3: admission GDF‐15 ≥ 3500 ng/mL and discharge GDF‐15 < 3000 ng/mL (n = 25, 10.0%); and Group 4: admission GDF‐15 ≥ 3500 ng/mL and discharge GDF‐15 ≥ 3000 ng/mL (126, 50.6%). One year follow‐up (left) and 3 year follow‐up (right).
Table 3.
Crude and multivariate‐adjusted hazard ratio of 1 and 3 year mortality according to admission and discharge GDF‐15
| 1 year mortality | P‐value | |
| admGDF‐15 ≥ 3500 ∩ dischGDF‐15 ≥ 3000 vs. others (crude) | 3.70 (2.23–6.13) | <0.001 |
| admGDF‐15 ≥ 3500 ∩ dischGDF‐15 ≥ 3000 vs. others (mv adjusted a ) | 2.59 (1.41–4.76) | 0.002 |
| 3 year mortality | P‐value | |
| admGDF‐15 < 3500 ∩ dischGDF‐15 < 3000 | 1 | |
| admGDF‐15 ≥ 3500 or dischGDF‐15 ≥ 3000 | 1.49 (0.88–2.51) | 0.14 |
| admGDF‐15 ≥ 3500 ∩ dischGDF‐15 ≥ 3000 (crude) | 2.68 (1.76–4.08) | <0.001 |
| admGDF‐15 < 3500 ∩ dischGDF‐15 < 3000 | 1 | |
| admGDF‐15 ≥ 3500 or dischGDF‐15 ≥ 3.000 | 1.39 (0.78–2.49) | 0.26 |
| admGDF‐15 ≥ 3500 ∩ dischGDF‐15 ≥ 3000 (mv adjusted a ) | 1.76 (1.08–2.87) | 0.02 |
adm, admission; disch, discharge; GDF‐15, growth differentiation factor 15; mv, multivariable.
Multivariate adjustment accounting for age, New York Heart Association class in the emergency department, systolic blood pressure in the emergency department, diabetes mellitus, arterial hypertension history, atrial fibrillation, ischaemic heart failure, B‐type natriuretic peptide decrease >30% during hospitalization, discharge B‐type natriuretic peptide, high‐sensitivity troponin T and C‐reactive protein, renal dysfunction at discharge, anaemia at discharge, severe systolic dysfunction, and evidence‐based therapy (beta‐blocker, angiotensin‐converting enzyme inhibitors and/or angiotensin II receptor blocker, and mineralocorticoid receptor antagonist).
Discussion
Growth differentiation factor variation during hospitalization due to acute HF showed no prognostic impact; however, both admission and discharge GDF‐15 levels were associated with mortality at 1 and 3 years. Patients with admission GDF‐15 < 3500 ng/mL or discharge GDF‐15 < 3000 ng/mL presented 85% probability of being alive at 1 year of follow‐up. On the other hand, patients with admission GDF‐15 above the cut‐off showed a 69% probability of being dead up to 3 years, and those with discharge GDF‐15 ≥ 3000 ng/mL had the same probability of fatal outcome at 3 years. Furthermore, the gathered knowledge of admission and discharge GDF‐15 could add predictive information beyond known prognostic determinants in acute HF. Patients with admission GDF‐15 higher than 3500 ng/mL and discharge GDF‐15 ≥ 3000 ng/mL had over 2.5‐fold higher death risk at 1 year, while the risk was nearly two‐fold higher by 3 years when compared with patients with both values below the cut‐off. In the medium‐term 3 year follow‐up, patients with both GDF‐15 at admission<3500 ng/mL and discharge GDF‐15 < 3000 ng/mL were the group of patients with the best prognosis. The remaining patients presented an intermediate outcome.
Our results bring relevant insights on the dynamics of GDF‐15 in acute HF, reassuring previous observations suggesting that GDF‐15 levels are strong prognostic markers in acute HF 10 , 12 , 14 , 24 , 25 , 26 , 27 and proving that its prognostic value is similar in the beginning of an acute HF episode and at hospital discharge.
In healthy individuals, GDF‐15 is weakly expressed in tissues. However, under pathological conditions, GDF‐15 can be produced by many cardiovascular and non‐cardiovascular cell types. 14 GDF‐15 is not cardiac specific; instead, it reflects the sum of cardiac, peripheral, and systemic abnormalities, related to co‐morbidities, ageing, and even lifestyle. 11 , 12 , 13 , 14 GDF‐15 levels mirror a number of systems and events that are activated in HF—neurohumoral, oxidative stress, hypoxia, and inflammation—and there is evidence that therapies used in acute HF have limited effect in the modulation of these systems. 29 , 30 Until now, only serelaxin has been shown to decrease GDF‐15 in the acute setting, and this decrease in GDF‐15 levels had no impact in outcome. 31
Compared with chronic HF populations in whom increasing levels of GDF‐15 over time have been reported irrespective of HF therapy, 30 in our study, we observed a small decrease in GDF‐15 during the acute episode. This may suggest that, in an acute HF setting, an at least modest GDF‐15 modulation by evidence‐based therapy may exist or, more likely, that the control of the decompensating factor is perhaps responsible for this GDF‐15 reduction. In chronic HF, there is now evidence that GDF‐15 dynamics is prognostic related: variations of GDF‐15 are associated with outcome in HF patients with reduced ejection fraction. A mortality increase of 19% has been observed per each 20% increase in GDF‐15. 30 Despite these observations in chronic HF, no association between GDF‐15 variations and evidence‐based therapies in HF such as angiotensin receptor–neprilysin inhibitors or angiotensin II receptor blockers has been detected. 29 , 30
The reasons and mechanisms underlying the association between GDF‐15 and outcome are still poorly understood. On the one hand, higher GDF‐15 levels have been linked to significant left ventricular remodelling, 32 and on the other hand, left ventricular dilatation has been shown to be a predictor of increasing levels of GDF‐15. 33 The short time interval between measurements of GDF‐15 in our study can be a possible reason for the lack of association of GDF‐15 variations with prognosis, because significant ventricular remodelling and cardiac structural adaptations are not expected to occur in such a small period as the one corresponding to an HF hospitalization.
Previous reports of the prognostic impact of GDF‐15 in HF have shown different conclusions with respect to its potential value in HF patients' risk stratification. It is consensual knowledge that biomarkers are important tools that can help clinicians in the management of HF; however, no single biomarker can answer all prognostic uncertainties. Our results showing an independent prognostic value of GDF‐15 in acute HF, measured at hospital admission, at hospital discharge, or both, strongly support a role for this biomarker in the acute setting.
The study has some limitations to note. First, it had a retrospective design and was single centred with inherent problems, namely, concerning data availability and conclusions generalizability. Second, the small sample size is also a setback; nevertheless, patients were followed for a long enough period to gather an adequate number of events to perform a multivariate analysis with adjustment for main confounders. Third, physicians responsible for HF patients were aware of the registry, and this might have influenced treatment approach. Fourth, patients were prospectively recruited between 2009 and 2010, and GDF‐15 measurements were performed in 2018. Blood samples were immediately processed and stored at −7°C; however, the time elapsed between storage and analysis makes it impossible to totally guarantee the integrity of the samples. The admission and discharge GDF‐15‐level distribution show a reliable right tail skewed distribution, similar to many biomarkers, and measurements are consistent with values described in the literature.
Despite the described limitations, this is the first study that specifically addresses the performance of GDF‐15 during hospital admission due to acute HF and the prognostic impact of its dynamics. GDF‐15 variation showed no prognostic impact; however, the gathered knowledge of GDF‐15 at admission and discharge adds meaningful information to patients' risk stratification.
Conflict of interest
None declared.
Acknowledgement
We thank Roche Diagnostics for providing GDF‐15 determinations.
Lourenço, P. , Cunha, F. M. , Ferreira‐Coimbra, J. , Barroso, I. , Guimarães, J.‐T. , and Bettencourt, P. (2021) Dynamics of growth differentiation factor 15 in acute heart failure. ESC Heart Failure, 8: 2527–2534. 10.1002/ehf2.13377.
References
- 1. Chang KW, Fox S, Mojaver S, Maisel AS. Using biomarkers to guide heart failure management. Expert Rev Cardiovasc Ther 2017; 15: 729–741. [DOI] [PubMed] [Google Scholar]
- 2. Lee DS, Ezekowitz JA. Risk stratification in acute heart failure. Can J Cardiol 2014; 30: 312–319. [DOI] [PubMed] [Google Scholar]
- 3. Peacock WF, Cannon CM, Singer AJ, Hiestand BC. Considerations for initial therapy in the treatment of acute heart failure. Crit Care 2015; 19: 399. [DOI] [PMC free article] [PubMed] [Google Scholar]
- 4. Aimo A, Vergaro G, Ripoli A, Bayes‐Genis A, Pascual Figal DA, de Boer RA, Lassus J, Mebazaa A, Gayat E, Breidthardt T, Sabti Z, Mueller C, Brunner‐La Rocca HP, Tang WH, Grodin JL, Zhang Y, Bettencourt P, Maisel AS, Passino C, Januzzi JL, Emdin M. Meta‐analysis of soluble suppression of tumorigenicity‐2 and prognosis in acute heart failure. JACC Heart Fail 2017; 5: 287–296. [DOI] [PubMed] [Google Scholar]
- 5. Chaikijurajai T, Tang WHW. Reappraisal of inflammatory biomarkers in heart failure. Curr Heart Fail Rep 2020; 17: 9–19. [DOI] [PMC free article] [PubMed] [Google Scholar]
- 6. Frioes F, Lourenco P, Laszczynska O, Almeida PB, Guimaraes JT, Januzzi JL, Azevedo A, Bettencourt P. Prognostic value of sST2 added to BNP in acute heart failure with preserved or reduced ejection fraction. Clin Res Cardiol 2015; 104: 491–499. [DOI] [PubMed] [Google Scholar]
- 7. Lassus J, Gayat E, Mueller C, Peacock WF, Spinar J, Harjola VP, van Kimmenade R, Pathak A, Mueller T, Disomma S, Metra M, Pascual‐Figal D, Laribi S, Logeart D, Nouira S, Sato N, Potocki M, Parenica J, Collet C, Cohen‐Solal A, Januzzi JL Jr, Mebazaa A, Network G. Incremental value of biomarkers to clinical variables for mortality prediction in acutely decompensated heart failure: the Multinational Observational Cohort on Acute Heart Failure (MOCA) study. Int J Cardiol 2013; 168: 2186–2194. [DOI] [PubMed] [Google Scholar]
- 8. Vodovar N, Mebazaa A, Januzzi JL Jr, Murtagh G, Stough WG, Adams KF Jr, Zannad F. Evolution of natriuretic peptide biomarkers in heart failure: implications for clinical care and clinical trials. Int J Cardiol 2018; 254: 215–221. [DOI] [PubMed] [Google Scholar]
- 9. Chan MM, Santhanakrishnan R, Chong JP, Chen Z, Tai BC, Liew OW, Ng TP, Ling LH, Sim D, Leong KT, Yeo PS, Ong HY, Jaufeerally F, Wong RC, Chai P, Low AF, Richards AM, Lam CS. Growth differentiation factor 15 in heart failure with preserved vs. reduced ejection fraction. Eur J Heart Fail 2016; 18: 81–88. [DOI] [PubMed] [Google Scholar]
- 10. Hao J, Cheang I, Zhang L, Wang K, Wang HM, Wu QY, Zhou YL, Zhou F, Xu DJ, Zhang HF, Yao WM, Li XL. Growth differentiation factor‐15 combined with N‐terminal prohormone of brain natriuretic peptide increase 1‐year prognosis prediction value for patients with acute heart failure: a prospective cohort study. Chin Med J (Engl) 2019; 132: 2278–2285. [DOI] [PMC free article] [PubMed] [Google Scholar]
- 11. Pavo N, Wurm R, Neuhold S, Adlbrecht C, Vila G, Strunk G, Clodi M, Resl M, Brath H, Prager R, Luger A, Pacher R, Hulsmann M. GDF‐15 is associated with cancer incidence in patients with type 2 diabetes. Clin Chem 2016; 62: 1612–1620. [DOI] [PubMed] [Google Scholar]
- 12. Sharma A, Stevens SR, Lucas J, Fiuzat M, Adams KF, Whellan DJ, Donahue MP, Kitzman DW, Pina IL, Zannad F, Kraus WE, O'Connor CM, Felker GM. Utility of growth differentiation factor‐15, a marker of oxidative stress and inflammation, in chronic heart failure: insights from the HF‐ACTION study. JACC Heart Fail 2017; 5: 724–734. [DOI] [PMC free article] [PubMed] [Google Scholar]
- 13. Unsicker K, Spittau B, Krieglstein K. The multiple facets of the TGF‐β family cytokine growth/differentiation factor‐15/macrophage inhibitory cytokine‐1. Cytokine Growth Factor Rev 2013; 24: 373–384. [DOI] [PubMed] [Google Scholar]
- 14. Wollert KC, Kempf T, Wallentin L. Growth differentiation factor 15 as a biomarker in cardiovascular disease. Clin Chem 2017; 63: 140–151. [DOI] [PubMed] [Google Scholar]
- 15. Buendgens L, Yagmur E, Bruensing J, Herbers U, Baeck C, Trautwein C, Koch A, Tacke F. Growth differentiation factor‐15 is a predictor of mortality in critically ill patients with sepsis. Dis Markers 2017; 2017: 5271203. [DOI] [PMC free article] [PubMed] [Google Scholar]
- 16. Khan SQ, Ng K, Dhillon O, Kelly D, Quinn P, Squire IB, Davies JE, Ng LL. Growth differentiation factor‐15 as a prognostic marker in patients with acute myocardial infarction. Eur Heart J 2009; 30: 1057–1065. [DOI] [PubMed] [Google Scholar]
- 17. Nair V, Robinson‐Cohen C, Smith MR, Bellovich KA, Bhat ZY, Bobadilla M, Brosius F, de Boer IH, Essioux L, Formentini I, Gadegbeku CA, Gipson D, Hawkins J, Himmelfarb J, Kestenbaum B, Kretzler M, Magnone MC, Perumal K, Steigerwalt S, Ju W, Bansal N. Growth differentiation factor‐15 and risk of CKD progression. J Am Soc Nephrol 2017; 28: 2233–2240. [DOI] [PMC free article] [PubMed] [Google Scholar]
- 18. Resl M, Clodi M, Vila G, Luger A, Neuhold S, Wurm R, Adlbrecht C, Strunk G, Fritzer‐Szekeres M, Prager R, Pacher R, Hulsmann M. Targeted multiple biomarker approach in predicting cardiovascular events in patients with diabetes. Heart 2016; 102: 1963–1968. [DOI] [PubMed] [Google Scholar]
- 19. Bonaca MP, Morrow DA, Braunwald E, Cannon CP, Jiang S, Breher S, Sabatine MS, Kempf T, Wallentin L, Wollert KC. Growth differentiation factor‐15 and risk of recurrent events in patients stabilized after acute coronary syndrome: observations from PROVE IT‐TIMI 22. Arterioscler Thromb Vasc Biol 2011; 31: 203–210. [DOI] [PubMed] [Google Scholar]
- 20. Ahmad T, Wang T, O'Brien EC, Samsky MD, Pura JA, Lokhnygina Y, Rogers JG, Hernandez AF, Craig D, Bowles DE, Milano CA, Shah SH, Januzzi JL, Felker GM, Patel CB. Effects of left ventricular assist device support on biomarkers of cardiovascular stress, fibrosis, fluid homeostasis, inflammation, and renal injury. JACC Heart Fail 2015; 3: 30–39. [DOI] [PubMed] [Google Scholar]
- 21. Lok SI, Winkens B, Goldschmeding R, van Geffen AJ, Nous FM, van Kuik J, van der Weide P, Klopping C, Kirkels JH, Lahpor JR, Doevendans PA, de Jonge N, de Weger RA. Circulating growth differentiation factor‐15 correlates with myocardial fibrosis in patients with non‐ischaemic dilated cardiomyopathy and decreases rapidly after left ventricular assist device support. Eur J Heart Fail 2012; 14: 1249–1256. [DOI] [PubMed] [Google Scholar]
- 22. Ferreira JP, Duarte K, Woehrle H, Cowie MR, Wegscheider K, Angermann C, D'Ortho MP, Erdmann E, Levy P, Simonds AK, Somers VK, Teschler H, Rossignol P, Koenig W, Zannad F. Biomarkers in patients with heart failure and central sleep apnoea: findings from the SERVE‐HF trial. ESC Heart Fail 2020; 7: 503–511. [DOI] [PMC free article] [PubMed] [Google Scholar]
- 23. Kuster N, Huet F, Dupuy AM, Akodad M, Battistella P, Agullo A, Leclercq F, Kalmanovich E, Meilhac A, Aguilhon S, Cristol JP, Roubille F. Multimarker approach including CRP, sST2 and GDF‐15 for prognostic stratification in stable heart failure. ESC Heart Fail 2020; 7: 2230–2239. [DOI] [PMC free article] [PubMed] [Google Scholar]
- 24. Bettencourt P, Ferreira‐Coimbra J, Rodrigues P, Marques P, Moreira H, Pinto MJ, Guimaraes JT, Lourenco P. Towards a multi‐marker prognostic strategy in acute heart failure: a role for GDF‐15. ESC Heart Fail 2018; 5: 1017–1022. [DOI] [PMC free article] [PubMed] [Google Scholar]
- 25. Kempf T, Horn‐Wichmann R, Brabant G, Peter T, Allhoff T, Klein G, Drexler H, Johnston N, Wallentin L, Wollert KC. Circulating concentrations of growth‐differentiation factor 15 in apparently healthy elderly individuals and patients with chronic heart failure as assessed by a new immunoradiometric sandwich assay. Clin Chem 2007; 53: 284–291. [DOI] [PubMed] [Google Scholar]
- 26. Kempf T, von Haehling S, Peter T, Allhoff T, Cicoira M, Doehner W, Ponikowski P, Filippatos GS, Rozentryt P, Drexler H, Anker SD, Wollert KC. Prognostic utility of growth differentiation factor‐15 in patients with chronic heart failure. J Am Coll Cardiol 2007; 50: 1054–1060. [DOI] [PubMed] [Google Scholar]
- 27. Morrow DA, Velazquez EJ, DeVore AD, Prescott MF, Duffy CI, Gurmu Y, McCague K, Rocha R, Braunwald E. Cardiovascular biomarkers in patients with acute decompensated heart failure randomized to sacubitril‐valsartan or enalapril in the PIONEER‐HF trial. Eur Heart J 2019; 40: 3345–3352. [DOI] [PMC free article] [PubMed] [Google Scholar]
- 28. Dickstein K, Cohen‐Solal A, Filippatos G, McMurray JJ, Ponikowski P, Poole‐Wilson PA, Stromberg A, van Veldhuisen DJ, Atar D, Hoes AW, Keren A, Mebazaa A, Nieminen M, Priori SG, Swedberg K, ESC Committee for Practice Guidelines . ESC guidelines for the diagnosis and treatment of acute and chronic heart failure 2008: the Task Force for the Diagnosis and Treatment of Acute and Chronic Heart Failure 2008 of the European Society of Cardiology. Developed in collaboration with the Heart Failure Association of the ESC (HFA) and endorsed by the European Society of Intensive Care Medicine (ESICM). Eur Heart J 2008; 29: 2388–2442. [DOI] [PubMed] [Google Scholar]
- 29. Anand IS, Kempf T, Rector TS, Tapken H, Allhoff T, Jantzen F, Kuskowski M, Cohn JN, Drexler H, Wollert KC. Serial measurement of growth‐differentiation factor‐15 in heart failure: relation to disease severity and prognosis in the Valsartan Heart Failure Trial. Circulation 2010; 122: 1387–1395. [DOI] [PubMed] [Google Scholar]
- 30. Bouabdallaoui N, Claggett B, Zile MR, McMurray JJV, O'Meara E, Packer M, Prescott MF, Swedberg K, Solomon SD, Rouleau JL, PARADIGM‐HF Investigators and Committees . Growth differentiation factor‐15 is not modified by sacubitril/valsartan and is an independent marker of risk in patients with heart failure and reduced ejection fraction: the PARADIGM‐HF trial. Eur J Heart Fail 2018; 20: 1701–1709. [DOI] [PubMed] [Google Scholar]
- 31. Cotter G, Voors AA, Prescott MF, Felker GM, Filippatos G, Greenberg BH, Pang PS, Ponikowski P, Milo O, Hua TA, Qian M, Severin TM, Teerlink JR, Metra M, Davison BA. Growth differentiation factor 15 (GDF‐15) in patients admitted for acute heart failure: results from the RELAX‐AHF study. Eur J Heart Fail 2015; 17: 1133–1143. [DOI] [PubMed] [Google Scholar]
- 32. Dominguez‐Rodriguez A, Abreu‐Gonzalez P, Avanzas P. Relation of growth‐differentiation factor 15 to left ventricular remodeling in ST‐segment elevation myocardial infarction. Am J Cardiol 2011; 108: 955–958. [DOI] [PubMed] [Google Scholar]
- 33. Lind L, Wallentin L, Kempf T, Tapken H, Quint A, Lindahl B, Olofsson S, Venge P, Larsson A, Hulthe J, Elmgren A, Wollert KC. Growth‐differentiation factor‐15 is an independent marker of cardiovascular dysfunction and disease in the elderly: results from the Prospective Investigation of the Vasculature in Uppsala Seniors (PIVUS) Study. Eur Heart J 2009; 30: 2346–2353. [DOI] [PubMed] [Google Scholar]