

Abstract
Aims
Biomarkers may provide insights into molecular mechanisms underlying heart remodelling and dysfunction. Using a targeted proteomic approach, we aimed to identify circulating biomarkers associated with early stages of heart failure.
Methods and results
A total of 575 community‐based participants (mean age, 57 years; 51.7% women) underwent echocardiography and proteomic profiling (CVD II panel, Olink Proteomics). We applied partial least squares‐discriminant analysis (PLS‐DA) and a machine learning algorithm [eXtreme Gradient Boosting (XGBoost)] to identify key proteins associated with echocardiographic abnormalities. We used Gaussian mixture modelling for unbiased clustering to construct phenogroups based on influential proteins in PLS‐DA and XGBoost. Of 87 proteins, 13 were important in PLS‐DA and XGBoost modelling for detection of left ventricular remodelling, left ventricular diastolic dysfunction, and/or left atrial reservoir dysfunction: placental growth factor, kidney injury molecule‐1, prostasin, angiotensin‐converting enzyme‐2, galectin‐9, cathepsin L1, matrix metalloproteinase‐7, tumour necrosis factor receptor superfamily members 10A, 10B, and 11A, interleukins 6 and 16, and α1‐microglobulin/bikunin precursor. Based on these proteins, the clustering algorithm divided the cohort into two distinct phenogroups, with each cluster grouping individuals with a similar protein profile. Participants belonging to the second cluster (n = 118) were characterized by an unfavourable cardiovascular risk profile and adverse cardiac structure and function. The adjusted risk of presenting echocardiographic abnormalities was higher in this phenogroup than in the other (P < 0.0001).
Conclusions
We identified proteins related to renal function, extracellular matrix remodelling, angiogenesis, and inflammation to be associated with echocardiographic signs of early‐stage heart failure. Proteomic phenomapping discriminated individuals at high risk for cardiac remodelling and dysfunction.
Keywords: Epidemiology, Echocardiography, Biomarkers, Early‐stage heart failure, Proteomics
Introduction
In the presence of cardiovascular risk factors, the heart steadily remodels and its function progressively declines for years until symptoms of heart failure (HF) present. 1 Cardiac remodelling and dysfunction should be detected at a subclinical stage in order to initiate preventive measures in time. 2 Echocardiography enables non‐invasive assessment of cardiac morphology and function. Over the years, echocardiographic features of subclinical heart remodelling and dysfunction have been validated as prognostic precursors of overt heart disease. 3 , 4 , 5
Exploring the network of molecular mechanisms behind cardiac remodelling and dysfunction could help identify novel targets for its detection, prevention, and management. Previously, remodelling and dysfunction of the heart has been linked to numerous molecular perturbations, including a network of interlinked metabolic and inflammatory derangements. 6 , 7 The search for pathologically relevant proteins in HF is being facilitated by high‐throughput proteomic profiling platforms 8 and by advanced analytical approaches such as machine learning capable of dealing with large protein networks. 9 , 10 For instance, the HOMAGE case–control study identified 38 proteins associated with incidence of symptomatic HF, that is, the long‐term consequence of subclinical heart remodelling and dysfunction, out of 252 proteins. 11 To date, however, these technological advancements have been underutilized for protein‐based detection of early‐stage heart disease. Indeed, when it comes to subclinical heart remodelling and dysfunction, population studies so far considered only a limited selection of proteomic markers and neglected protein interconnectivity.
There is a need for better proteomic characterization of the asymptomatic stages of cardiac remodelling and dysfunction as assessed by echocardiography. Clustering approaches that integrate key proteins of echocardiographic abnormalities could identify phenotypically distinct groups and provide a protein‐based classification of cardiac health in the community. If successful, such approach could lead to a targeted proteomic platform for identification of individuals at high risk for HF.
In this population study, we therefore applied high‐throughput biomarker profiling, feature selection techniques, and an unbiased clustering approach to (i) derive from a large panel of proteins related to cardiovascular disease those associated with echocardiographic signs of heart remodelling and dysfunction and (ii) integrate the most informative proteins in a protein‐based classification system for assessment of cardiac health.
Methods
Study participants
This study is embedded in the Flemish Study on Environment, Genes and Health Outcomes (FLEMENGHO), which received ethical approval from the Ethics Committee of the University of Leuven (S64406). We recruited a random family‐based population sample within north‐eastern Belgium as described before. 12 From 2005 to 2015, we invited 1851 FLEMENGHO participants for an echocardiographic examination, of whom 1447 provided written informed consent (participation rate, 78.2%). We performed high‐throughput proteomic profiling in 575 FLEMENGHO participants above 40 years old who were free from atrial fibrillation or a pacemaker at the time of examination and who had optimal echocardiographic image quality.
Echocardiography
Participants refrained from heavy exercise, smoking, and consuming alcohol or caffeinated beverages for 3 h before the examination. Supplemental Methods detail the echocardiographic protocol. Two echocardiographers obtained standardized images along the parasternal long and short axes and from the apical four‐chamber and two‐chamber and long‐axis views using a Vivid 7 Pro and Vivid E9 (GE Vingmed, Horten, Norway) interfaced with a 2.5 to 3.5 MHz phased‐array probe. 12 , 13 Using EchoPAC software (GE Vingmed), images were post‐processed by one expert (T.K.) blinded to the participants' characteristics with good reproducibility. 5 Using clinically recommended criteria 13 and population‐based thresholds predictive of cardiac events in the community, 4 , 5 we defined left ventricular (LV) remodelling as having LV concentric remodelling [relative wall thickness (RWT) > 0.42] and/or having LV hypertrophy (LV mass indexed to body height2.7 > 50 g/m2.7 for men and >47 g/m2.7 for women) 14 ; LV diastolic dysfunction as E/e' ratio > 8.5 [elevation of LV filling pressure, confirmed by differences in durations between mitral A flow and reverse pulmonary veins flow (Ad less than ARd + 10 ms), tricuspid regurgitation > 2.7 m/s, and/or elevation in left atrial (LA) maximal volume index (>40 mL/m2) as measured by the method of disks] 15 ; and LA reservoir dysfunction as an LA reservoir strain < 23%. 5 Besides LV remodelling, we defined the following LV remodelling profiles: normal geometry (RWT ≤ 0.42, no LV hypertrophy), concentric remodelling (RWT > 0.42, no LV hypertrophy), eccentric hypertrophy (RWT ≤ 0.42, LV hypertrophy), and concentric hypertrophy (RWT > 0.42 and LV hypertrophy). 16
Proteomic measurements
We determined 92 proteins related to immune regulation, metabolic pathways, and cardiovascular disease using a Proseek® multiplex platform (CVD II panel, Olink Proteomics, Uppsala, Sweden). Supporting Information, Table S1 lists the 92 biomarkers included in the CVD II panel. Fasting serum samples were analysed by the ARCADIA unit at the University Medical Center in Utrecht, the Netherlands. The platform applies proximity extension assay technology, 8 where each protein gets linked to a unique pair of oligonucleotide ‐labelled antibodies. Next, hybridization, amplification, and subsequently quantification of the complementary oligonucleotide strands linked to the paired antibodies enable protein quantification by quantitative real‐time PCR using a Fluidigm BioMark HD platform. Quantitation data were quality controlled and normalized using internal and external controls, providing Normalized Protein eXpression (NPX) values. NPX is an arbitrary unit on a log2 scale used to quantify relative changes in protein levels. Higher NPX corresponds to higher protein expression. Five proteins were excluded due to bimodal distribution, leaving 87 proteins for analysis.
Other measurements
Details on recording medical history, lifestyle, and blood pressure are in Supplemental Methods .
Statistical analysis
For database management and analysis, we used SAS Version 9.4 and JMP Genomics 9.0 (SAS Institute, Cary, NC, USA). Means and proportions were compared by a large sample z‐test and χ 2 test, respectively. Significance was P < 0.05 on two‐sided test.
Feature selection
First, we applied feature selection techniques to select from the pool of 87 biomarkers those related to echocardiographic indexes (LV RWT and mass index, E/A ratio, E/e' ratio, and LA reservoir strain) and echocardiographic abnormalities (i.e. LV remodelling, LV diastolic dysfunction, and LA reservoir dysfunction as well as the LV remodelling profiles). For this, we used partial least squares‐discriminant analysis (PLS‐DA) 9 and eXtreme Gradient Boosting (XGBoost), 10 two dimension reduction techniques capable of dealing with large sets of interrelated biomarkers.
PLS‐DA constructs linear combinations that maximize the covariance between the biomarkers and the outcome (here: echocardiographic abnormalities). These latent factors then replace the original features (biomarkers) in outcome estimation. All 87 proteins were considered for construction of the latent factors. Per outcome, the software selected the PLS‐DA model that predicted the outcome best at balanced risk for under‐fitting and overfitting. In detail, the number of latent factors retained in the final PLS‐DA model was the number with the lowest predicted residuals sum of squares (PRESS) explaining a substantial proportion of the variation in features and outcome (max. 15 latent factors). PRESS statistics provide a summary measure of the models' fit and were retrieved by leave‐one‐out cross‐validation, in which each observation in turn was removed and models were refitted using the remaining observations. Per protein, we calculated the variable importance in projection (VIP) scores of Wold, reflecting the importance of each biomarker in the construction of the final PLS‐DA model. Similar to PLS‐DA, we performed PLS analyses for prediction of main echocardiographic indexes on a continuous scale (i.e. LV RWT and mass index, E/A ratio, E/e' ratio, and LA reservoir strain).
In XGBoost, a final model is an additive combination of a number of trees, with each subsequent tree trained on a negative gradient of a loss function. This approach decreases both variance and bias and thus increases prediction performance. 10 XGBoost was optimized with Tree‐structured Parzen Estimator Approach using hyperopt 0.2.5. To examine the internals of the trained XGBoost model, we applied Accumulated Local Effects (ALE) forked from PyALE 1.0. Feature importance was implemented as a mean increase in accuracy resulting from the tree splits with a given feature. Predictive performance of XGBoost was evaluated using 10‐fold cross‐validation. Overall performance of PLS‐DA and XGBoost was assessed using the area under the receiver operating characteristic curve.
We assessed associations between echo abnormalities and proteins selected in PLS‐DA and XGBoost, while accounting for age, sex, body mass index (except for LV remodelling), heart rate, systolic blood pressure, total cholesterol, antihypertensive treatment, current smoking, and history of diabetes mellitus (with Holm–Bonferroni correction for multiple testing).
Protein network
Next, we performed a weighted network analysis on all 87 biomarkers using NetworkX 2.5. The Weighted Gene Co‐expression Network Analysis 1.69 was used for the scale‐free analysis. 17 We constructed a network from all proteins with edges weighted by the Pearson's correlation coefficients produced from Pandas 1.1.4. We power transformed the network, selecting the smallest power degree (β = 5) with scale‐free fitting index ≥ 0.9. We used Louvain modularity (python‐louvain 0.14) to identify distinct protein groups in the network. 18
Unsupervised clustering for protein‐based phenomapping
To identify protein‐based phenogroups, we conducted model‐based clustering on individuals using the set of biomarkers that were important in both PLS‐DA (VIP > 1.3) and XGBoost (top 10 feature importance) for detecting echocardiographic abnormalities. Clustering methods were taken from the scikit‐learn library (0.23) and used within a Python 3.8 environment. 19 We fitted a Gaussian mixture using an expectation maximization algorithm, 20 with each component having its own covariance matrix. Gaussian mixture produces a statistical model of resulting segmentation. 21 The optimal number of clusters was based on the Davies–Bouldin and Silhouette indexes. 22 We compared the clinical and echocardiographic characteristics of the protein‐based phenogroups and their odds for presenting cardiac remodelling and dysfunction while adjusting for potential confounders listed before.
Results
Population characteristics
Table 1 presents the clinical and echocardiographic characteristics by sex. Mean age was 57.8 ± 10.9 years. The study sample included 297 women (51.7%). LV remodelling, LV diastolic dysfunction, and LA reservoir dysfunction were present in 194 (33.7%), 102 (17.7%), and 155 (27.0%) participants, respectively.
Table 1.
Clinical and echocardiographic characteristics for men and women
| Characteristics | Men (n = 278) | Women (n = 297) | P value |
|---|---|---|---|
| Clinical data | |||
| Age, years | 58.1 ± 10.7 | 57.6 ± 11.0 | 0.59 |
| Body mass index, kg/m2 | 27.5 ± 3.8 | 26.6 ± 4.8 | 0.017 |
| Systolic BP, mmHg | 134.4 ± 16.5 | 131.6 ± 18.9 | 0.057 |
| Diastolic BP, mmHg | 83.3 ± 9.3 | 79.4 ± 9.0 | <0.0001 |
| Heart rate, b.p.m. | 61.9 ± 9.1 | 64.6 ± 9.2 | 0.0004 |
| Hypertensive, n (%) | 157 (56.5) | 145 (48.8) | 0.066 |
| Treated for hypertension, n (%) | 94 (33.8) | 94 (31.7) | 0.58 |
| Current smoking, n (%) | 49 (17.6) | 47 (15.8) | 0.56 |
| Drinking alcohol, n (%) | 145 (52.2) | 72 (24.2) | <0.0001 |
| History of CHD, n (%) | 22 (7.9) | 8 (2.7) | 0.0049 |
| History of diabetes mellitus, n (%) | 17 (6.1) | 13 (4.4) | 0.35 |
| Biochemical data | |||
| Serum creatinine, μmol/L | 90.1 ± 13.3 | 74.4 ± 13.3 | <0.0001 |
| Total cholesterol, mmol/L | 5.2 ± 0.95 | 5.43 ± 0.96 | 0.0020 |
| Blood glucose, mmol/L | 5.08 ± 1.09 | 4.88 ± 0.60 | 0.0086 |
| LV structure and volumes | |||
| Relative wall thickness | 0.40 ± 0.07 | 0.38 ± 0.06 | 0.012 |
| Mass index, g/m2.7 | 46.5 ± 11.2 | 41.2 ± 10.6 | <0.0001 |
| EDV index, mL/m2 | 57.6 ± 12.6 | 47.0 ± 8.6 | <0.0001 |
| ESV index, mL/m2 | 23.0 ± 7.4 | 18.1 ± 4.36 | <0.0001 |
| LV remodelling, n (%) a | 144 (58.3) | 103 (41.7) | <0.0001 |
| LV systolic function | |||
| Ejection fraction, % | 60.4 ± 6.6 | 61.5 ± 6.2 | 0.027 |
| Global LS, % b | 18.5 ± 2.3 | 20.0 ± 2.1 | <0.0001 |
| LV diastolic function | |||
| E peak, m/s | 0.67 ± 0.15 | 0.76 ± 0.16 | <0.0001 |
| A peak, m/s | 0.64 ± 0.15 | 0.70 ± 0.17 | <0.0001 |
| E/A ratio | 1.10 ± 0.36 | 1.14 ± 0.37 | 0.22 |
| TDI e', cm/s c | 9.91 ± 2.83 | 10.1 ± 2.81 | 0.45 |
| E/e' ratio | 7.15 ± 1.95 | 7.93 ± 2.27 | <0.0001 |
| LV diastolic dysfunction, n (%) | 38 (13.7) | 64 (21.6) | 0.013 |
| LA volume and function | |||
| Maximal volume, mL/m2 | 33.4 ± 9.6 | 30.5 ± 8.6 | 0.0001 |
| Minimal volume, mL/m2 | 14.5 ± 5.8 | 13.0 ± 5.4 | 0.0016 |
| Emptying fraction, % | 57.1 ± 8.7 | 58.4 ± 8.3 | 0.087 |
| Reservoir strain, % b | 28.6 ± 8.2 | 30.6 ± 9.0 | 0.0059 |
| LA reservoir dysfunction, n (%) | 81 (29.1) | 74 (24.9) | 0.25 |
BP, blood pressure; CHD, congenital heart disease; EDV, end‐diastolic volume; ESV, end‐systolic volume; LA, left atrial; LS, longitudinal strain; LV, left ventricular; TDI, tissue Doppler imaging.
Values are mean ± standard deviation or number of subjects (%).
LV remodelling was defined as having LV concentric hypertrophy (relative wall thickness > 0.42) and/or LV hypertrophy (LV mass ≥ 50 g/m2.7 in men and ≥ 47 g/m2.7 in women).
Data on global LS and LA strain were available in 544 and 558 participants, respectively.
Average of septal, lateral, inferior, and posterior mitral annular sites.
Key proteins of heart remodelling and dysfunction
Figure 1 outlines the most important biomarkers selected by PLS‐DA (VIP > 1.3) and/or XGBoost (top 10 biomarkers) for detection of echocardiographic signs of LV remodelling, LV diastolic dysfunction, and LA reservoir dysfunction. Area under the receiver operating characteristic curve of identifying the echocardiographic abnormalities ranged between 0.78 and 0.90 for the PLS‐DA models (Supporting Information, Figure S1 ) and between 0.72 and 0.83 for the XGBoost models (Supporting Information, Figure S2 ). Overall, 13 proteins were found important in both PLS‐DA and XGBoost modelling for at least one of the three echocardiographic profiles: placental growth factor (PGF), kidney injury molecule‐1 (KIM‐1), galectin‐9, cathepsin L1 (CTSL1), prostasin (PRSS8), tumour necrosis factor (TNF)‐related apoptosis‐inducing ligand receptor 2 (TRAIL‐R2), TNF receptor superfamily member 0A (TNFRSF10A) and 11A (TNFRSF11A), matrix metalloproteinase‐7 (MMP‐7), angiotensin‐converting enzyme‐2 (ACE2), interleukins 6 (IL‐6) and 16 (IL‐16), and protein α1‐microglobulin/bikunin precursor (AMBP) (Figure 1 ). The Venn diagram in Figure 2 illustrates the overlap between the 13 selected biomarkers. PGF, CTSL1, KIM‐1, and galectin‐9 were consistently identified as important for detecting all three echo abnormalities.
Figure 1.
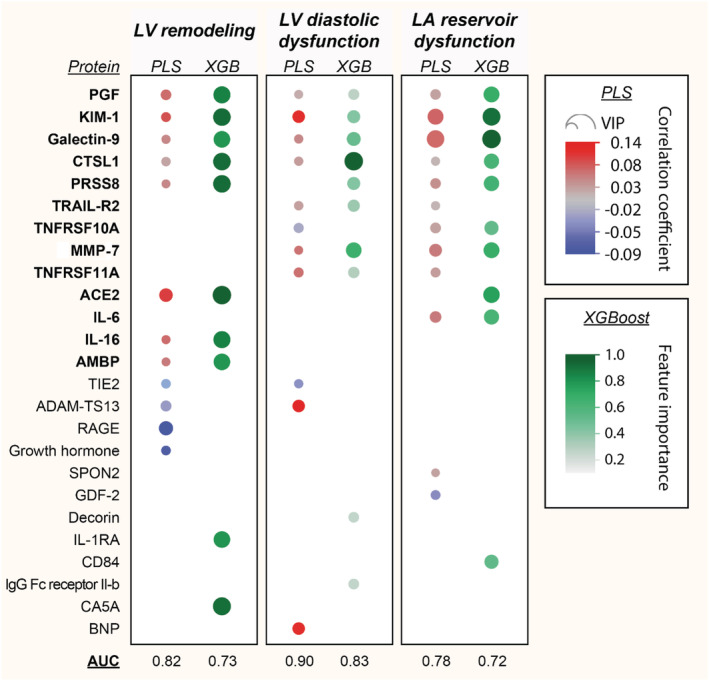
Biomarkers of cardiac remodelling and dysfunction. The heat map presents the biomarkers that were important in partial least squares‐discriminant analysis (PLS‐DA) (VIP > 1.3) and eXtreme Gradient Boosting (XGBoost) modelling for detecting echocardiographic abnormalities. The 13 proteins in bold were found important in both PLS‐DA and XGBoost analyses for at least one of the three echocardiographic phenotypes. For PLS‐DA, red dots are positive and blue are negative correlations. Larger dots reflect greater VIP score (for PLS‐DA) or greater feature importance (for XGBoost). ACE2, angiotensin‐converting enzyme‐2; AMBP, α1‐microglobulin/bikunin precursor; AUC, area under the receiver operating curve; CTSL1, cathepsin L1; IL‐6, interleukin‐6; IL‐16, interleukin‐16; KIM‐1, kidney injury molecule‐1; LA, left atrial; LV, left ventricular; MMP‐7, matrix metalloproteinase‐7; PGF, placental growth factor; PRSS8, prostasin; TNFRSF10A, tumour necrosis factor receptor superfamily member 10A; TNFRSF11A, tumour necrosis factor receptor superfamily member 11A; TRAIL‐R2, tumour necrosis factor‐related apoptosis‐inducing ligand receptor 2; VIP, variable importance in projection.
Figure 2.
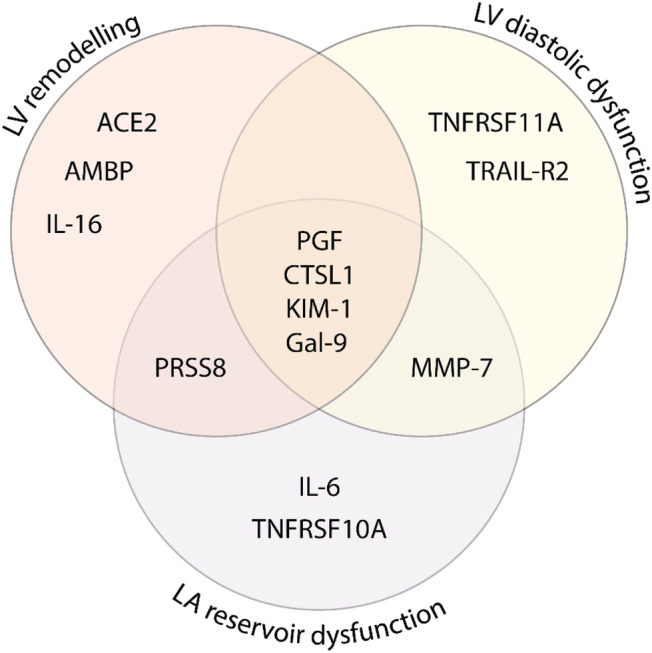
Biomarkers of cardiac remodelling and dysfunction. The Venn diagram presents the 13 biomarkers that were important in both partial least squares‐discriminant analysis and eXtreme Gradient Boosting modelling for detecting at least one of the echocardiographic abnormalities (i.e. LV remodelling, LV diastolic dysfunction, and LA reservoir dysfunction). ACE2, angiotensin‐converting enzyme‐2; AMBP, α1‐microglobulin/bikunin precursor; CTSL1, cathepsin L1; Gal‐9, galectin‐9; IL‐6, interleukin‐6; IL‐16, interleukin‐16; KIM‐1, kidney injury molecule‐1; LA, left atrial; LV, left ventricular; MMP‐7, matrix metalloproteinase‐7; PGF, placental growth factor; PRSS8, prostasin; TNFRSF10A, tumour necrosis factor receptor superfamily member 10A; TNFRSF11A, tumour necrosis factor receptor superfamily member 11A; TRAIL‐R2, tumour necrosis factor‐related apoptosis‐inducing ligand receptor 2.
Summary data of the PLS‐DA models for protein‐based identification of echocardiographic abnormalities are presented in Table 2 , and corresponding V‐plots are shown in Supporting Information, Figure S3 . ALE plots in Supporting Information, Figure S4 illustrate the separate probabilistic effect of the five most important biomarkers on the outcome prediction in the XGBoost models.
Table 2.
Summary data for the biomarkers predicting echocardiographic signs of cardiac remodelling and dysfunction by partial least squares‐discriminant analysis
| LV remodelling a | LV diastolic dysfunction | LA reservoir dysfunction | |
|---|---|---|---|
| Number of latent factors | 3 | 4 | 3 |
| % of variation explained by latent factors | |||
| For predictors (biomarkers) | 39.5 | 44.8 | 40.9 |
| For outcome (echo index) | 24.6 | 33.7 | 19.3 |
| AUC | 0.82 | 0.90 | 0.78 |
| P value | <0.0001 | <0.0001 | <0.0001 |
| Top markers responsible for outcome prediction (VIP > 1.3) |
+: ACE2 PGF KIM‐1 Gal‐9 CTSL1 PRSS8 IL‐16 AMBP −: RAGE ADAM‐TS13 TIE2 GH |
+: BNP CTSL1 Gal‐9 KIM‐1 MMP‐7 PGF TNFRSF11A TRAIL‐R2 −: TIE2 TNFRSF10A |
+: CTSL1 IL‐6 Gal‐9 KIM‐1 MMP‐7 PGF PRSS8 SPON2 TNFRSF10A TNFRSF11A TRAIL‐R2 −: GDF‐2 |
ACE2, angiotensin‐converting enzyme‐2; AMBP, α1‐microglobulin/bikunin precursor; AUC, area under the receiver operating characteristic curve; CTSL1, cathepsin L1; Gal‐9, galectin‐9; IL‐6, interleukin‐6; IL‐16, interleukin‐16; KIM‐1, kidney injury molecule‐1; LA, left atrial; LV, left ventricular; MMP‐7, matrix metalloproteinase‐7; PGF, placental growth factor; PRSS8, prostasin; TNFRSF10A, tumour necrosis factor receptor superfamily member 10A; TNFRSF11A, tumour necrosis factor receptor superfamily member 11A; TRAIL‐R2, tumour necrosis factor‐related apoptosis‐inducing ligand receptor 2; VIP, variable importance in projection.
LV remodelling was defined as having LV concentric remodelling (relative wall thickness > 0.42) and/or LV hypertrophy (LV mass ≥ 50 g/m2.7 in men and ≥ 47 g/m2.7 in women).
Supporting Information, Figure S5 presents the multivariable‐adjusted associations between the echocardiographic abnormalities and the 13 biomarkers selected by PLS‐DA and XGBoost. Multiple logistic regression confirmed most biomarkers selected by PLS‐DA and XGBoost for LV remodelling. Higher risk for LV diastolic dysfunction also remained independently associated with higher levels of PGF, KIM‐1, CTSL1, PRSS8, TRAIL‐R2, MMP‐7, and TNFRSF11A (but not galectin‐9) after correction for multiple testing. For LA reservoir dysfunction, only its association with galectin‐9 and MMP‐7 survived multiple testing correction (Supporting Information, Figure S5 ).
Supporting Information, Table S2 presents the summary data of the PLS models for protein‐based prediction of echocardiographic indexes on a continuous scale. Of note, in the prediction of the continuous echocardiographic indexes, PLS selected 11 of the 13 proteins (all but MMP‐7 and IL‐16) that were identified previously as important in both PLS‐DA and XGBoost modelling for detection of at least one of the three echocardiographic profiles (LV remodelling, LV diastolic dysfunction, and/or LA reservoir dysfunction).
Supporting Information, Figure S6 outlines the biomarkers selected by PLS‐DA and/or XGBoost for detection of the different LV remodelling profiles (summary data of the PLS‐DA models are available in Supporting Information, Table S3 ). Supporting Information, Figure S7 summarizes the proteins that were important in both PLS‐DA and XGBoost modelling for each of the three LV remodelling profiles. Notably, ACE2 was consistently identified as important for detecting all three LV remodelling profiles.
Protein interconnectivity
Supporting Information, Figure S8 shows the weighted network of the 87 biomarkers, which formed three modules. Most of the 13 biomarkers that were important in PLS‐DA and XGBoost for detection of echocardiographic abnormalities were located within one module. The complex protein interconnectivity illustrates why protein measurements should never be interpreted in isolation.
Protein‐based phenomaps of cardiac health
Using unsupervised clustering, we constructed biomarker‐based phenogroups to evaluate the potential value of the selected set of 13 biomarkers for targeted proteomic screening. Two clusters were constructed based on the lowest Davies–Bouldin index and the highest Silhouette index (indicating most optimal clustering) (Supporting Information, Figure S9 ). As such, the study sample was divided into two distinct phenogroups, with each cluster grouping individuals with a similar biomarker profile. Supporting Information, Table S4 presents the clinical and echocardiographic characteristics of the two phenogroups. The prevalence of LV remodelling, LV diastolic dysfunction, and LA reservoir dysfunction was significantly higher in Cluster 2 (n = 118) as compared with Cluster 1 (n = 457) (P < 0.0001 for all; Figure 3 A and 3 B ). Even after accounting for important confounders, individuals belonging to Cluster 2 remained at higher risk for presenting LV remodelling [odds ratio (OR) with 95% confidence interval (CI); 2.44, 1.51–3.94], LV diastolic dysfunction (OR: 2.04, CI 1.12–3.73), and LA reservoir dysfunction (OR: 1.67, CI 1.03–2.70) as those located in Cluster 1 (Table 3 ).
Figure 3.

Prevalence of subclinical cardiac remodelling and dysfunction by biomarker‐based phenogroups. An unsupervised clustering algorithm constructed the two phenogroups (‘clusters’) based on 13 proteins found important in feature selection modelling of echocardiographic signs of subclinical heart remodelling and dysfunction. LA, left atrial; LV, left ventricular.
Table 3.
Multivariable‐adjusted risk for echocardiography‐based subclinical cardiac remodelling and dysfunction by biomarker‐based phenogroups
| Cluster 2 versus Cluster 1 | Adjusted OR (95% CI) | P value |
|---|---|---|
| Risk for echocardiographic abnormality | ||
| LV remodelling | 2.44 (1.51–3.94) | 0.0003 |
| LV diastolic dysfunction | 2.04 (1.12–3.73) | 0.021 |
| LA reservoir dysfunction | 1.67 (1.03–2.70) | 0.038 |
| Risk for no. of echo abnormalities | ||
| ≥1 abnormality | 2.04 (1.16–3.60) | 0.014 |
| ≥2 abnormalities | 2.06 (1.20–3.52) | 0.0083 |
| 3 abnormalities | 4.23 (1.91–9.36) | 0.0004 |
CI, confidence interval; LA, left atrial; LV, left ventricular.
Two clusters were constructed by an unsupervised clustering algorithm from 13 proteins found important in feature selection models for echocardiographic signs of subclinical cardiac remodelling and dysfunction. Odds ratios (ORs) reflect the odds for individuals belonging to Cluster 2 (n = 118) to present echocardiographic signs of cardiac remodelling and dysfunction relative to the individuals of Cluster 1 (n = 457). ORs were adjusted for age, sex, body mass index (except LV remodelling), heart rate, systolic blood pressure, total cholesterol, antihypertensive treatment, current smoking, and history of diabetes mellitus.
Discussion
We investigated the usefulness of proteomic profiling for detection of echocardiographic signs of heart remodelling and dysfunction in the community. By combining high‐throughput proteomic profiling with feature selection algorithms capable of handling large protein networks, we identified 13 pathologically relevant proteins associated with echocardiographic signs of early‐stage HF. Next, unsupervised clustering on this focused set of proteins enabled protein‐driven identification of individuals at high risk for heart remodelling and dysfunction.
High‐throughput proteomic profiling allows exploring the network of molecular mechanisms behind subclinical heart remodelling and dysfunction. Using supervised feature selection, we first identified 13 proteins associated with echocardiographic abnormalities. These proteins reflect pathological processes behind cardiac remodelling and dysfunction related to renal function (KIM‐1, PRSS8, and ACE2), angiogenesis (PGF), extracellular matrix remodelling (galectin‐9, CTSL1, and MMP‐7), and inflammation and oxidative stress (TNFRSF10A, TRAIL‐R2, TNFRSF11A, IL‐6, IL‐16, and AMBP). These proteins may represent novel targets for the detection and management of cardiac remodelling and dysfunction.
Biomarkers related to renal function
Our analysis indicates early involvement of renal biomarkers related to tubular cell damage (KIM‐1), and homeostasis of fluid and electrolytes (PRSS8 and ACE2) in cardiac remodelling and dysfunction, even in the absence of symptomatic cardiac or renal deterioration. Previous experimental and clinical studies identified KIM‐1 as a promising biomarker for renal proximal tubule injury that is relevant in cardiovascular diseases. 23 Indeed, worsening of tubular damage biomarkers such as KIM‐1 predicted adverse events including cardiac death and HF hospitalization in 263 patients with chronic HF. 24 In addition, PRSS8 and ACE2 play an important role in blood pressure homeostasis and electrolyte balance via regulation of the renin–angiotensin–aldosterone and kallikrein–kinin systems. 25 , 26 In line, our study suggests that assessment of these markers may help to identify asymptomatic patients at risk for developing the cardiorenal syndrome.
Biomarkers of angiogenesis and extracellular matrix remodelling
Other pathways associated with cardiac remodelling and dysfunction were angiogenesis and extracellular matrix remodelling. The observed increase in PGF might indicate its involvement already in early stages of cardiac remodelling and dysfunction in response to pressure overload and ischaemia. In experimental setting, administration of exogenous PGF after acute myocardial infarction stimulates angiogenesis and improves ventricular remodelling and function. 27 Similarly, endogenous PGF was required for adaptive angiogenesis and HF prevention by inducing cardiac hypertrophy after pressure overload in mice. 28
Galectin‐9 belongs to a family of carbohydrate‐binding proteins and is produced by the extracellular matrix. Among the galectins, galectin‐3 is the most studied with regard to involvement and progression of HF so far, whereas the role of galectin‐9 in HF progression requires further investigation. Through its cytoplasmic control of AMPK, galectin‐9 is important for efficient ubiquitination during lysosomal damage and may thus affect various health conditions impacted by AMPK, including obesity, diabetes, and immune responses. 29 Similarly, CTSL1, an important lysosomal protein‐processing enzyme, may also regulate the lysosomal degradation response to stress (i.e. pressure overload) that may alter cardiac function. 30 Previous studies also reported CTSL1 activity in extracellular matrix degradation, another mechanism of cathepsin participation in the development of cardiovascular diseases. 31 Thus, lysosomal protease dysfunction may impair the autophagy–lysosomal pathway, adversely affecting protein degradation. 30
Matrix metalloproteinase‐7 is one of the metalloproteases degrading a wide range of extracellular matrix proteins, such as collagen IV, fibronectin, and laminin. 32 MMP‐7 can also cleave other MMPs, including MMP‐1, MMP‐2, and MMP‐9, leading to their activation, implicating MMP‐7 as key regulator of extracellular matrix composition and, therefore, cardiac remodelling.
Biomarkers of inflammatory and oxidative stress axis
Among markers reflecting inflammation and apoptosis, TNF family members and IL‐6 and IL‐16 were related to echocardiographic signs of cardiac remodelling and dysfunction in our cohort. TNFRSF10A and TRAIL‐R2, receptors for TNFSF10/TRAIL, are members of the death receptor superfamily and modulate apoptosis. High levels of TRAIL‐R2 were associated with incident diabetes, cardiovascular mortality, myocardial infarction, and ischaemic stroke in a large cohort of 4742 individuals recruited from the general population. 33 Another TNF superfamily member, TNFRSF11A, activates nuclear factor‐κB and participates in a wide variety of processes controlling cell proliferation, apoptosis, and vascular calcification. Associated with LA reservoir dysfunction in our study, IL‐6 significantly predicted atrial fibrillation incidence in 971 participants of the Heart and Soul Study. 34 Another biomarker highlighted in our analysis was AMBP, a precursor of α1‐microglobulin, which is up‐regulated during increased oxidative stress and can also be taken up intracellularly. 35 α1‐Microglobulin can protect against excessive intracellular oxidative stress and localize to the mitochondria to protect mitochondrial function.
Interestingly, most of the proteins highlighted in our study were identified in previous proteomic studies as predictors of symptomatic HF. Indeed, Ferreira et al. recently published a post hoc analysis on the association between targeted proteomics profiles (n = 252) with incident HF defined as the first hospitalization for HF using nested matched cases and controls selected from three different cohorts. 11 Of note, eight out of the 13 proteins identified in our study overlapped with the biomarkers reported by Ferreira et al. In contrast, our study identified proteomic signatures associated with the early changes in cardiac function and remodelling that precede HF symptoms by years to decades.
Protein‐based classification of cardiac health
Besides unravelling the molecular mechanisms behind cardiac remodelling and dysfunction, proteomic profiling may also aid the characterization of early‐stage HF in the community. Here, we provided a pipeline to integrate the most pathologically relevant proteins extracted from high‐throughput proteomic data into a protein‐based classification system for assessment of cardiac health. Indeed, we applied unbiased clustering to integrate the key proteomic markers of subclinical echocardiographic abnormalities into protein‐driven phenomaps. This approach distinguishes phenotypically distinct groups and may provide a protein‐based classification system of cardiac health in the community. Indeed, we found that the phenogroups constructed from the 13 proteins provided a clinically meaningful classification for cardiac risk stratification in asymptomatic individuals (Supporting Information, Table S2 ). Participants belonging to the second cluster were characterized by an unfavourable cardiovascular risk profile (older individuals, high prevalence of obesity, hypertension, and diabetes mellitus) and higher risk of presenting cardiac remodelling and dysfunction than the other cluster, even after adjustment for important risk factors.
Our findings may lead to better proteomic characterization of asymptomatic stages of cardiac remodelling and dysfunction. Of note, our study illustrates a pipeline to derive clinically meaningful classifiers of cardiac health from high‐throughput proteomic data. As such, the proposed protein‐based clustering may be a first step towards a protein‐based screening platform integrated within the clinical decision‐making process for identification of individuals at high risk for HF. Future studies should further validate the usefulness of integrative proteomic profiling to identify individuals at high risk for cardiac dysfunction. Future trials should also unravel the clinical relevance of the highlighted set of proteins in HF prophylaxis and therapy. Effective translation of our findings may thus facilitate the development of strategies for better diagnosis, prevention, and treatment of HF. Conjointly, protein‐driven screening, preventive and reactive strategies may help tackling the ever rising HF epidemic.
Our study has strengths and limitations. First, although all echocardiographic measurements are prone to error, two experienced observers recorded the echocardiographic images using a standardized protocol and images were post‐processed by a single observer with good reproducibility. Second, technical variability may have affected the proteomic measurements. However, the panel used in this study has been thoroughly validated regarding ranges, assay specificity and precision, repeatability and reproducibility, and endogenous interference (https://www.olink.com/resources‐support/document‐download‐center/). Third, despite the relatively large population sample, our findings remain to be externally validated in a large‐scale and racially diverse cohort. In line, our study findings should be extrapolated with caution to other ethnicities than white Europeans. Fourth, one should not infer causality from our cross‐sectional observations.
In conclusion, we identified a set of proteins associated with subclinical echocardiographic abnormalities, which may represent key targets for the detection, prevention, and management of early‐stage HF. Protein‐based clustering of individuals provided a classification system of cardiac health that may facilitate early detection of cardiac remodelling and dysfunction in the community. Future studies should validate the usefulness of integrative proteomic profiling for the management of early‐stage HF.
Conflict of interest
None declared.
Funding
This work was supported by the Research Foundation Flanders, Brussels, Belgium (grant numbers G.0880.13, 1225021N, 1S07421N, and G0C5319N).
Relationship with industry
None.
Supporting information
Table S1. Cardiovascular disease‐related protein biomarkers of the Olink Cardiovascular II panel included in the study.
Table S2 Summary Data for the Biomarkers Predicting Echocardiographic Indexes of Cardiac Structure and Function by Partial Least Squares Analysis.
Table S3 Summary Data for the Biomarkers Predicting Echocardiography‐Defined Profiles of Left Ventricular (LV) Remodelling by Partial Least Squares‐Discriminant Analysis.
Table S4 Clinical and Echocardiographic Characteristics by Biomarker‐Based Phenogroups.
Figure S1. Receiver‐Operating Characteristic (ROC) Curves for Protein‐Based Detection of Echocardiographic Abnormalities by Partial Least Squares‐Discriminant Analysis (PLS‐DA). Area under the ROC curve (AUC) was 0.82 for LV remodelling, 0.90 for LV diastolic dysfunction and 0.78 for LA reservoir dysfunction.
Figure S2. Receiver‐Operating Characteristic (ROC) Curves for Protein‐Based Detection of Echocardiographic Abnormalities by XGBoost Modelling. Area under the ROC curve (AUC) was 0.73 for LV remodelling, 0.83 for LV diastolic dysfunction and 0.72 for LA reservoir dysfunction.
Figure S3. Biomarker Associated with Cardiac Remodeling and Dysfunction in Partial Least Squares‐Discriminant Analysis (PLS‐DA). V‐plots were generated from PLS‐DA models for discrimination between normal and abnormal echocardiographic phenotypes. Markers with a VIP score above 1.3 were considered influential. Correlation coefficients were scaled and centered. LA, left atrial; LV, left ventricular; VIP, variable importance in projection.
Figure S4. Accumulated Local Effects for XGBoost with optimized hyperparameters, trained on all 87 biomarkers, shown for 5 most important biomarkers consistently selected for all three echocardiographic abnormalities. Each row belongs to a model trained on the corresponding label. Each ALE plot shows the effect of a single variable on given outcome, aligned to 0 and controlled for correlated variables and interaction effects. Only predictor values with data available (see the rug plot in each figure) should be considered. All variables exhibit a sharp non‐linear effect at a corresponding threshold value. The absolute effect of a single variable is relatively low since the outcome prediction is based on adding the effects of many variables.
Figure S5. Multivariable‐Adjusted Associations Between Echocardiographic Profiles of Cardiac Remodeling and Dysfunction and Proteins Selected in Feature Selection Modeling. We show per echocardiographic phenotype the proteins selected by both partial least squares‐discriminant analysis and XGBoost modeling for discrimination of the particular phenotype. Odds ratios (95% CI) are expressed per doubling in protein level and were adjusted for age, sex, BMI (except for LV remodeling), heart rate, systolic and diastolic blood pressure and antihypertensive treatment. An asterisk (*) indicates that the P value remained <0.05 after Holm‐Bonferroni correction for multiple testing.
Figure S6. Biomarkers of Echocardiography‐Defined Profiles of Left Ventricular Remodelling. The heat map presents the biomarkers that were in PLS‐DA (VIP > 1.3) and XGBoost modelling for detecting the LV remodelling profiles. Participants with normal LV geometry were the reference group (i.e. relative wall thickness (RWT) ≤ 0.42 and no LV hypertrophy; n = 328). For PLS‐DA, red dots are positive and blue are negative correlations. Larger dots reflect greater VIP score (for PLS‐DA) or greater feature importance (for XGBoost). AUC, area under the receiver‐operating curve; VIP, variable importance in projection.
Figure S7. Biomarkers of Echocardiography‐Defined Profiles of Left Ventricular Remodelling. The Venn diagram presents the biomarkers that were important in both PLS‐DA and XGBoost modelling for detecting at least one of the LV remodelling profile (i.e. LV concentric remodelling without hypertrophy, LV eccentric hypertrophy and LV concentric hypertrophy).
Figure S8. Network of 87 Established and Potential Protein Markers of Cardiovascular Disease from Weighted Network Analysis. Louvain modularity was used to identify distinct groups of proteins in the network. The node size represents the weighted node connectivity. The 13 biomarkers in bold were found important in both PLS‐DA and XGBoost analyses for one or more echocardiographic phenotypes. Supplemental Table S1 lists the full names and abbreviations of the 87 biomarkers.
Figure S9. Selection of the Optimal Number of Phenogroups in Unsupervised Clustering. Both Davies‐Bouldin index (DBI; lower is better) and Silhouette index (SI; higher is better) indicated 2 as the optimal number of phenogroups (‘clusters’).
Cauwenberghs, N. , Sabovčik, F. , Magnus, A. , Haddad, F. , and Kuznetsova, T. (2021) Proteomic profiling for detection of early‐stage heart failure in the community. ESC Heart Failure, 8: 2928–2939. 10.1002/ehf2.13375.
References
- 1. Cauwenberghs N, Knez J, D'hooge J, Thijs L, Yang W‐Y, Wei F‐F, Zhang Z‐Y, Staessen JA, Kuznetsova T. Longitudinal changes in LV structure and diastolic function in relation to arterial properties in general population. JACC Cardiovasc Imaging 2017; 10: 1307–1316. [DOI] [PubMed] [Google Scholar]
- 2. Yancy CW, Jessup M, Bozkurt B, Butler J, Casey DEJ, Drazner MH, Fonarow GC, Geraci SA, Horwich T, Januzzi JL, Johnson MR, Kasper EK, Levy WC, Masoudi FA, McBride PE, McMurray JJV, Mitchell JE, Peterson PN, Riegel B, Sam F, Stevenson LW, Tang WHW, Tsai EJ, Wilkoff BL. 2013 ACCF/AHA guideline for the management of heart failure: a report of the American College of Cardiology Foundation/American Heart Association Task Force on Practice Guidelines. J Am Coll Cardiol 2013; 62: e147–e239. [DOI] [PubMed] [Google Scholar]
- 3. Lieb W, Xanthakis V, Sullivan LM, Aragam J, Pencina MJ, Larson MG, Benjamin EJ, Vasan RS. Longitudinal tracking of left ventricular mass over the adult life course: clinical correlates of short‐ and long‐term change in the Framingham offspring study. Circulation United States 2009; 119: 3085–3092. [DOI] [PMC free article] [PubMed] [Google Scholar]
- 4. Kuznetsova T, Thijs L, Knez J, Herbots L, Zhang Z, Staessen JA. Prognostic value of left ventricular diastolic dysfunction in a general population. J Am Heart Assoc England 2014; 3: e000789. [DOI] [PMC free article] [PubMed] [Google Scholar]
- 5. Cauwenberghs N, Haddad F, Sabovčik F, Kobayashi Y, Amsallem M, Morris DA, Voigt JU, Kuznetsova T. Subclinical left atrial dysfunction profiles for prediction of cardiac outcome in the general population. J Hypertens 2020; 38: 2465–2474. [DOI] [PubMed] [Google Scholar]
- 6. Cauwenberghs N, Sabovčik F, Vandenabeele E, Kobayashi Y, Haddad F, Budts W, Kuznetsova T. Subclinical heart dysfunction in relation to metabolic and inflammatory markers: a community‐based study. Am J Hypertens 2021; 34(1): 46–55. [DOI] [PubMed] [Google Scholar]
- 7. Ibrahim NE, Januzzi JL. Established and emerging roles of biomarkers in heart failure. Circ Res Lippincott Williams and Wilkins 2018; 123: 614–629. [DOI] [PubMed] [Google Scholar]
- 8. Lundberg M, Eriksson A, Tran B, Assarsson E, Fredriksson S. Homogeneous antibody‐based proximity extension assays provide sensitive and specific detection of low‐abundant proteins in human blood. Nucleic Acids Res England 2011; 39: e102. [DOI] [PMC free article] [PubMed] [Google Scholar]
- 9. Lee LC, Liong C‐Y, Jemain AA. Partial least squares‐discriminant analysis (PLS‐DA) for classification of high‐dimensional (HD) data: a review of contemporary practice strategies and knowledge gaps. Analyst England 2018; 143: 3526–3539. [DOI] [PubMed] [Google Scholar]
- 10. Chen T, Guestrin C. XGBoost: a scalable tree boosting system. Proceedings of the ACM SIGKDD International Conference on Knowledge Discovery and Data Mining Association for Computing Machinery; 2016. p. 785–794.
- 11. Ferreira JP, Verdonschot J, Collier T, Wang P, Pizard A, Bär C, Björkman J, Boccanelli A, Butler J, Clark A, Cleland JG, Delles C, Diez J, Girerd N, González A, Hazebroek M, Huby A‐C, Jukema W, Latini R, Leenders J, Levy D, Mebazaa A, Mischak H, Pinet F, Rossignol P, Sattar N, Sever P, Staessen JA, Thum T, Vodovar N, Zhang Z‐Y, Heymans S, Zannad F. Proteomic bioprofiles and mechanistic pathways of progression to heart failure. Circ Heart Fail 2019; 12: e005897. [DOI] [PMC free article] [PubMed] [Google Scholar]
- 12. Kuznetsova T, Cauwenberghs N, Knez J, Yang W‐Y, Herbots L, D'hooge J, Haddad F, Thijs L, Voigt J‐U, Staessen JA. Additive prognostic value of left ventricular systolic dysfunction in a population‐based cohort. Circ Cardiovasc Imaging 2016; 9: e004661. [DOI] [PubMed] [Google Scholar]
- 13. Lang RM, Badano LP, Victor MA, Afilalo J, Armstrong A, Ernande L, Flachskampf FA, Foster E, Goldstein SA, Kuznetsova T, Lancellotti P, Muraru D, Picard MH, Retzschel ER, Rudski L, Spencer KT, Tsang W, Voigt JU. Recommendations for cardiac chamber quantification by echocardiography in adults: an update from the American Society of Echocardiography and the European Association of Cardiovascular Imaging. J Am Soc Echocardiogr Mosby Inc 2015; 28: 1–39.e14. [DOI] [PubMed] [Google Scholar]
- 14. Williams B, Mancia G, Spiering W, Agabiti Rosei E, Azizi M, Burnier M, Clement DL, Coca A, de Simone G, Dominiczak A, Kahan T, Mahfoud F, Redon J, Ruilope L, Zanchetti A, Kerins M, Kjeldsen SE, Kreutz R, Laurent S, Lip GYH, McManus R, Narkiewicz K, Ruschitzka F, Schmieder RE, Shlyakhto E, Tsioufis C, Aboyans V, Desormais I. 2018 ESC/ESH Guidelines for the management of arterial hypertension. Eur Heart J England 2018; 39: 3021–3104. [DOI] [PubMed] [Google Scholar]
- 15. Cauwenberghs N, Hedman K, Kobayashi Y, Vanassche T, Haddad F, Kuznetsova T. The 2013 ACC/AHA risk score and subclinical cardiac remodeling and dysfunction: complementary in cardiovascular disease prediction. Int J Cardiol 2019; 297: 67–74. [DOI] [PubMed] [Google Scholar]
- 16. Marwick TH, Gillebert TC, Aurigemma G, Chirinos J, Derumeaux G, Galderisi M, Gottdiener J, Haluska B, Ofili E, Segers P, Senior R, Tapp RJ, Zamorano JL. Recommendations on the use of echocardiography in adult hypertension: a report from the European Association of Cardiovascular Imaging (EACVI) and the American Society of Echocardiography (ASE). J Am Soc Echocardiogr Mosby Inc 2015; 28: 727–754. [DOI] [PubMed] [Google Scholar]
- 17. Langfelder P, Horvath S. WGCNA: an R package for weighted correlation network analysis. BMC Bioinformatics BioMed Central 2008; 9: 559. [DOI] [PMC free article] [PubMed] [Google Scholar]
- 18. Blondel VD, Guillaume JL, Lambiotte R, Lefebvre E. Fast unfolding of communities in large networks. J Stat Mech Theory Exp IOP Publishing 2008; 2008: P10008. [Google Scholar]
- 19. Pedregosa F, Varoquaux G, Gramfort A, Thirion B, Grisel O, Blondel M, Prettenhofer P, Weiss R, Dubourg V, Vanderplas J, Passos A, Brucher M. Scikit‐learn: machine learning in Python. J Mach Learn Res 2011; 12(85): 2825–2830. [Google Scholar]
- 20. Banfield JD, Raftery AE. Model‐based Gaussian and non‐Gaussian clustering. Biometrics JSTOR 1993; 49(3): 803–821. [Google Scholar]
- 21. Biernacki C, Celeux G, Govaert G. Assessing a mixture model for clustering with the integrated completed likelihood. IEEE Trans Pattern Anal Mach Intell 2000; 22: 719–725. [Google Scholar]
- 22. Onan A. Biomedical text categorization based on ensemble pruning and optimized topic modelling. Comput Math Methods Med Hindawi Limited 2018; 2018: 2497471. [DOI] [PMC free article] [PubMed] [Google Scholar]
- 23. Medić B, Rovčanin B, Basta Jovanović G, Radojević‐Škodrić S, Prostran M. Kidney injury molecule‐1 and cardiovascular diseases: from basic science to clinical practice. Biomed Res Int 2015; 2015: 854070. [DOI] [PMC free article] [PubMed] [Google Scholar]
- 24. Brankovic M, Akkerhuis KM, Hoorn EJ, van Boven N, van den Berge JC, Constantinescu A, Brugts J, van Ramshorst J, Germans T, Hillege H, Boersma E, Umans V, Kardys I. Renal tubular damage and worsening renal function in chronic heart failure: clinical determinants and relation to prognosis (Bio‐SHiFT study). Clin Cardiol 2020; 43: 630–638. [DOI] [PMC free article] [PubMed] [Google Scholar]
- 25. Wang C, Chao J, Chao L. Adenovirus‐mediated human prostasin gene delivery is linked to increased aldosterone production and hypertension in rats. Am J Physiol Regul Integr Comp Physiol 2003; 284: R1031–R1036. [DOI] [PubMed] [Google Scholar]
- 26. Gheblawi M, Wang K, Viveiros A, Nguyen Q, Zhong J‐C, Turner AJ, Raizada MK, Grant MB, Oudit GY. Angiotensin‐converting enzyme 2: SARS‐CoV‐2 receptor and regulator of the renin‐angiotensin system: celebrating the 20th anniversary of the discovery of ACE2. Circ Res 2020; 126: 1456–1474. [DOI] [PMC free article] [PubMed] [Google Scholar]
- 27. Luo L, Chen B, Huang Y, Liang Z, Li S, Yin Y, Chen J, Wu W. Cardioprotective activity of placental growth factor combined with oral supplementation of l‐arginine in a rat model of acute myocardial infarction. Drug Des Devel Ther 2016; 10: 3483–3492. [DOI] [PMC free article] [PubMed] [Google Scholar]
- 28. Accornero F, van Berlo JH, Benard MJ, Lorenz JN, Carmeliet P, Molkentin JD. Placental growth factor regulates cardiac adaptation and hypertrophy through a paracrine mechanism. Circ Res 2011; 109: 272–280. [DOI] [PMC free article] [PubMed] [Google Scholar]
- 29. Jia J, Bissa B, Brecht L, Allers L, Choi SW, Gu Y, Zbinden M, Burge MR, Timmins G, Hallows K, Behrends C, Deretic V. AMPK, a regulator of metabolism and autophagy, is activated by lysosomal damage via a novel galectin‐directed ubiquitin signal transduction system. Mol Cell 2020; 77: 951–969.e9. [DOI] [PMC free article] [PubMed] [Google Scholar]
- 30. Sun M, Ouzounian M, de Couto G, Chen M, Yan R, Fukuoka M, Li G, Moon M, Liu Y, Gramolini A, Wells GJ, Liu PP. Cathepsin‐L ameliorates cardiac hypertrophy through activation of the autophagy‐lysosomal dependent protein processing pathways. J Am Heart Assoc 2013; 2: e000191. [DOI] [PMC free article] [PubMed] [Google Scholar]
- 31. Zhang X, Luo S, Wang M, Shi GP. Cysteinyl cathepsins in cardiovascular diseases. Biochim Biophys Acta Proteins Proteomics 1868; 2020. [DOI] [PMC free article] [PubMed] [Google Scholar]
- 32. DeLeon‐Pennell KY, Meschiari CA, Jung M, Lindsey ML. Matrix metalloproteinases in myocardial infarction and heart failure. Prog Mol Biol Transl Sci 2017; 147: 75–100. [DOI] [PMC free article] [PubMed] [Google Scholar]
- 33. Mattisson IY, Björkbacka H, Wigren M, Edsfeldt A, Melander O, Fredrikson GN, Bengtsson E, Gonçalves I, Orho‐Melander M, Engström G, Almgren P, Nilsson J. Elevated markers of death receptor‐activated apoptosis are associated with increased risk for development of diabetes and cardiovascular disease. EBioMedicine 2017; 26: 187–197. [DOI] [PMC free article] [PubMed] [Google Scholar]
- 34. Marcus GM, Whooley MA, Glidden DV, Pawlikowska L, Zaroff JG, Olgin JE. Interleukin‐6 and atrial fibrillation in patients with coronary artery disease: data from the Heart and Soul Study. Am Heart J 2008; 155: 303–309. [DOI] [PMC free article] [PubMed] [Google Scholar]
- 35. Kristiansson A, Gram M, Flygare J, Hansson SR, Åkerström B, Storry JR. The role of α1‐microglobulin (A1M) in erythropoiesis and erythrocyte homeostasis—therapeutic opportunities in hemolytic conditions. Int J Mol Sci 2020; 21: 1–22. [DOI] [PMC free article] [PubMed] [Google Scholar]
Associated Data
This section collects any data citations, data availability statements, or supplementary materials included in this article.
Supplementary Materials
Table S1. Cardiovascular disease‐related protein biomarkers of the Olink Cardiovascular II panel included in the study.
Table S2 Summary Data for the Biomarkers Predicting Echocardiographic Indexes of Cardiac Structure and Function by Partial Least Squares Analysis.
Table S3 Summary Data for the Biomarkers Predicting Echocardiography‐Defined Profiles of Left Ventricular (LV) Remodelling by Partial Least Squares‐Discriminant Analysis.
Table S4 Clinical and Echocardiographic Characteristics by Biomarker‐Based Phenogroups.
Figure S1. Receiver‐Operating Characteristic (ROC) Curves for Protein‐Based Detection of Echocardiographic Abnormalities by Partial Least Squares‐Discriminant Analysis (PLS‐DA). Area under the ROC curve (AUC) was 0.82 for LV remodelling, 0.90 for LV diastolic dysfunction and 0.78 for LA reservoir dysfunction.
Figure S2. Receiver‐Operating Characteristic (ROC) Curves for Protein‐Based Detection of Echocardiographic Abnormalities by XGBoost Modelling. Area under the ROC curve (AUC) was 0.73 for LV remodelling, 0.83 for LV diastolic dysfunction and 0.72 for LA reservoir dysfunction.
Figure S3. Biomarker Associated with Cardiac Remodeling and Dysfunction in Partial Least Squares‐Discriminant Analysis (PLS‐DA). V‐plots were generated from PLS‐DA models for discrimination between normal and abnormal echocardiographic phenotypes. Markers with a VIP score above 1.3 were considered influential. Correlation coefficients were scaled and centered. LA, left atrial; LV, left ventricular; VIP, variable importance in projection.
Figure S4. Accumulated Local Effects for XGBoost with optimized hyperparameters, trained on all 87 biomarkers, shown for 5 most important biomarkers consistently selected for all three echocardiographic abnormalities. Each row belongs to a model trained on the corresponding label. Each ALE plot shows the effect of a single variable on given outcome, aligned to 0 and controlled for correlated variables and interaction effects. Only predictor values with data available (see the rug plot in each figure) should be considered. All variables exhibit a sharp non‐linear effect at a corresponding threshold value. The absolute effect of a single variable is relatively low since the outcome prediction is based on adding the effects of many variables.
Figure S5. Multivariable‐Adjusted Associations Between Echocardiographic Profiles of Cardiac Remodeling and Dysfunction and Proteins Selected in Feature Selection Modeling. We show per echocardiographic phenotype the proteins selected by both partial least squares‐discriminant analysis and XGBoost modeling for discrimination of the particular phenotype. Odds ratios (95% CI) are expressed per doubling in protein level and were adjusted for age, sex, BMI (except for LV remodeling), heart rate, systolic and diastolic blood pressure and antihypertensive treatment. An asterisk (*) indicates that the P value remained <0.05 after Holm‐Bonferroni correction for multiple testing.
Figure S6. Biomarkers of Echocardiography‐Defined Profiles of Left Ventricular Remodelling. The heat map presents the biomarkers that were in PLS‐DA (VIP > 1.3) and XGBoost modelling for detecting the LV remodelling profiles. Participants with normal LV geometry were the reference group (i.e. relative wall thickness (RWT) ≤ 0.42 and no LV hypertrophy; n = 328). For PLS‐DA, red dots are positive and blue are negative correlations. Larger dots reflect greater VIP score (for PLS‐DA) or greater feature importance (for XGBoost). AUC, area under the receiver‐operating curve; VIP, variable importance in projection.
Figure S7. Biomarkers of Echocardiography‐Defined Profiles of Left Ventricular Remodelling. The Venn diagram presents the biomarkers that were important in both PLS‐DA and XGBoost modelling for detecting at least one of the LV remodelling profile (i.e. LV concentric remodelling without hypertrophy, LV eccentric hypertrophy and LV concentric hypertrophy).
Figure S8. Network of 87 Established and Potential Protein Markers of Cardiovascular Disease from Weighted Network Analysis. Louvain modularity was used to identify distinct groups of proteins in the network. The node size represents the weighted node connectivity. The 13 biomarkers in bold were found important in both PLS‐DA and XGBoost analyses for one or more echocardiographic phenotypes. Supplemental Table S1 lists the full names and abbreviations of the 87 biomarkers.
Figure S9. Selection of the Optimal Number of Phenogroups in Unsupervised Clustering. Both Davies‐Bouldin index (DBI; lower is better) and Silhouette index (SI; higher is better) indicated 2 as the optimal number of phenogroups (‘clusters’).