. 2021 Jul 19;10:e68603. doi: 10.7554/eLife.68603

Figure 1. Single-cell RNA sequencing (scRNA-seq) identifies dynamic cellular state transitions of tubular epithelial cells after severe IRI.

(A) Drop-seq strategy. uIRI, unilateral IRI. A schematic illustration of epithelial cell states is shown. (B) and (C) Integrated single-cell transcriptome map. Unsupervised clustering identified 21 distinct clusters in the UMAP plot. Arrowheads indicate damage-associated tubular epithelial cells. The dotted area (PT cell clusters; PT and DA-PT) was used for the downstream analyses in (D)–(G). (D) UMAP plots showing the expression of indicated genes in PT cell clusters (PT and DA-PT in (B)). Differentiated/mature PT cell markers: Lrp2 (megalin), Slc34a1 (sodium-dependent phosphate transporter 2a, NaPi2a), Acsm2 (acyl-coenzyme A synthetase), and Hnf4a (hepatocyte nuclear factor 4α); and damage-induced genes: Vcam1 (vascular adhesion molecule 1), Cdh6 (cadherin 6), Havcr1 (kidney injury molecule-1, KIM1), Sox9 (Sry-box 9). Arrowheads; DA-PT. (E) Immunostaining for SOX9 and VCAM1 using post-severe IRI kidneys on day 21. Scale bar: 20 μm. (F) Pseudotime trajectory analysis of proximal tubular cells (PT and DA-PT clusters) that underwent IRI. A region occupied with cells from 6 hr after post-IRI was set as a starting state. (G) RNA velocity analysis of PT clusters (PT and DA-PT) from post-IRI kidneys on day 7. Cells in PT clusters from IRI day 7 dataset was extracted for the analysis. The arrows indicate predicted lineage trajectories. PT, proximal tubule; DA-PT, damage-associated PT; TL, thin limb; TAL, thick ascending limb; DA-TAL, damage-associated TAL; DCT, distal convoluted tubule; DA-DCT, damage-associated DCT; CNT, connecting tubule; CD, collecting duct (P, principal cells, IC, intercalated cells); Mes, mesangial cells; Endo, endothelial cells; SMC, smooth muscle cells; Fib, fibroblasts; Mac, macrophages; Mono, monocytes; DC, dendritic cells.

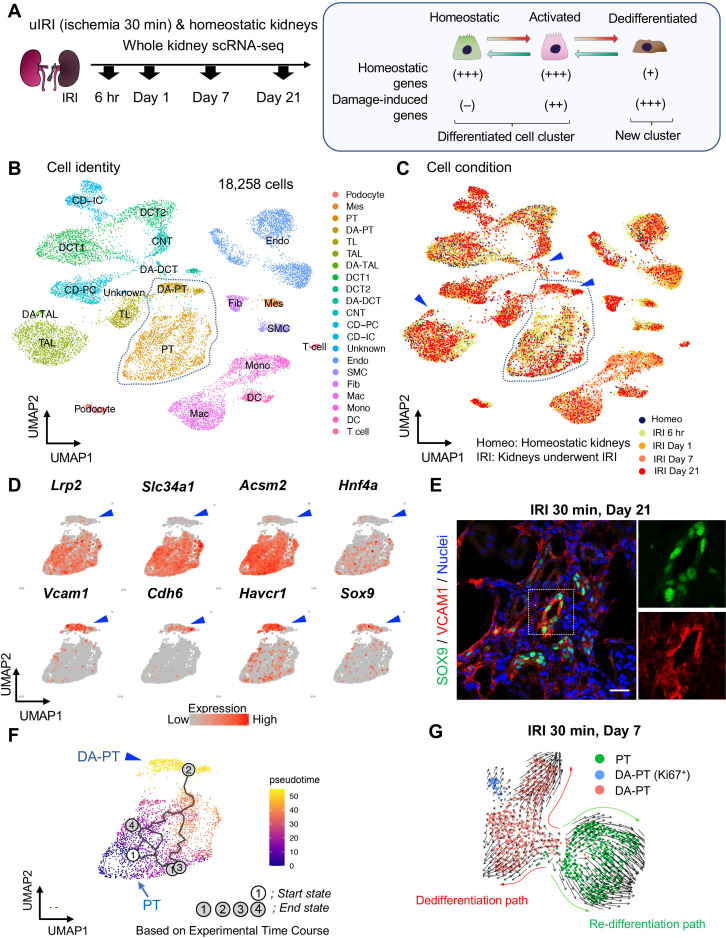
Figure 1.

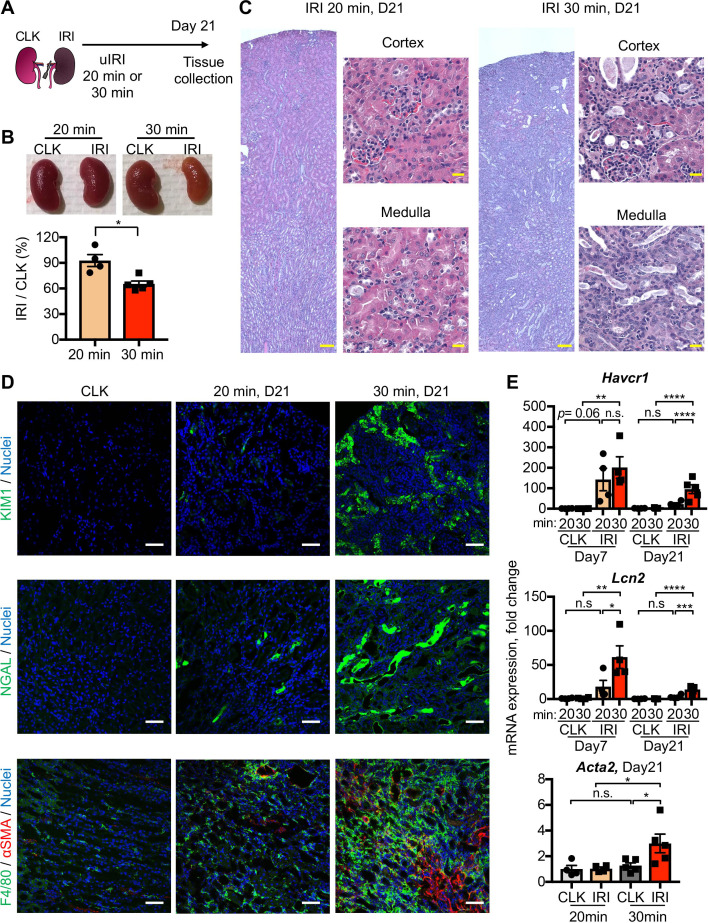
Figure 1—figure supplement 1. Characterization of severe and mild unilateral IRI models.

Figure 1—figure supplement 1.

(A) Experimental workflow for the mild and severe IRI models. Left kidneys from wild-type C57BL/6J mice were subjected to mild (20 min) and severe (30 min) ischemia. Contralateral kidneys (CLK) were used as controls. uIRI, unilateral IRI. Kidneys were harvested on day 21 post-IRI. (B) Severe IRI results in renal atrophy. Relative size of post-IRI kidney compared to contralateral kidney (CLK) was quantified. N = 4–5. (C) Hematoxylin-eosin staining of IRI kidneys on day 21 (D21). Note that severe-IRI resulted in tubular dilatation, flattening of tubular epithelial cells, cast formation, and inflammatory cell infiltration. (D) Immunofluorescence for KIM1, NGAL, F4/80, and αSMA. Severe IRI resulted in persistent expression of proximal and distal tubular injury markers. Kidney injury molecule 1, KIM1 (encoded by Havcr1) is a marker for proximal tubular injury. Neutrophil gelatinase-associated lipocalin, NGAL (encoded by Lcn2) is a marker for distal tubular injury. Note that post-severe IRI kidneys exhibit accumulation of F4/80+ cells (mostly macrophages) and αSMA+ myofibroblasts in renal interstitium, both are classical features of failed renal repair. (E) Real-time PCR analyses of indicated gene expression. Acta2 gene encodes αSMA. N = 4–5. Scale bars: 100 μm in stitched images of (C); 20 μm in higher magnifications of (C); 50 μm in (D). *p < 0.05; **p < 0.01; ***p < 0.001; ****p < 0.0001. Unpaired Student’s t-test for (B) and one-way ANOVA with post hoc multiple comparisons test for (E).
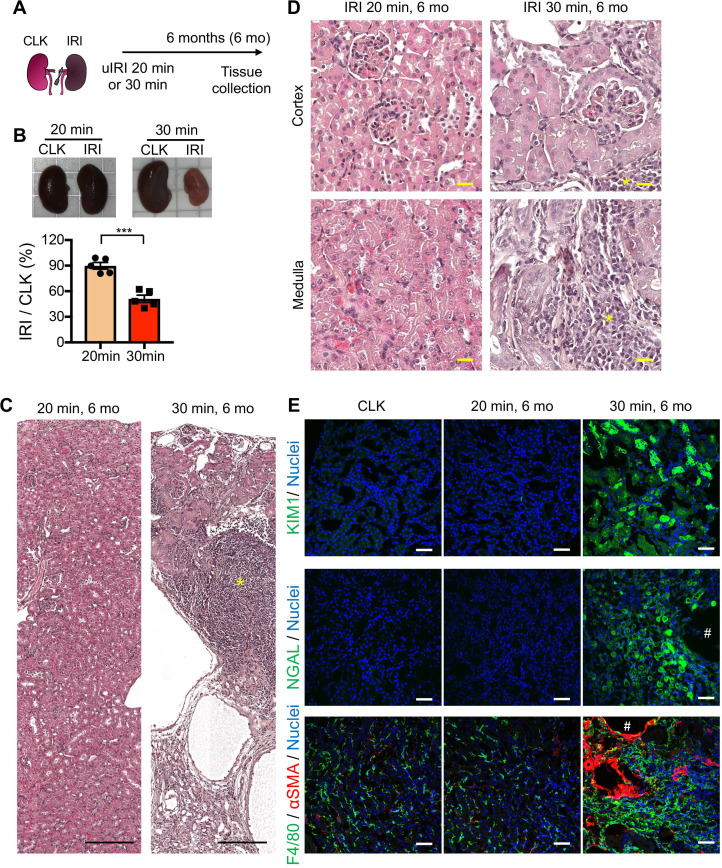
Figure 1—figure supplement 2. Severe IRI leads to cystic and atrophic kidneys 6 months after severe IRI.

Figure 1—figure supplement 2.

(A) Experimental workflow for mild and severe IRI models with long-term observation. Kidneys were harvested on 6 months post-IRI. (B) Severe IRI (30 min ischemia) results in marked renal atrophy on 6 months post-IRI. Relative size of post-IRI kidney compared to contralateral kidney (CLK) was quantified. N = 5. Unpaired Student’s t-test. (C) and (D) Hematoxylin-eosin staining of IRI kidneys. Note that severe-IRI resulted in flattened and necrotic tubular epithelial cells with massive infiltration of inflammatory cells, which occupied the renal parenchyma. * indicates clusters of inflammatory cells, occupying renal parenchyma. (E) Immunofluorescence for KIM1, NGAL, F4/80, and αSMA. Severe IRI resulted in persistent expression of proximal and distal tubular injury markers (KIM1 and NGAL, respectively). Note that post-severe IRI kidneys exhibit accumulation of F4/80+ myeloid cells (mostly macrophages) and αSMA+ myofibroblasts in renal interstitium. Small cystic structures (#) were encircled by myofibroblasts. Scale bars: 20 μm in (C), 200 μm in (D) and 50 μm in (E).
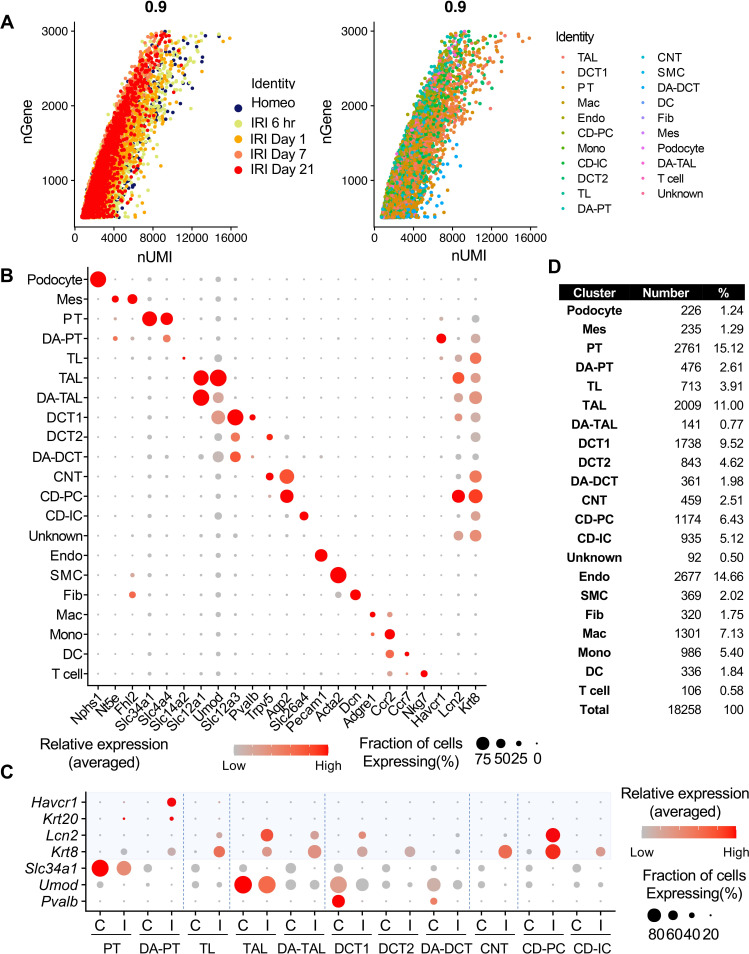
Figure 1—figure supplement 3. scRNA-seq identifies major cell types in homeostatic and post-IRI kidneys.

Figure 1—figure supplement 3.

(A) Pearson correlation plot showing the linear relationship between the number of genes (nGene) and unique molecular identifiers (nUMI). Experimental conditions and cell types are color-coded. (B) Dot plot shows the gene expression patterns of cluster-enriched canonical markers. Note that damage-associated tubular epithelial cells (DA-PT, DA-TAL, and DA-DCT) have reduced expression of canonical cellular markers. (C) Tubular injury marker gene expressions are selectively observed in damaged kidneys (IRI) but not in homeostatic control kidneys. ‘C’ indicates cells from the control homeostatic kidneys. ‘I’ indicates cells from IRI kidneys from all time points. Proximal tubule-specific injury markers (Havcr1, Krt20), distal tubule-specific injury markers (Lcn2), and pan-tubular injury marker (Krt8) are shown. Both homeostatic and activated cells show high canonical cell type marker gene expressions, such as Slc34a1 in PT, but damage-associated clusters (DA-PT, DA-TAL, DA-DCT) show reduced homeostatic gene expressions and increased damage-induced gene expressions (See Figure 1A). (D) Our single-cell preparation resulted in high yields of podocytes (1.24%) and endothelial cells (14.66%). Abbrev: PT, proximal tubule; TL, thin limb; TAL, thick ascending limb; DCT, distal convoluted tubule (DCT1 and DCT2); CNT, connecting tubule; CD, collecting duct (P, principal cells, IC, intercalated cells); Mes, mesangial cells; Endo, endothelial cells; SMC, smooth muscle cells; Fib, fibroblasts; Mac, macrophages; Mono, monocytes; DC, dendritic cells; DA-PT, damage-associated PT; DA-TAL, damage-associated TAL; DA-DCT, damage-associated DCT.
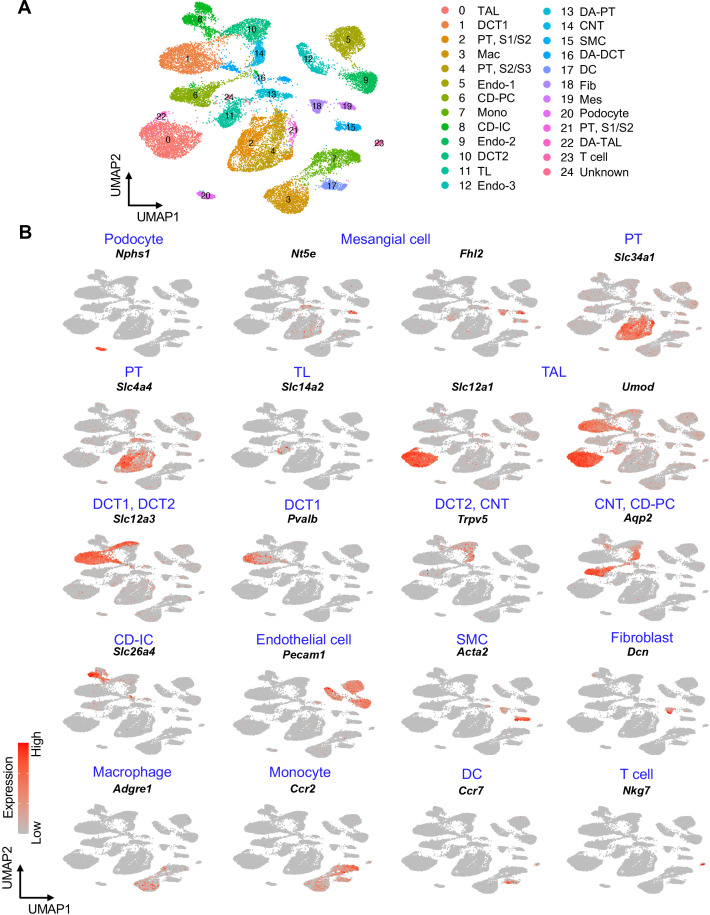
Figure 1—figure supplement 4. UMAP plots show the expression pattern of anchor genes in homeostatic and post-IRI kidneys.

Figure 1—figure supplement 4.

(A) UMAP plots show the identified cell clusters (resolution was set as 1.0). (B) UMAP plots show the expression pattern of indicated canonical marker genes (anchor genes) of each cluster. We manually combined three clusters of differentiated/mature proximal tubular cells (PT, S1/S2 and PT, S2/S3) into one cluster (PT) to generate a more coarse-grained cell-type annotation and data visualization in other figures. We also combined three clusters of endothelial cells (Endo-1, Endo-2, and Endo-3) into one cluster (Endo) for data visualization in other figures. S1, S1 segment; S2, S2 segment 2; S3, S3 segment of proximal tubule.
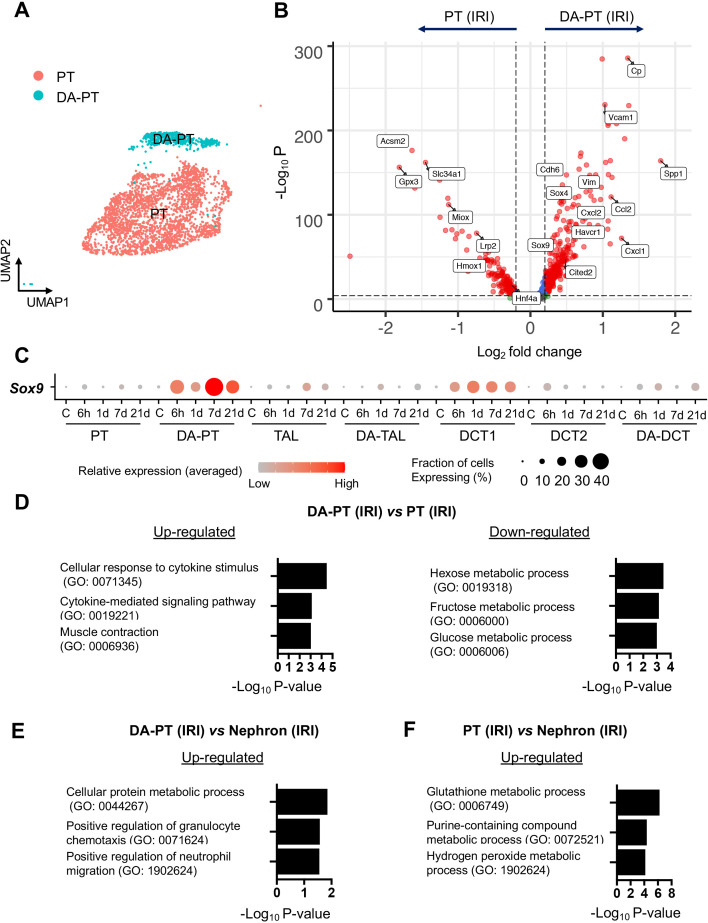
Figure 1—figure supplement 5. Damage-associated PT cells show an inflammatory transcriptional signature.

Figure 1—figure supplement 5.

(A) UMAP of PT clusters (PT, differentiated proximal tubular cell cluster; DA-PT, damage-associated proximal tubular cell cluster). See Figure 1B. (B) Volcano plot showing a distinct transcriptional profile of damage-associated PT cells (PT cells in DA-PT cluster). A Wilcoxon rank-sum test was used for the statistical analysis comparing cells in PT cluster from IRI kidneys and cells in DA-PT cluster from IRI kidneys. Blue and gray data points indicate transcripts that fall below the set threshold for fold change (Log2 fold change, a threshold value of 0.25) and p value (a cutoff value of 10e-5). Note that cells in the DA-PT cluster show reduced expression of homeostatic marker genes (Acsm2, Slc34a1, and Lrp2), oxidative stress defense genes (Hmox, Miox, and Gpx3), and a gene encodes transcription factor for PT maturation in renal development (Hnf4a). The cells in the DA-PT cluster also show enrichment of developmental genes (Sox4, Sox9, Cited2, and Cdh6), damage-induced genes (Havcr1 and Vcam1) and inflammatory cytokines and chemokines (Spp1, Ccl2, Cxcl1, and Cxcl2). (C) Dot plots show the expression of Sox9 gene is highly enriched in damage-associated PT (DA-PT) cell population. (D) and (E) Gene ontology enrichment analyses identify that DA-PT cluster is enriched for immune response gene ontology. The cells in the DA-PT cluster from IRI kidneys (all time points) were compared with the cells in the PT cluster or cells in all other nephron segments and collecting duct (IRI kidneys, all time points) in (D) and (E), respectively. (F) Gene Ontology enrichment analyses identify the PT cluster is enriched for glutathione-mediated anti-oxidative stress responses. The cells in the PT cluster from IRI kidneys (all time points) were compared with the cells from all other nephron segments and collecting duct from IRI kidneys (all time points).
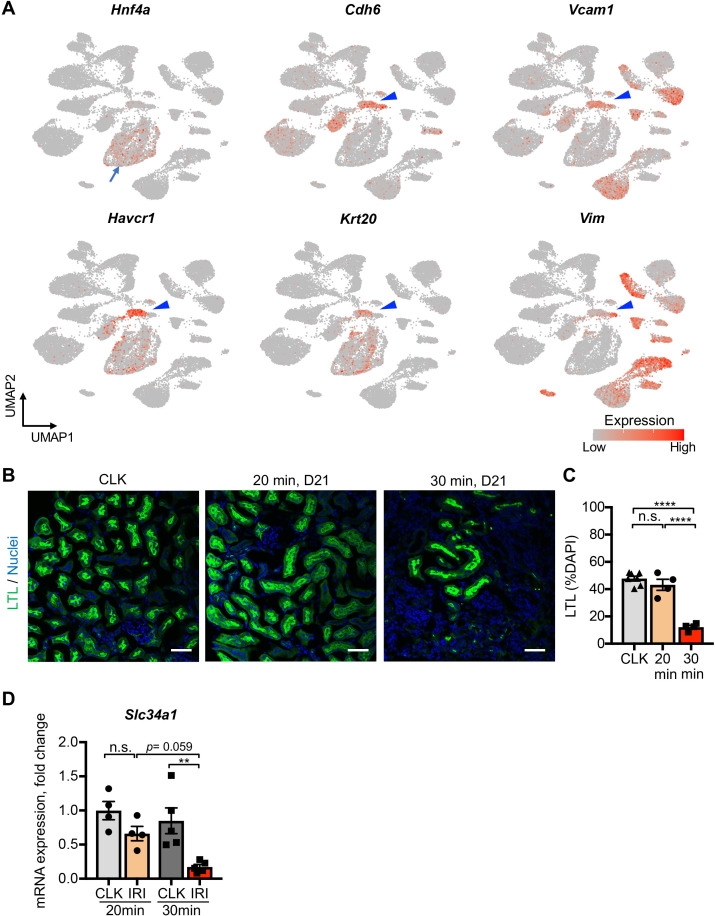
Figure 1—figure supplement 6. Severe IRI reduces expressions of proximal tubular differentiation markers.

Figure 1—figure supplement 6.

(A) UMAP plots showing the expression of indicated genes. Note that damage-associated PT cell state (cells in DA-PT cluster) are enriched with damage-induced genes (Havcr1, Krt20, Vcam1, and Vim) and exhibit less differentiated signature (upregulation of Cdh6 and downregulation of Hnf4a). Arrow, PT cells; arrowheads; DA-PT cells. (B) and (C) Comparative analyses of kidneys underwent severe IRI (ischemic time 30 min) and mild IRI (ischemic time 20 min). Kidneys were harvested on day 21 post-IRI. Severe IRI reduces LTLhigh proximal tubular cells. Lotus tetragonolobus lectin (LTL) binds fully differentiated proximal tubular cells. LTLhigh areas from kidneys on day 21 were quantified. Wild-type C57BL/6J mice were used. Scale bars: 50 μm. N = 4–7. (D) Real-time PCR analyses of Slc34a1. mRNA expression of Slc34a1 was reduced after severe IRI (ischemic time 30 min on day 21). Whole kidney lysates from post-IRI kidneys on day 21 were used. Contralateral kidneys (CLK) were used as controls. N = 4–5. **p < 0.01; ****p < 0.0001, one-way ANOVA with post hoc multiple comparisons test.
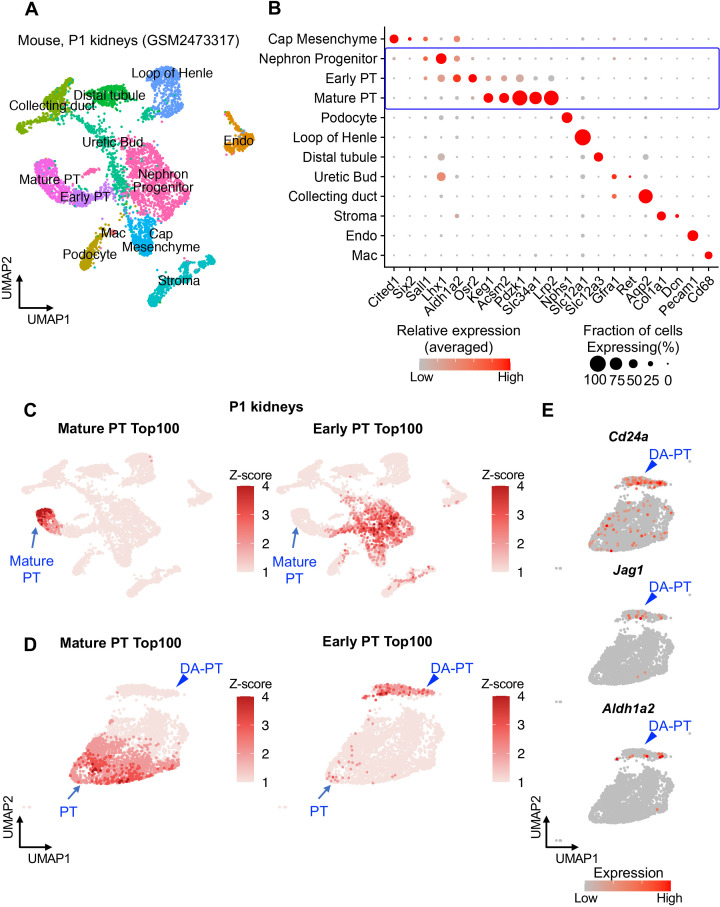
Figure 1—figure supplement 7. Comparative analyses of damage-associated PT cells and neonatal proximal tubular cells.

Figure 1—figure supplement 7.

(A) and (B) Characterization of mouse neonatal kidney single-cell RNA-seq data. UMAP plots show mouse neonatal kidney cells from GSM2473317 (4693 cells; post-natal day 1) in (A). Dot plots show the gene expression patterns of cluster-enriched canonical markers in (B). (C) UMAP rendering of Top 100 genes characterizing mature and immature early proximal tubular (PT) cells. We obtained the top 100 genes representing mature PT and immature early PT cells by performing differential gene expression analysis using the ‘FindMarkers’ command in Seurat. As expected, the mature PT Top 100 genes are enriched in mature PT cluster. The early PT Top 100 genes are enriched in immature early PT and nephron progenitor clusters. (D) UMAP rendering of mature and early PT genes on adult PT clusters from our dataset (PT and DA-PT). Note that the early PT Top 100 genes are highly enriched in damage-associated PT (DA-PT) population, indicating they are in a less differentiated state. (E) UMAP plots showing gene expressions of early PT genes (Cd24a, Jag1, and Aldh1a2) are enriched in DA-PT cluster.
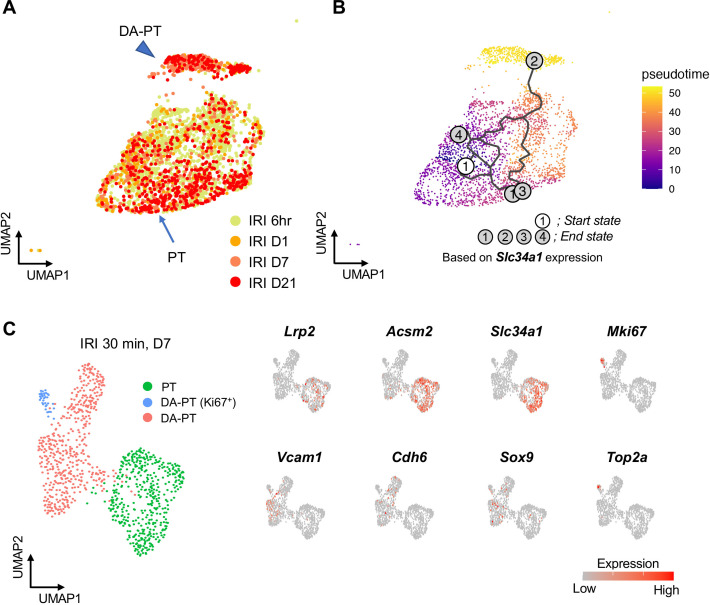
Figure 1—figure supplement 8. Trajectory analyses predict lineage hierarchy from differentiated mature PT cells to damage-associated PT cells.

Figure 1—figure supplement 8.

(A) UMAP plots showing mature and damage-associated PT cells (PT and DA-PT clusters) underwent IRI. (B) Pseudotime trajectory analysis using Monocle 3. A region occupied with Slc34a1high cells was set as a starting state. Note that predicted trajectory starting from PT to DA-PT state. See Figure 1F for the analysis with a different starting ‘root’ setting. The earliest time point of injury was used as a starting root in Figure 1F. Both analyses resulted in a similar predicted trajectory. (C) UMAP plots showing proximal tubular cells from PT and DA-PT clusters on IRI day 7 (D7) . Cells from post-IRI kidneys on day seven are shown and used for RNA velocity analysis to investigate potential cellular plasticity at this stage (single data point). See Figure 1G for RNA velocities (trajectory). UMAP plots in the right panels show the indicated genes; homeostatic genes (Lrp2, Acsm2, and Slc34a1), damage-induced genes (Vcam1, Cdh6, and Sox9), and cellular proliferation (Mki67 and Top2a). Fig. S8A and S8B are supporting data for Figure 1F. Fig. S8C is supporting data for Figure 1G.