

Abstract
Background:
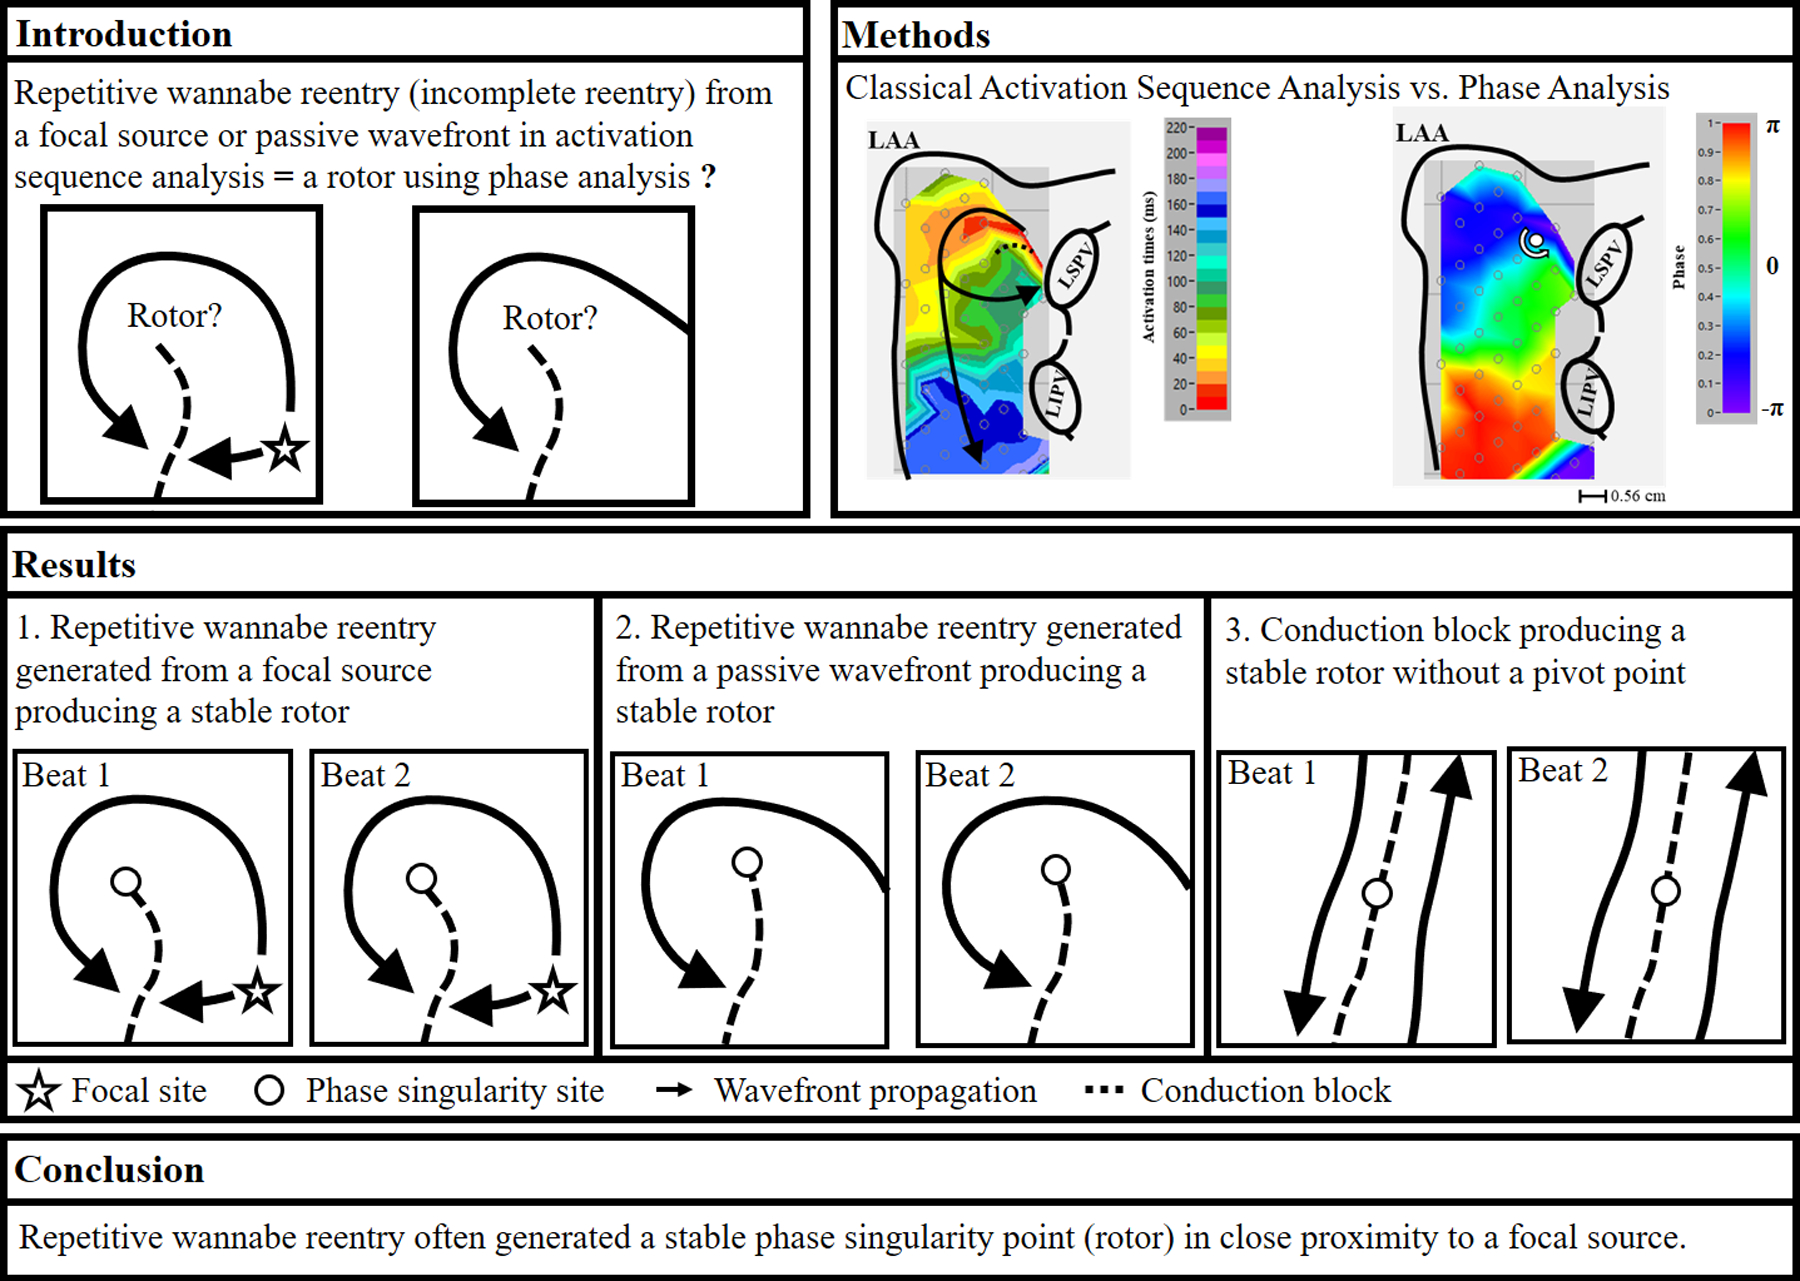
Recent contact mapping studies in patients with persistent atrial fibrillation (AF) demonstrated that phase analysis produced a different mechanistic result than classical activation sequence analysis. Our studies in patients with persistent AF showed that focal sources sometimes produced repetitive wannabe reentry, i.e., incomplete reentry.
Objective:
This study was to test the hypotheses that 1) when using phase analysis, repetitive wannabe reentry produces a phase singularity point, i.e., a rotor; 2) the location of the stable rotor is close to the focal source.
Methods:
During open heart surgery, we recorded activation from both atria simultaneously using 510–512 electrodes in 12 patients with persistent AF. We performed activation sequence mapping and phase analyses on 4 seconds of mapped data. For each detected stable rotor (> 2 full rotations [720°] recurring at the same site), the corresponding activation patterns were examined from the activation sequence maps.
Results:
During AF, phase singularity points (rotors) were identified in both atria in all patients. However, stable phase singularity points were only present in 6/12 patients. The range of stable phase singularity points per patient was 0 – 6 (total 14). Stable phase singularity points were produced due to repetitive wannabe reentry generated from a focal source or by passive activation. A conduction block sometimes created a stable phase singularity point (2 patients). The average distance between a focal source and a stable rotor was 0.9±0.3 cm.
Conclusions:
Repetitive wannabe reentry generated stable rotors adjacent to a focal source. No true reentry occurred.
Keywords: atrial fibrillation, mapping, focal sources, reentry, rotors
Condensed Abstract
Recent studies in patients with persistent atrial fibrillation (AF) demonstrated that phase analysis produces a different mechanistic result than classical activation sequence analysis. Our data demonstrated that repetitive wannabe reentry identified by activation sequence analysis produced a stable phase singularity point (“rotor”) identified by phase analysis. Importantly, repetitive focal activation can produce a repetitive wannabe reentry that generates a stable phase singularity point (“rotor”) adjacent to a site of focal activation. These findings support the possibility that targeted ablation that terminates AF at apparent rotor sites may be an ablation of focal sources that drive AF.
Introduction
The mechanism(s) of persistent and long-standing persistent (LSP) atrial fibrillation (AF) is/are not well understood. There is growing evidence that AF is driven by localized atrial sources, such as focal sources or different types of reentry, including rotors (1–9). Endocardial catheter ablation studies using phase analysis in patients with persistent and LSP AF reported that targeted ablation of apparent rotors sometimes terminated the AF (1,2). The location of a rotor was identified by a phase singularity point, and was used to target rotor ablation. Nevertheless, many questions remain, including both the use of phase analysis, and the spatial resolution of the mapping catheter since poor spatial resolution results in distortion of interpretation of rotors (10–19). Interestingly, recent mapping studies using an endocardial low-density basket catheter, and epicardial high-density mapping in patients with persistent AF demonstrated that phase analysis produces a different mechanistic result than classical activation sequence analysis (20,21). Our classical activation sequence mapping in patients with persistent and LSP AF demonstrated that all wavefronts emanating from focal sources (focal and/or nonrandom breakthrough sites) maintained AF. No complete reentry was found, however, repetitive wannabe reentry, i.e., incomplete reentry, produced from a focal source was demonstrated. Wannabe reentry is a wavefront that circulates around a functional line of block that wants-to-become a reentrant circuit, but cannot complete the revolution because it collides with a line of block or another wavefront (see conceptual examples of two consecutive beats in figure 1A) (22,23). Recent mapping studies using either noninvasive or endocardial contact mapping demonstrated that wannabe reentry may be misinterpreted as a rotor (15,24). Using high density epicardial mapping data during AF in patients with persistent and LSP AF, the purpose of this study was to test the hypothesis that 1) when using phase analysis, a repetitive wannabe reentry will produce a stable phase singularity point, i.e., a rotor, and 2) when a focal source generates wannabe reentry, the location of the detected stable rotor is close to the focal source.
Figure 1:
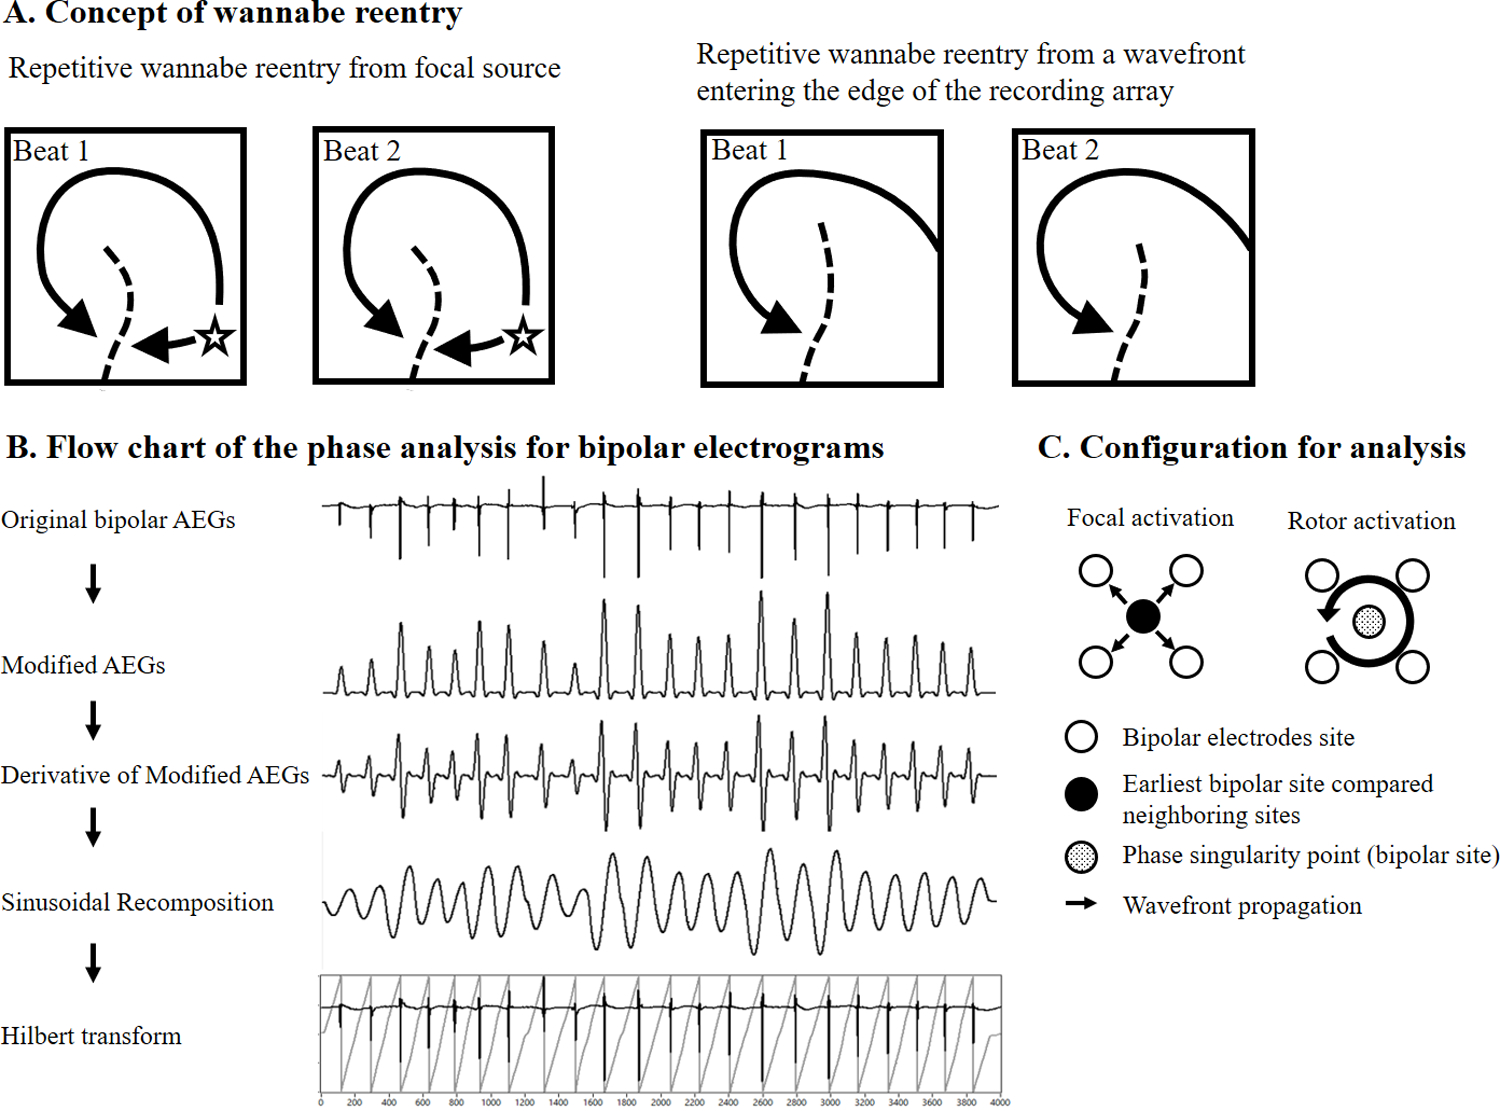
Panel A: Conceptually simplified examples of two consecutive beats showing collision with a line of block creating repetitive wannabe reentry. Left panel, a repetitive wannabe reentry generated by a wavefront emanating from a focal source. Right panel, a repetitive wannabe reentry generated by a passive wavefront. Panel B: Flow chart of the phase analysis and the signal processing procedures that were applied to the original bipolar AEGs. Panel C: Each bipolar site was assigned a 2×2 grid of surrounding bipolar neighboring sites. Each bipolar site and four surrounding bipolar sites were used for the determination of focal activation and a rotor activation. AEGs, atrial electrograms
Methods
The research protocol was approved by the Institutional Review Board at University Hospitals Cleveland Medical Center. Twelve patients with persistent and LSP AF (1 month - 9 years duration) were studied during open heart surgery (Supplementary Table 1). All patients gave written informed consent before their surgery. Using standard techniques previously described (23), atrial epicardial mapping studies were performed during open heart surgery in patients with persistent and LSP AF after the heart was exposed using standard surgical procedures. Three electrode arrays with a total of 510 electrodes (first four patients) or 512 electrodes (subsequent eight patients) covering a total area of 92.85 cm2 were placed on the atrial epicardial surface of both atria for simultaneous recording, as previously described (23). The interelectrode distance between each bipolar electrode pair was 1.2 or 1.5 mm, respectively, and the distance between the center of each bipolar pair and its neighbors varied from 5.2 −7.0 mm (See more detailed in Supplementary). Atrial electrograms (AEGs) from 510 – 512 electrodes (255 – 256 bipolar pairs) along with ECG lead II were simultaneously recorded for 1–5 minutes during persistent and LSP AF. Data were digitally recorded, and processed with an Active Two system (BioSemi, Amsterdam, The Netherlands). All AEGs were sampled at 1,024 Hz and digitized at 24 bits. Data were transferred in real time, and stored on a laptop computer for further analysis (Cardiac Electrophysiology Analysis System [CEPAS], Madry Technologies, Sydney, Australia). We performed activation sequence mapping and phase analyses using previously recorded and analyzed data (22,23).
(a). Activation Sequence Analysis
Sequential activation maps of persistent and LSP AF were constructed using a custom designed algorithm that has been previously described in detail (23,25). The following was the method of selection of bipolar activation times used in our study. The moment of activation at each site was taken as 1) the peak of the rapid deflection in a predominantly monophasic AEG, 2) the time when the first rapid deflection crossed the baseline in a predominantly biphasic AEG, or 3) for sites in which polyphasic electrograms (AEGs with two or more deflections) were recorded, activation was assigned to the major deflection (highest amplitude or fastest downstroke). Activation from neighboring sites was also used to aid in determining the activation of complex electrograms recorded during high density mapping. All isochronal lines were determined by activation times from recorded bipolar AEGs. Once the activation sequence maps were constructed, the earliest sites of activation compared to their neighbors were identified, and the morphology of the unipolar AEGs was characterized at those sites. All bipolar AEGs were subjected to CL variation and dominant frequency (DF) analyses to detect mean CL, standard deviation, and DF (26).
(b). Phase Analysis
Phase mapping was performed using customized software (CEPAS, Madry Technologies, Sydney, Australia). The phase mapping for bipolar AEGs can be summarized in the following steps (Figures 1B and 1C): 1) modified AEGs were constructed using a previously described method (26). The peaks of the modified AEGs produced only smooth local maximum amplitudes that were related to each local activation regardless of polarity and morphology of the bipolar AEGs; 2) for the sinusoidal recomposition method (27,28), each modified AEG was transformed into a derivative waveform in order to produce a local maximum negative slope at each peak (local activation times) of modified AEGs; 3) the sinusoidal recomposition (typical phase algorithm for contact mapping) was performed. The amplitude of the sinusoidal waveform is proportional to the negative slope of the derivative waveform; 4) Hilbert transform was applied for phase mapping; 5) instantaneous phase was calculated for all bipolar AEGs at the sampling interval; 6) each bipolar site in the mapping grid was assigned to a 2×2 sub-grid of surrounding bipolar neighboring sites. Phase values from each bipolar site and four surrounding bipolar sites were used for the determination of rotor activation (Figure 1C). Phase values from four surrounding bipolar sub-grid sites were calculated in either a clockwise or counterclockwise direction. For accurately detecting true rotating activation, the four surrounding sub-grid phase values must achieve the following; 1) the duration of all four sites is greater than 180° (14); 2) the difference between phase value of two consecutive sites is less than 180°. Stable phase singularity, i.e., a stable rotor, was defined as a site with a wavefront that a) had two or more consecutive full rotations (> 4 π or 720°), and b) recurred at the same site.
We performed activation sequence mapping and phase analyses on 4 second segments of data per patient. For each detected stable phase singularity point, the corresponding activation pattern was examined in the activation sequence maps.
(c). Statistical analysis
Data are presented as the mean ± SD using Minitab (Minitab Inc., State College, PA, USA).
Results
Table 1 shows a summary of analysis data for all patients. During persistent and LSP AF, phase singularity points were identified in both atria in all 12 patients, but stable phase singularity points were present in only 6 of 12 patients. The range of stable phase singularity points per patient was 0 – 6 (total 14). Stable phase singularity points were present in the left atrial lateral free wall in 5 of 12 patients, between the pulmonary veins in 1 of 12 patients, and in the right atrium in 3 of 12 patients. Fourteen total stable phase singularity points were produced, 8/14 due to repetitive wannabe reentry generated from a focal source or by passive activation, and 4/14 due to conduction block. Stable phase singularity points with no true rotation were also produced due to AEGs having double potentials with an isoelectric line (2/14). When a focal source generates wannabe reentry, the average distance between a focal source and a stable phase singularity point was 0.9 ± 0.3 cm (range 0.56 – 1.12 cm).
Table 1.
Summary of analysis data during persistent AF
| Patient No. | # Phase singularity point | Stable Phase Singularity Point |
||||
|---|---|---|---|---|---|---|
| # | Location | Total duration (s) (max duration episode) | Distance from focal activation | Cause | ||
| 1 | 1 | 1 | PV | 1 sec (0.37 sec) | Wannabe reentry from passive wavefront | |
| 2 | 3 | 1 | LA | 1.08 sec (0.52 sec) | False Positive due to double potential | |
| 3 | 1 | 1 | LA | 0.76 sec (0.36 sec) | Wannabe reentry from passive wavefront | |
| 4 | 4 | – | ||||
| 5 | 3 | 2 | RA | 0.52 sec (0.31 sec) | 1.12 cm | Wannabe reentry from focal source |
| LBB | 0.44 sec (0.28 sec) | 0.58 cm | Wannabe reentry from breakthrough site | |||
| 6 | 1 | – | ||||
| 7 | 2 | – | ||||
| 8 | 4 | – | ||||
| 9 | 2 | – | ||||
| 10 | 5 | 3 | LA | 3.6 sec (2.36 sec) | 0.56 cm | Wannabe reentry from the same focal source |
| LA | 3.08 sec (2.41 sec) | CB between focal and passive wavefronts | ||||
| RBB | 0.64 sec (0.39 sec) | False Positive due to double potential | ||||
| 11 | 1 | – | ||||
| 12 | 7 | 6 | RA | 1.52 sec (0.64 sec) | 0.98 | Wannabe reentry from focal source |
| RA | 0.72 sec (0.5 sec) | 0.98 | Wannabe reentry from focal source | |||
| RA | 0.52 sec (0.29 sec) | CB between focal and passive wavefronts | ||||
| RA | 0.48 (0.29 sec) | CB between two passive wavefronts | ||||
| LBB | 1.2 sec (0.57 sec) | CB between two passive wavefronts | ||||
| LA | 2.44 sec (1.15 sec) | 1.12 | Wannabe reentry from focal source | |||
| mean | 2.8 ± 1.9 | 1.2 ± 1.8 | 0.9 ± 0.3 | |||
CB, conduction block; LA, left atrium: LBB, left Bachmann’s bundle; PV, pulmonary vein; RA, right atrium; RBB, right Bachmann’s bundle
Repetitive wannabe reentry generated from a focal source producing a stable rotor
Figure 2 is a representative example showing repetitive wannabe reentry generated from a focal source producing a stable phase singularity point. Panel A shows two consecutive beats of the phase map from the left atrium. A stable rotor activation in the left atrial free wall was identified. Panel B shows the activation sequence map of the rotor activation. Focal activation originating in the posterior left atrium produced a wavefront that propagated around the end of functional line of block, but did not complete the rotation because it collided with the line of block. The repetitive wannabe reentry generated from a focal source produced a stable phase singularity point. The distance between the focal site and stable phase singularity site was 1.12 cm. Panel C shows the bipolar electrograms with their phase from selected sites a through e, and the stable singularity point in panel A. Black dash arrows correspond to the phase map (panel A), demonstrating a stable phase singularity point. Red arrows correspond to the activation sequence map (panel B), demonstrating repetitive wannabe reentry generated from a focal source. The bottom trace shows AEGs at the stable phase singularity point demonstrating double potentials with an isoelectric line (no continuous electrical activities) or prolonged AEG duration (slow conduction), indicating a pivot point of wavefront propagation.
Figure 2.
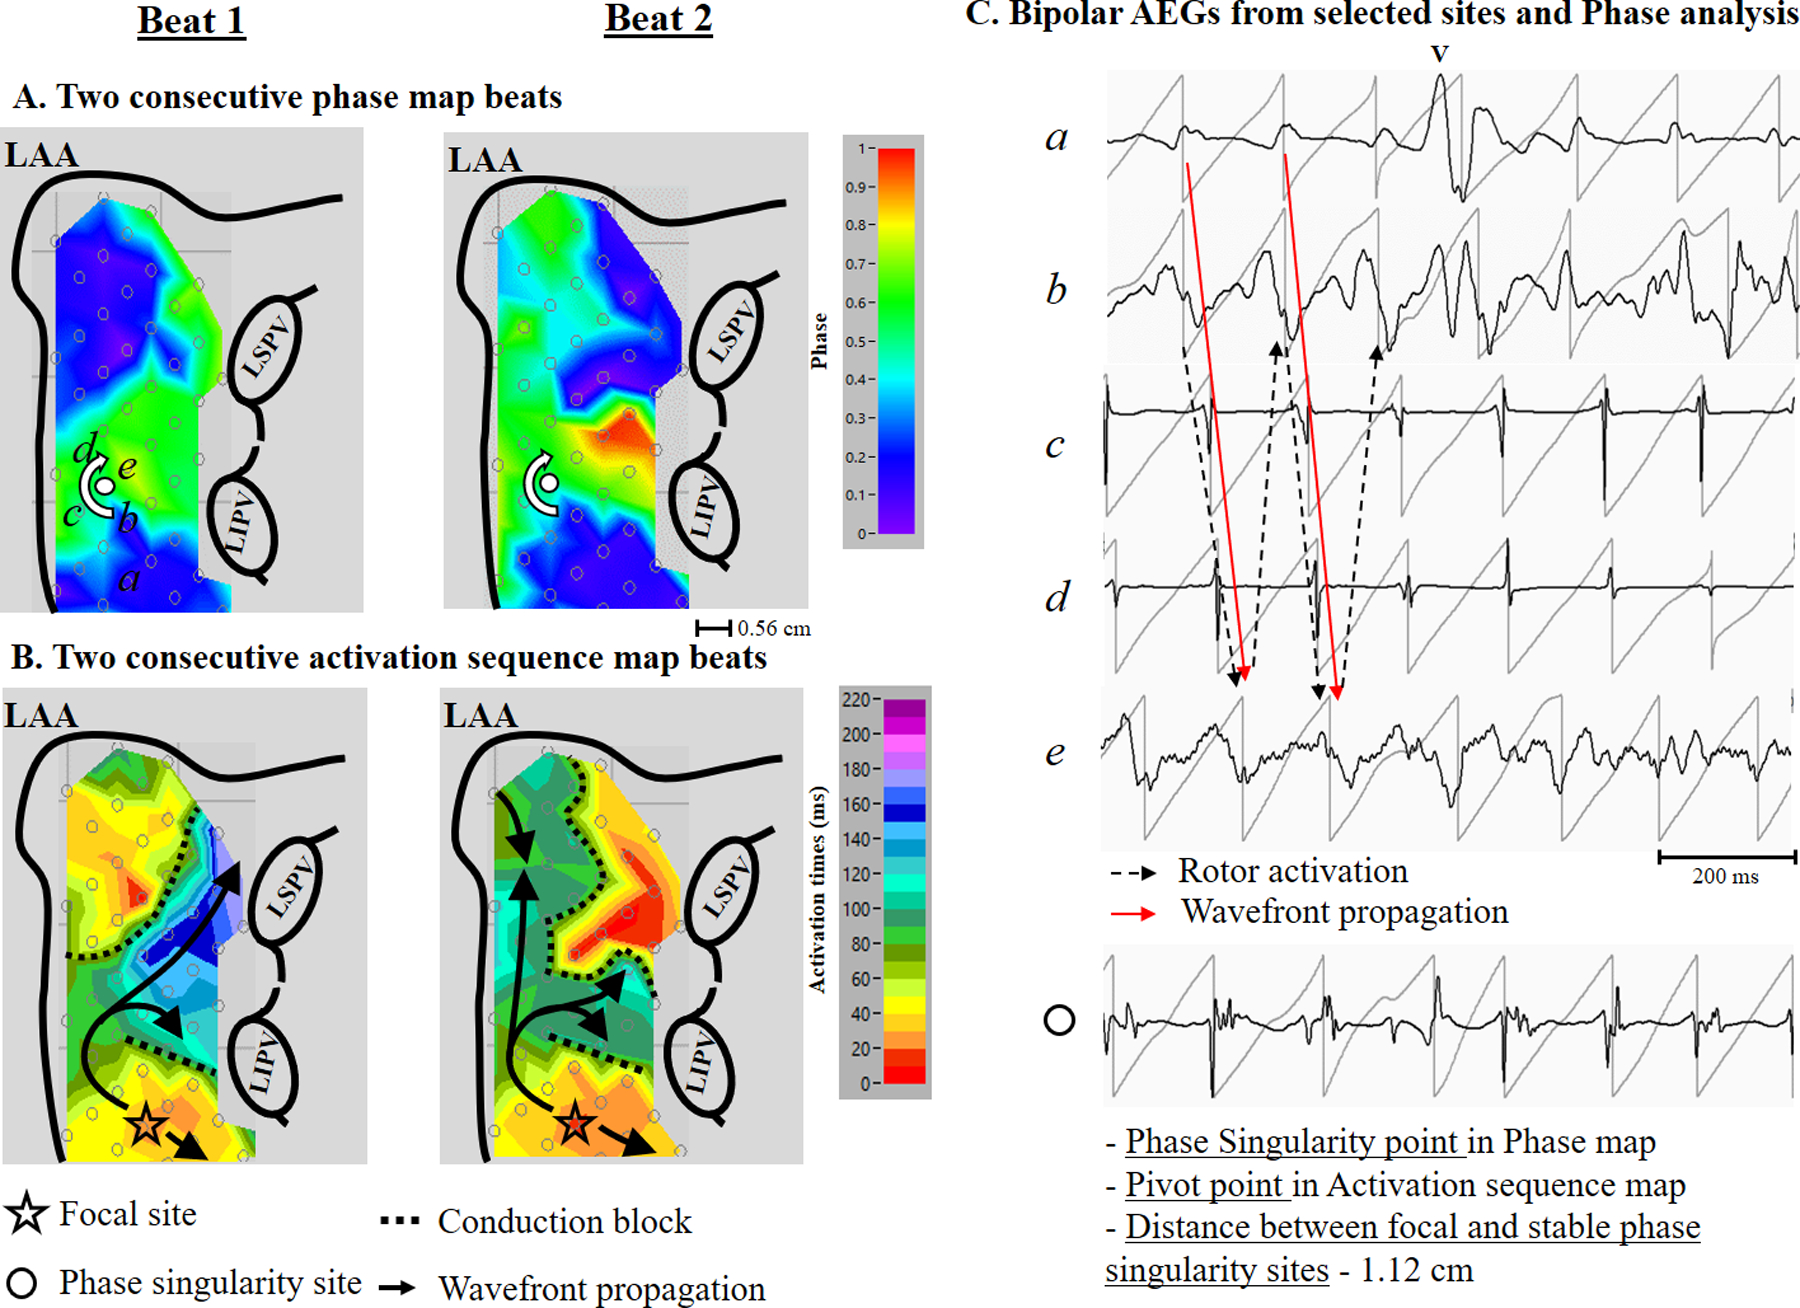
A representative example (patient #12) showing repetitive wannabe reentry generated from a focal source producing a stable phase singularity point. Panel A: Two consecutive beats of left atrial phase map during AF showing the location of recording sites (a through e) and a stable phase singularity point (white dot). Phase value color bar (0 [-π] to 1 [π]) is shown on the right. Panel B: Two consecutive beats of left atrial activation sequence map during AF. The 10 millisecond isochronal color bar is shown on the right. The black arrows indicate activation wavefronts. Panel C Top: Bipolar AEGs with their phase from selected sites (a – e). The red arrow indicates a wannabe reentry activation for the activation sequence map shown in panel B. The block dot arrow indicates a rotor activation for the phase map shown in panel A. Bottom: Bipolar AEGs at the stable phase singularity point. See text for discussion. LAA, left atrial appendage; LIPV, left inferior pulmonary vein; LSPV, left superior pulmonary vein
Repetitive wannabe reentry generated from a passive wavefront producing a stable rotor
Figure 3 is a representative example showing repetitive wannabe reentry generated from a passive wavefront producing a stable phase singularity point. Panel A shows two consecutive beats of the phase map on the left atrium. A stable rotor activation near the left superior pulmonary vein was identified. Panel B shows the activation sequence map of a rotor activation. A wavefront entering the edge of the recording array (red color, which is the earliest activation) produced a wavefront that propagated around the end of the functional line of block, but did not complete the rotation because it collided with the line of block. The repetitive wannabe reentry generated from a passive wavefront produced a stable phase singularity point. Right panel C shows bipolar AEGs with their phase from selected sites a through d, and the stable phase singularity point in panel A. Black dash arrows correspond to the phase map (panel A), demonstrating a stable phase singularity point. Red arrows correspond to the activation sequence map (panel B), demonstrating repetitive wannabe reentry generated from a passive wavefront entering from the edge of the recording array. The bottom trace shows AEGs at a stable phase singularity point demonstrating double potentials with an isoelectric line (no continuous electrical activities) or prolonged AEG duration (slow conduction), indicating a pivot point of wavefront propagation.
Figure 3:
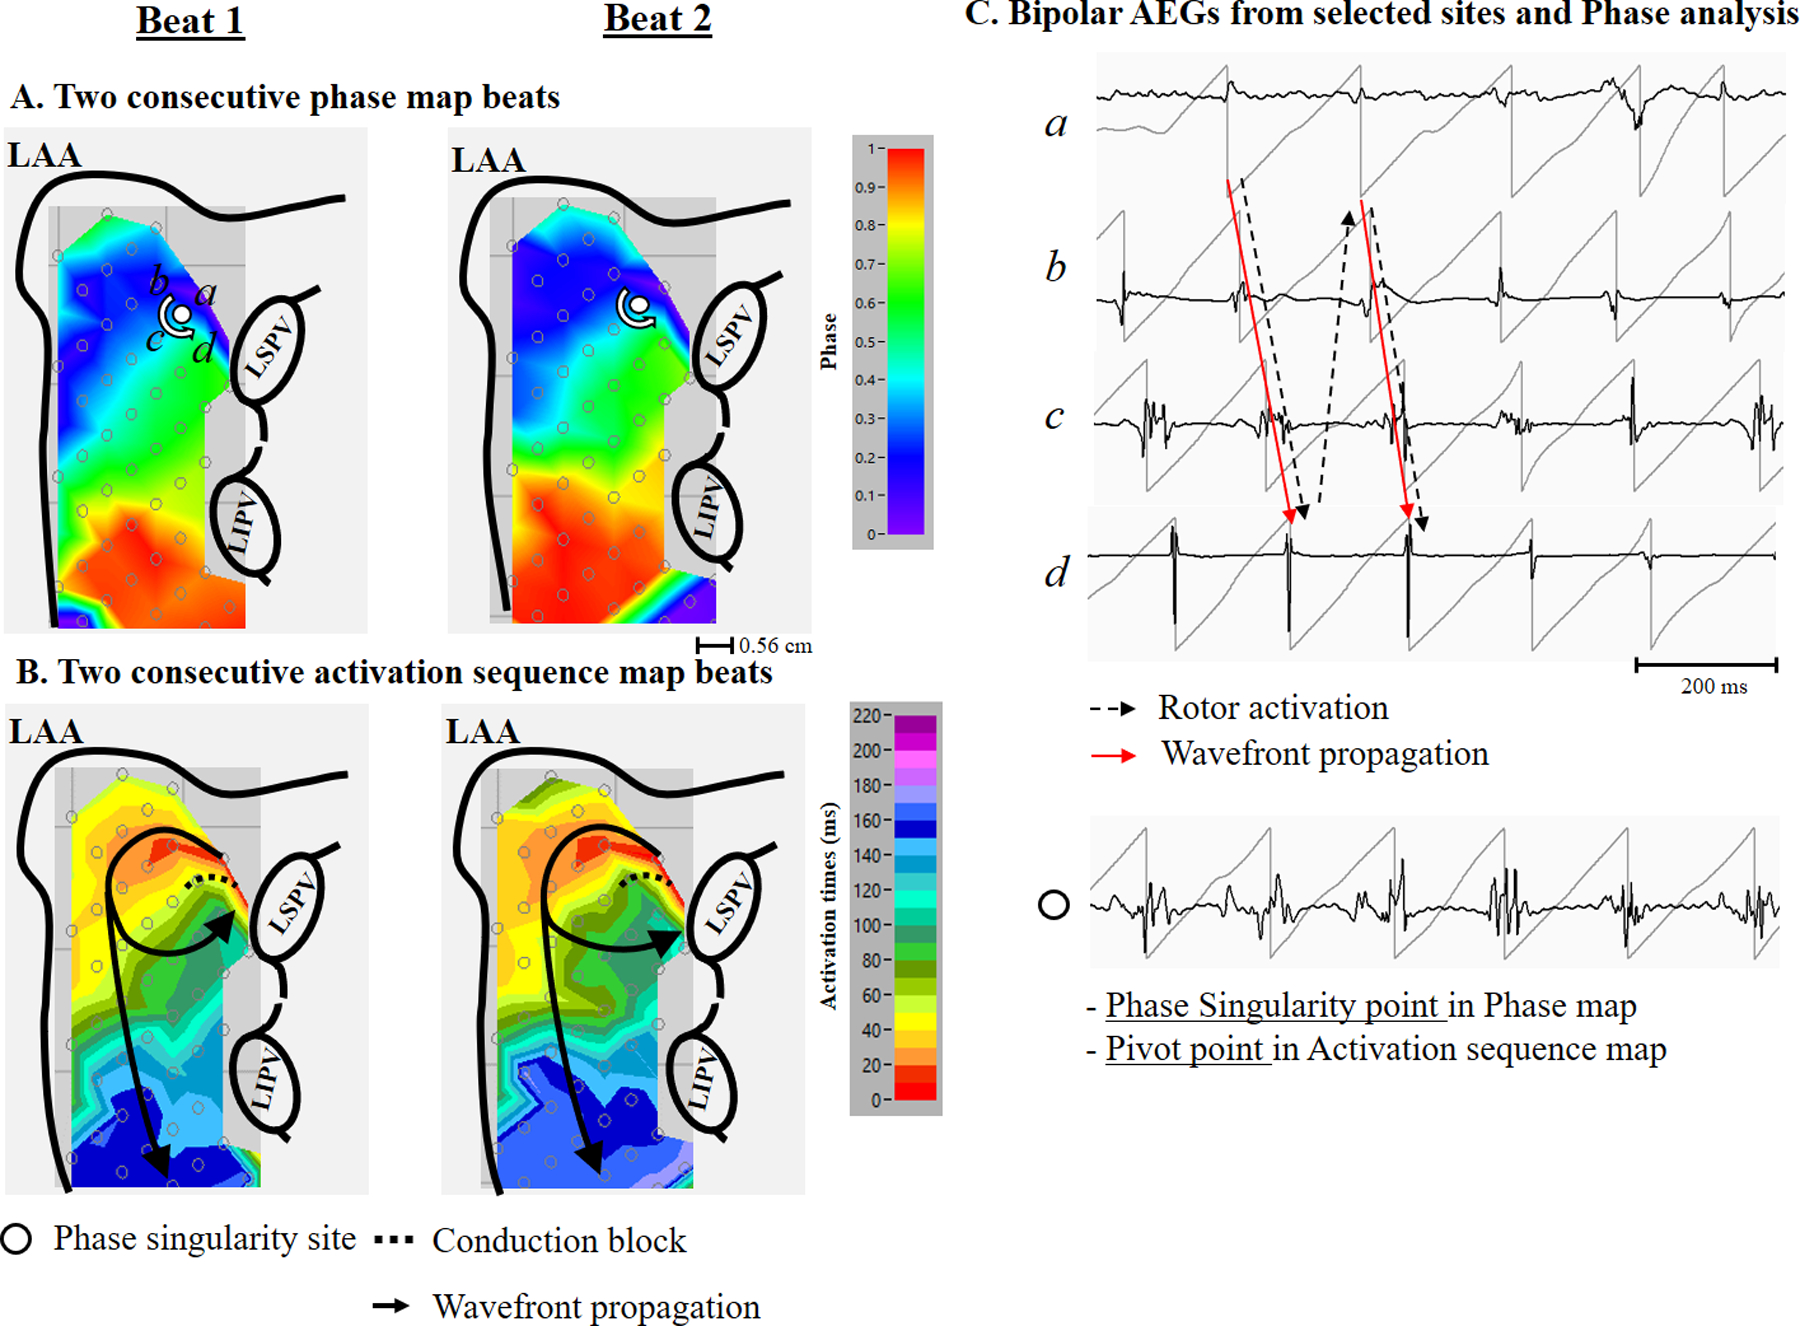
A representative example (patient #3) showing repetitive wannabe reentry generated from a passive wavefront entering from the edge of recording array producing a stable phase singularity point. Panel A: Two consecutive beats of a left atrial phase map during AF showing the location of recording sites (a through d), and a stable phase singularity point (white dot). Phase value color bar (0 [-π] to 1 [π]) is shown on the right. Panel B: Two consecutive beats from a left atrial activation sequence map during AF. The 10 millisecond isochronal color bar is shown on the right. The black arrows indicate activation wavefronts. Panel C Top: Bipolar AEGs with their phase from selected sites (a – d). The red arrow indicates a wannabe reentry activation for the activation sequence map shown in panel B. The black dot arrow indicates a rotor activation for the phase map shown in panel A. Bottom: Bipolar AEGs at the stable phase singularity point. See text for discussion. LAA, left atrial appendage; LIPV, left inferior pulmonary vein; LSPV, left superior pulmonary vein
Conduction block producing a stable rotor without a pivot point
Figure 4 is a representative example showing conduction block generated from a focal source producing two stable phase singularity points without a pivot point. Panel A shows two consecutive beats of the phase map on the left atrium, and anterior side of the left atrial appendage. Two stable rotor activations, one in the high left atrium near appendage, and one near the left superior pulmonary vein, were identified. Panel B shows the activation sequence map of two rotor activations. A focal source in the high left atrium near the appendage produced a wavefront that propagated around the left atrial appendage, and returning to the high left atrium, but it did not complete the rotation because it collided with the line of block. It also produced a wavefront that propagated toward the posterior left atrium, where a line of block formed with another wavefront traveling in an opposite direction that entered from the edge of the recording array. Neither activation produced a pivot point. However, the repetitive focal activation produced two stable phase singularity points in the areas of conduction block. The distance between the focal site and the stable phase singularity site that it produced was 0.56 cm. Panel C shows bipolar AEGs with their phase from selected sites a through g, and h through k in panel A. Black dash arrows correspond to the phase map (panel A), demonstrating two stable phase singularity points. Red arrows correspond to the activation sequence map (panel B), demonstrating the conduction block generated from the focal source. Figure 5 shows selected bipolar AEGs along with each unipolar component (QS morphology) from the focal source in figure 4 (site d). Also, the dominant frequency (DF) is shown on the right. The double potential AEGs with the isoelectric line demonstrates both a distinct unipolar QS electrogram morphology (☆ symbol) originating in the high left atrium, and a unipolar RS electrogram morphology (* symbol) generated from a wavefront propagation of the previous activation around the left atrial appendage. DF of selected bipolar AEGs demonstrates stable repetitive activation with constant double potential AEGs during 4 second duration.
Figure 4:

A representative example (patient #10) showing conduction block generated from a focal source producing two stable phase singularity points. Panel A: Two consecutive beats of left atrial phase map during AF showing the location of recording sites (a through k) and two stable phase singularity points (white dots). Phase value color bar (0 [−π] to 1 [π]) is shown on the right. Panel B: Two consecutive beats from a left atrial activation sequence map during AF. The 10 millisecond isochronal color bar is shown on the right. The black arrows indicate activation wavefronts. Panel C: Bipolar AEGs with their phase from selected sites (a - k). The red arrow indicates wavefront activations for the activation sequence map shown in panel B. The black dot arrow indicates a rotor activation for the phase map shown in panel A. See text for discussion. LAA, left atrial appendage; LIPV, left inferior pulmonary vein; LSPV, left superior pulmonary vein
Figure 5:
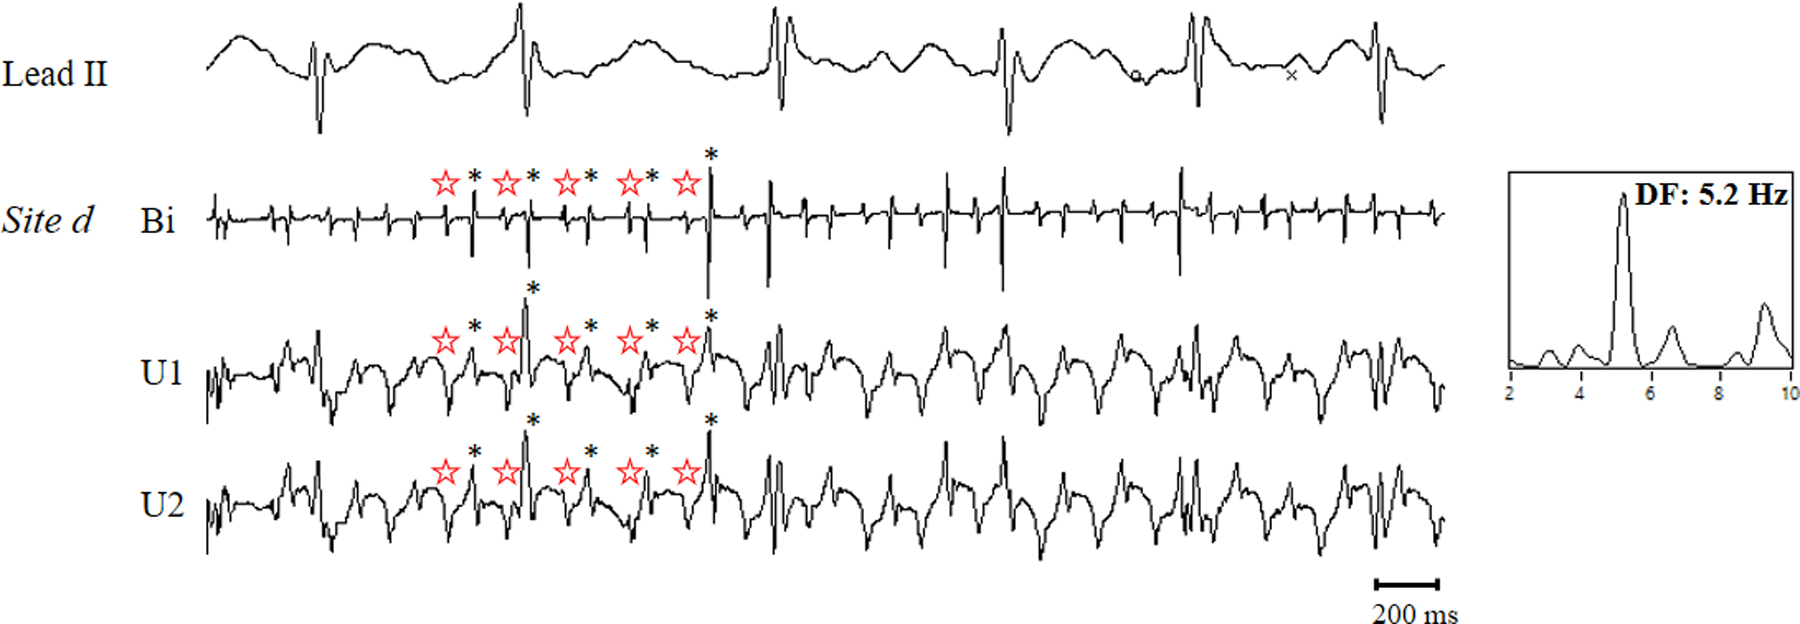
Selected bipolar AEGs along with each unipolar component (QS morphology and RS morphology) of the bipolar AEG from the focal source (site d). The power spectrum with dominant frequency is shown on the right. See text for discussion.
Discussion
Major Findings
Our data provide new insights into the mapping of persistent and LSP AF. We performed activation sequence and phase analyses using data from simultaneous, biatrial, high density contact mapping in patients with persistent and LSP AF during open heart surgery. For each detected stable phase singularity point (two or more consecutive full rotations that recur at the same site), the corresponding activation pattern was examined in the activation sequence maps. Our results demonstrated that 1) phase singularity points were identified in both atria in all patients, but stable phase singularity points were present only in 6 of 12 patients; 2) repetitive wannabe reentry generated by a focal source or a passive wavefront identified by activation sequence mapping produced a stable phase singularity point identified by phase mapping separate from the focal source, or a passive wavefront; 3) the location of the detected stable phase singularity point was in close proximity to the focal source; 4) Stable phase singularity points with no true rotation were also produced in areas of conduction block.
Classical Activation Sequence Analysis vs. Phase Analysis
In an attempt to understand the complex activation patterns during AF, there are two major and important analyses: 1) classical activation sequence analysis using multi-site electrode contact mapping in both animal AF models and in patients with AF; and 2) phase analysis using optical mapping (recording action potentials) using voltage-sensitive dyes in vitro experiments. In canine optical mapping studies using phase analysis, the rotor (spiral wave source) was described as a predominant mechanism that sustains AF (29). Recently, phase analysis has been applied to patients with persistent and LSP AF using contact or body surface potential mapping, which demonstrated stable rotors (1,2,5). On the other hand, high density epicardial contact mapping studies using activation sequence analysis during open heart surgery in patients with AF showed wavefronts emanating from focal and breakthrough sites, but failed to identify any stable rotors in any patients (23,30,31). Recent mapping studies using an endocardial, low-density basket catheter, an epicardial high-density mapping, or body surface potential mappings in patients with persistent and LSP AF demonstrated that phase analysis consistently produces a different mechanistic result than classical activation sequence analysis (15,20,21). Interestingly, the activation sequence analysis with body surface mapping demonstrated that reentry was seen rarely, and rarely sustained > 1 rotation (32). However, phase analysis using the same body surface mapping technology found unstable reentry (> 2 rotation) that were recurred repetitively at the same region (5). In comparison with our study, our finding of the detection of false-positive phase singularity points concurs with the findings of others (10,11,16,21). However, most previous studies only consider a singularity point from one cycle. We demonstrated that stable phase singularity points were produced from repetitive wannabe reentry at sites close to the focal sources.
Implications
Understanding AF mechanism(s) presents opportunities for new potential approaches to the treatment of persistent and LSP AF, especially for ablation. Recent studies demonstrated that poor spatial resolution, a limited mapping area, or phase analysis produce different mechanistic results (10–21). Our data demonstrated that repetitive focal activation could produce a repetitive wannabe reentry that generates a stable phase singularity points adjacent to a site of focal activation. Importantly, high density mapping using classical activation sequence analysis can distinguish between wannabe reentry and true reentry. However, high density mapping using phase analysis cannot distinguish between a wannabe reentry and a true rotor. Finally, our data help explain the inconsistent data from the many studies of rotor ablation of AF (33). When the phase singularity point is critically close to the focal source, ablation of the center of the “rotor” may ablate a focal source. Therefore, achieving acute termination of AF by ablating a phase singularity point (“rotor”) can be explained by inadvertent ablation of the nearby focal source. However, when the ablation of a phase singularity point (“rotor”) is critically distant from the focal source or is a false-positive phase singularity point (“rotor”), not surprisingly, it may result in failure of AF termination. The data from our study suggests the potential for improving current ablation approaches to treating persistent and LSP AF by targeting ablation of focal sources for improved clinical outcomes in these patients.
Study Limitation
Since AEGs from the endocardium, transmural myocardium, and the atrial septum were not obtained, we cannot rule out the possibility that focal activation was the result of reentry from such regions. Although we used a typical phase algorithm for contact mapping data, other algorithms could demonstrate different results. However, no epicardial reentry was found in our classic activation sequence maps. Also, because our mapping studies were only performed in patients with persistent and LSP AF, the findings cannot be assumed to apply to patients with paroxysmal AF. Additionally, our study patients all had valvular heart disease, and a few had significant coronary artery disease. Therefore, our data may only apply to this patient population.
Conclusions
Using high density AF mapping data in patients with persistent and LSP AF, repetitive wannabe reentry often generated a stable phase singularity point (rotor) in close proximity to a focal source. Therefore, our study supports the possibility that localized ablation that terminates persistent AF of apparent rotors may be an ablation of focal sources.
Supplementary Material
Central Illustration.
Perspectives.
Clinical competencies
The efficacy of the ablation of persistent and long-standing persistent atrial fibrillation (AF) has been suboptimal, mainly because of the complexity of atrial activation during AF, and the absence of clear targets. At present, it is unknown why the localized ablation at the site showing partial rotating wavefront, i.e., “rotor” identified by the phase mapping, terminated persistent AF.
Translational outlook
Repetitive focal activation produces a wannabe reentry (incomplete rotating wavefront) that generates a rotor adjacent to a site of focal activation. The data from our study support the possibility that localized ablation that terminates persistent AF at apparent rotor sites may be an ablation of focal sources. These findings offer the potential for improving current ablation approaches to treating persistent and long-standing persistent AF.
Funding Sources:
This work was supported in part by grants from R01 HL146463 from the National Institutes of Health, National Heart, Lung, and Blood Institute; and Elisabeth Severance Prentiss Foundation.
Abbreviations list
- AEG
atrial electrogram
- AF
atrial fibrillation
- CB
conduction block
- CL
cycle length
- DF
dominant frequency
- LAA
left atrial appendage
- BB
Bachmann’s bundle
- LSP
long-standing persistent
- PV
pulmonary vein
Footnotes
Disclosures: None
References
- 1.Narayan SM, Krummen DE, Clopton P, Shivkumar K, Miller JM. Direct or Coincidental Elimination of Stable Rotors or Focal Sources May Explain Successful Atrial Fibrillation AblationOn-Treatment Analysis of the CONFIRM Trial (Conventional Ablation for AF With or Without Focal Impulse and Rotor Modulation). Journal of the American College of Cardiology 2013;62:138–147. [DOI] [PMC free article] [PubMed] [Google Scholar]
- 2.Miller JM, Kalra V, Das MK et al. Clinical Benefit of Ablating Localized Sources for Human Atrial Fibrillation: The Indiana University FIRM Registry. Journal of the American College of Cardiology 2017;69:1247–1256. [DOI] [PubMed] [Google Scholar]
- 3.Lim HS, Hocini M, Dubois R et al. Complexity and Distribution of Drivers in Relation to Duration of Persistent Atrial Fibrillation. J Am Coll Cardiol 2017;69:1257–1269. [DOI] [PubMed] [Google Scholar]
- 4.Gizurarson S, Dalvi R, Das M, Ha ACT, Suszko A, Chauhan VS. Hierarchical Schema for Identifying Focal Electrical Sources During Human Atrial FibrillationImplications for Catheter-Based Atrial Substrate Ablation. JACC: Clinical Electrophysiology 2016;2:656–666. [DOI] [PubMed] [Google Scholar]
- 5.Haissaguerre M, Hocini M, Denis A et al. Driver Domains in Persistent Atrial Fibrillation. Circulation 2014;130:530–538. [DOI] [PubMed] [Google Scholar]
- 6.Honarbakhsh S, Schilling RJ, Providencia R et al. Automated detection of repetitive focal activations in persistent atrial fibrillation: Validation of a novel detection algorithm and application through panoramic and sequential mapping. Journal of Cardiovascular Electrophysiology 2019;30:58–66. [DOI] [PMC free article] [PubMed] [Google Scholar]
- 7.Verma A, Sarkozy A, Skanes A et al. Characterization and significance of localized sources identified by a novel automated algorithm during mapping of human persistent atrial fibrillation. Journal of Cardiovascular Electrophysiology 2018;29:1480–1488. [DOI] [PubMed] [Google Scholar]
- 8.Chauhan VS, Verma A, Nayyar S et al. Focal source and trigger mapping in atrial fibrillation: Randomized controlled trial evaluating a novel adjunctive ablation strategy. Heart Rhythm 2020;17:683–691. [DOI] [PubMed] [Google Scholar]
- 9.Choudry S, Mansour M, Sundaram S et al. RADAR. Circulation: Arrhythmia and Electrophysiology 2020;13:e007825. [DOI] [PMC free article] [PubMed] [Google Scholar]
- 10.Berenfeld O, Oral H. The quest for rotors in atrial fibrillation: different nets catch different fishes. Heart Rhythm 2012;9:1440–1. [DOI] [PMC free article] [PubMed] [Google Scholar]
- 11.Benharash P, Buch E, Frank P et al. Quantitative Analysis of Localized Sources Identified by Focal Impulse and Rotor Modulation Mapping in Atrial Fibrillation. Circulation: Arrhythmia and Electrophysiology 2015;8:554–561. [DOI] [PMC free article] [PubMed] [Google Scholar]
- 12.Buch E, Share M, Tung R et al. Long-term clinical outcomes of focal impulse and rotor modulation for treatment of atrial fibrillation: A multicenter experience. Heart Rhythm 2016;13:636–41. [DOI] [PMC free article] [PubMed] [Google Scholar]
- 13.Gianni C, Mohanty S, Di Biase L et al. Acute and early outcomes of focal impulse and rotor modulation (FIRM)-guided rotors-only ablation in patients with nonparoxysmal atrial fibrillation. Heart Rhythm 2016;13:830–835. [DOI] [PubMed] [Google Scholar]
- 14.Kuklik P, Zeemering S, Hunnik Av et al. Identification of Rotors during Human Atrial Fibrillation using Contact Mapping and Phase Singularity Detection: Technical Considerations. IEEE Transactions on Biomedical Engineering 2017;64:310–318. [DOI] [PubMed] [Google Scholar]
- 15.Vijayakumar R, Vasireddi SK, Cuculich PS, Faddis MN, Rudy Y. Methodology Considerations in Phase Mapping of Human Cardiac Arrhythmias. Circulation: Arrhythmia and Electrophysiology 2016;9:e004409. [DOI] [PMC free article] [PubMed] [Google Scholar]
- 16.Roney CH, Cantwell CD, Bayer JD et al. Spatial Resolution Requirements for Accurate Identification of Drivers of Atrial Fibrillation. Circulation: Arrhythmia and Electrophysiology 2017;10:e004899. [DOI] [PMC free article] [PubMed] [Google Scholar]
- 17.Kochhauser S, Verma A, Dalvi R et al. Spatial Relationships of Complex Fractionated Atrial Electrograms and Continuous Electrical Activity to Focal Electrical Sources: Implications for Substrate Ablation in Human Atrial Fibrillation. JACC Clin Electrophysiol 2017;3:1220–1228. [DOI] [PubMed] [Google Scholar]
- 18.King B, Porta-Sánchez A, Massé S et al. Effect of spatial resolution and filtering on mapping cardiac fibrillation. Heart Rhythm 2017;14:608–615. [DOI] [PubMed] [Google Scholar]
- 19.Walters TE, Lee G, Spence S, Kalman JM. The effect of electrode density on the interpretation of atrial activation patterns in epicardial mapping of human persistent atrial fibrillation. Heart Rhythm 2016;13:1215–1220. [DOI] [PubMed] [Google Scholar]
- 20.Zaman JAB, Sauer WH, Alhusseini MI et al. Identification and Characterization of Sites Where Persistent Atrial Fibrillation Is Terminated by Localized Ablation. Circulation: Arrhythmia and Electrophysiology 2018;11. [DOI] [PMC free article] [PubMed]
- 21.Podziemski P, Zeemering S, Kuklik P et al. Rotors Detected by Phase Analysis of Filtered, Epicardial Atrial Fibrillation Electrograms Colocalize With Regions of Conduction Block. Circ Arrhythm Electrophysiol 2018;11:e005858. [DOI] [PMC free article] [PubMed] [Google Scholar]
- 22.Lee S, Sahadevan J, Khrestian CM, Markowitz A, Waldo AL. Characterization of Foci and Breakthrough Sites During Persistent and Long-Standing Persistent Atrial Fibrillation in Patients: Studies Using High-Density (510–512 Electrodes) Biatrial Epicardial Mapping. Journal of the American Heart Association 2017;6. [DOI] [PMC free article] [PubMed]
- 23.Lee S, Sahadevan J, Khrestian CM, Cakulev I, Markowitz A, Waldo AL. Simultaneous Biatrial High-Density (510–512 Electrodes) Epicardial Mapping of Persistent and Long-Standing Persistent Atrial Fibrillation in Patients: New Insights Into the Mechanism of Its Maintenance. Circulation 2015;132:2108–17. [DOI] [PMC free article] [PubMed] [Google Scholar]
- 24.Luther V, Sikkel M, Bennett N et al. Visualizing Localized Reentry With Ultra–High Density Mapping in Iatrogenic Atrial Tachycardia. Circulation: Arrhythmia and Electrophysiology 2017;10:e004724. [DOI] [PubMed] [Google Scholar]
- 25.Lee S, Sahadevan J, Khrestian CM, Durand DM, Waldo AL. High Density Mapping of Atrial Fibrillation During Vagal Nerve Stimulation in the Canine Heart: Restudying the Moe Hypothesis. Journal of Cardiovascular Electrophysiology 2013;24:328–335. [DOI] [PubMed] [Google Scholar]
- 26.Lee S, Ryu K, Waldo AL, Khrestian CM, Durand DM, Sahadevan J. An Algorithm to Measure Beat-to-Beat Cycle Lengths for Assessment of Atrial Electrogram Rate and Regularity During Atrial Fibrillation. Journal of Cardiovascular Electrophysiology 2013;24:199–206. [DOI] [PubMed] [Google Scholar]
- 27.Kuklik P, Zeemering S, Maesen B et al. Reconstruction of instantaneous phase of unipolar atrial contact electrogram using a concept of sinusoidal recomposition and Hilbert transform. IEEE Trans Biomed Eng 2015;62:296–302. [DOI] [PubMed] [Google Scholar]
- 28.Pathik B, Kalman JM, Walters T et al. Transient Rotor Activity During Prolonged 3-Dimensional Phase Mapping in Human Persistent Atrial Fibrillation. JACC: Clinical Electrophysiology 2018;4:72–83. [DOI] [PubMed] [Google Scholar]
- 29.Jalife J, Berenfeld O, Mansour M. Mother rotors and fibrillatory conduction: a mechanism of atrial fibrillation. Cardiovascular Research 2002;54:204–216. [DOI] [PubMed] [Google Scholar]
- 30.Lee G, Kumar S, Teh A et al. Epicardial wave mapping in human long-lasting persistent atrial fibrillation: transient rotational circuits, complex wavefronts, and disorganized activity. Eur Heart J 2014;35:86–97. [DOI] [PubMed] [Google Scholar]
- 31.de Groot NM, Houben RP, Smeets JL et al. Electropathological substrate of longstanding persistent atrial fibrillation in patients with structural heart disease: epicardial breakthrough. Circulation 2010;122:1674–82. [DOI] [PubMed] [Google Scholar]
- 32.Cuculich PS, Wang Y, Lindsay BD et al. Noninvasive characterization of epicardial activation in humans with diverse atrial fibrillation patterns. Circulation 2010;122:1364–72. [DOI] [PMC free article] [PubMed] [Google Scholar]
- 33.Parameswaran R, Voskoboinik A, Gorelik A et al. Clinical impact of rotor ablation in atrial fibrillation: a systematic review. Europace 2018;20:1099–1106. [DOI] [PubMed] [Google Scholar]
Associated Data
This section collects any data citations, data availability statements, or supplementary materials included in this article.