

Abstract
Introduction
We aimed to develop a risk prediction model for incident dementia using predictors that are available in primary‐care settings.
Methods
A total of 795 subjects aged 65 years or over were prospectively followed‐up from 1988 to 2012. A Cox proportional‐hazards regression was used to develop a multivariable prediction model. The developed model was translated into a simplified scoring system based on the beta‐coefficient. The discrimination of the model was assessed by Harrell's C statistic, and the calibration was assessed by a calibration plot.
Results
During the follow‐up period, 364 subjects developed dementia. In the multivariable model, age, female sex, low education, leanness, hypertension, diabetes, history of stroke, current smoking, and sedentariness were selected as predictors. The developed model and simplified score showed good discrimination and calibration.
Discussion
The developed risk prediction model is feasible and practically useful in primary‐care settings to identify individuals at high risk for future dementia.
Keywords: dementia, general population, primary prevention, prospective study, risk prediction model
1. INTRODUCTION
Dementia is one of the major geriatric diseases worldwide, and creates a great burden for modern societies. Because there is no established preventive treatment for dementia, it is important to reduce the risk of dementia through lifestyle modification and improvement of risk factors. 1 Prediction of dementia risk based on its risk factors would improve individuals’ awareness of their individual risk of dementia and enhance lifestyle changes for dementia risk reduction. 2 A prediction tool for dementia would also help to inform practitioners and health‐care providers to stratify their patients for future risk of dementia. In addition, risk stratification using risk‐prediction tools in primary care enables individuals at high risk for dementia to increase their chance to receive further neurological investigations for diagnosis of cognitive impairment. Early diagnosis of cognitive impairment can consequently lead to early intervention, better management of symptoms, and delay of institutionalization. 3 It also fosters the implementation of coordinated care plans and mitigates patient safety and care costs, 3 which could reduce the burden of dementia for not only affected individuals, but also their families and acquaintances. Given the limited health‐care resources relative to the rapidly expanding size of the aging population, it is crucial to develop an accurate, easy‐to‐use prediction tool for predicting future dementia for use in primary care to reduce the burden of dementia in communities.
Several prediction models and tools for dementia have been developed to guide dementia prediction. 4 , 5 , 6 However, some of these models were developed by linking with external databases, such as databases of routinely collected clinical data 7 and long‐term care insurance needs, 8 , 9 to prospectively detect dementia cases. However, this approach could result in some patients with undiagnosed dementia being overlooked. Therefore, cohort studies that adjudicate dementia cases are crucial for developing a model to provide accurate estimates of the absolute risk of dementia. In addition, existing late‐life risk prediction tools for dementia have often included neuropsychological examinations and genetic markers as predictors, 4 which would lessen the feasibility of their application to the wide range of populations in primary care settings, and especially to individuals without cognitive symptoms.
The Hisayama Study, a community‐based prospective cohort study of Japanese adults, explores potential risk factors for cardiovascular disease and dementia with long‐term follow‐up and a comprehensive community surveillance system. 10 We aimed to develop a risk prediction model for dementia using the Hisayama Study data on predictors readily available in the primary care setting, and to evaluate its performance in a cohort of community‐residing older Japanese adults.
2. MATERIALS AND METHODS
2.1. Participants
The Hisayama Study is an ongoing cohort study established in 1961 in the town of Hisayama, a suburban community adjacent to Fukuoka City, a metropolitan area of Kyushu Island in southern Japan. 10 In the present study, we used data from a cohort for which the baseline examination was conducted in 1988. A detailed description of this survey was published previously. 11 In brief, a screening survey for cardiovascular and neurological diseases was performed in 1988. A total of 837 residents aged 65 and over underwent the screening examination (participation rate: 91.8% of residents ≥65 years). Among them, we excluded 34 subjects who had dementia at baseline, and 8 subjects for whom information on covariates was not available; the remaining 795 subjects (310 men, 485 women) made up our final sample.
This study was conducted with the approval of the Kyushu University Institutional Review Board for Clinical Research. Written informed consent was provided by the study participants.
Highlights
We developed a multivariable risk prediction model and a simplified scoring system for predicting the development of dementia.
The proposed multivariable model and the simplified score showed good predictive performances.
Based on information that is readily available in a primary care setting, our risk prediction tools could enhance early risk factor management and risk stratification.
Research in Context
Systematic Review: The authors reviewed the literature using electronic databases (e.g., PubMed). There have been several systematic reviews of risk prediction models/tools for dementia and recent publications describing the development of dementia risk‐prediction models for use in primary care. These relevant works are appropriately cited.
Interpretation: We developed a new, well‐calibrated prediction model for 10‐year dementia risk. The developed model may have practical utility because its predictors are readily available in primary care settings, which would allow patients to have a better understanding of their lifestyle‐related risk and would promote early identification of older adults at high risk of dementia. The prediction model was further translated into a simplified score, providing patients with a means of assessing their own risk and promoting widespread application of the model.
Future Directions: Additional studies for external validation of the developed model and the simplified score in different populations are warranted.
2.2. Follow‐up survey
The subjects were followed‐up prospectively from December 1988 to November 2012. The detailed procedures for screening dementia cases in this study have been described elsewhere. 12 New‐onset cases of dementia, stroke, and cognitive impairment were ascertained based on an organized, continual monitoring network system that consisted of our study team, local physicians, and the members of the town's Health Office. The study‐team physicians collected information on the onset of stroke and dementia, including suspected cases, via regular visits to clinics and hospitals in and around the town. Information on potential new‐onset cases was also provided by the corresponding municipal department as it became available. We also obtained information from annual health examinations. In addition, we conducted neuropsychological screening surveys in 1985, 1992, 1998, 2005, and 2012 to identify incident dementia cases. For subjects who did not participate in health examinations in the town or who had moved out of the town, health status was collected by telephone or postal survey. Aside from the decedents (n = 676), no subjects were lost to follow‐up.
2.3. Diagnosis of dementia
When a study subject was suspected to have experienced new neurological symptoms, the study team, including the psychiatrists and stroke physicians, evaluated the individual through comprehensive investigations, including physical and neurological examinations, a review of the clinical records, and interviews of the family or attending physician. In addition, we collected and reviewed all available clinical information, and interviewed the family members and the attending physician when the subject died. Dementia cases were diagnosed according to the Diagnostic and Statistical Manual of Mental Disorders, Revised Third Edition. 13 Expert stroke physicians and psychiatrists in our study team adjudicated the diagnosis for dementia cases based on all available clinical information as well as neuroimaging data.
2.4. Measurements of potential predictors
Data on educational attainment, smoking habits, alcohol intake, daily physical activity levels, regular exercise, past history of cancer, and medication use were collected using a self‐administered questionnaire and were checked by trained interviewers. Systolic and diastolic blood pressures were measured by a mercury sphygmomanometer three times in a sitting position after 5 minutes of rest, and the average of the three measurements was calculated. Hypertension was defined as systolic blood pressure of ≥140 mmHg, diastolic blood pressure of ≥90 mmHg, and/or use of antihypertensive medication. Diabetes was defined as fasting plasma glucose concentration ≥126 mg/dL (7.0 mmol/L), 2‐hour post‐load plasma glucose concentration ≥200 mg/dL (11.1 mmol/L), and/or taking anti‐diabetic medication. Hypercholesterolemia was defined as serum total cholesterol of ≥220 mg/dL. Body mass index (BMI) was calculated using height and weight, which were measured with the participant in light clothes without shoes. Because we did not observe significant increase or decrease in the risk of dementia in subjects with obesity (≥25.0 kg/m2) compared to those with normal weight (BMI of 18.5 kg/m2 to <25.0 kg/m2; data not shown), we categorized participants as lean (BMI <18.5 kg/m2) or not (≥18.5 kg/m2). Electrocardiogram abnormalities were defined as left ventricular hypertrophy (Minnesota Code, 3‐1), ST depression (4‐1, 2, 3), and/or atrial fibrillation (8‐3). History of stroke at baseline was defined as any preexisting event of symptomatic stroke including ischemic stroke, intracerebral hemorrhage, and subarachnoid hemorrhage ascertained by all available clinical information and medical records. A regular exercise habit was defined as engaging in sports or other forms of exercise at least once per week during leisure time. Daily physical activity levels were reported for common occupational/domestic activities as follows: mostly sitting or lying down around all day; mixed sitting, standing and walking; walking; and heavy labor. Responses were classified as sedentary (i.e., mostly sitting or lying down) or not.
2.5. Statistical analysis
The risk prediction model was constructed using a Cox proportional hazard model with a backward variable selection, in which the criterion for variable elimination was set as P < .10. For the backward variable selection, the following variables were included in the first model: age groups (65–69, 70–74, 75–79, 80–84, and ≥85 years), sex (women vs. men), educational level (≤9 vs. >9 years), hypertension (yes vs. no), diabetes (yes vs. no), hypercholesterolemia (yes vs. no), BMI level (<18.5 vs. ≥18.5 kg/m2), electrocardiogram abnormalities (yes vs. no), history of stroke (yes vs. no), history of cancer (yes vs. no), smoking habits (current vs. past‐/non‐smoker), drinking habits (current vs. past‐/non‐drinker), regular exercise habit (no vs. yes), and sedentariness (yes vs. no). To elucidate the possible reverse causality in the associations of risk factors with dementia, we performed a sensitivity analysis using a Cox regression analysis including variables that were selected by the backward selection after excluding those who developed dementia in the first 5 years.
2.6. The probability for incidence of dementia at t year was calculated as follows
where S0(t) is the average event‐free survival at time t (i.e., at 10 years) estimated using a Cox regression model that included the selected variables through the aforementioned backward elimination. The value of ∑β i x i was calculated as the sum of the product of regression coefficients and the individual values, and ∑β i x̄ i as the sum of the product of regression coefficients the mean values of each predictor, respectively.
The developed model was translated into a simplified risk score according to the instructions of Sullivan et al. 14 The points for each category (j) of each predictor (i) were determined as follows:
where β i is the β estimate for the predictor i in the risk prediction model described above. W ij and W iREF are the assigned values of each category and the reference category, respectively. Therefore, W ij –W iREF is the distance of each category of each predictor from its reference category in their original units. The constant was set as 0.302, which was the β estimate for education of ≤9 years (i.e., the lowest value across the values of β i ).
The agreement between the 10‐year probability of dementia predicted by the multivariable model and that predicted by the simplified score was assessed using Spearman's rank correlation and a bivariate linear regression of the model‐predicted probability on the score‐predicted probability.
The discrimination for the multivariable model and the simplified score was assessed by Harrell's C index. For internal validation, the optimism of the developed model was estimated using the 200 bootstrap samples, and the optimism‐corrected C index was calculated according to the procedure proposed by Harrell et al. 15 Calibration was assessed graphically by plotting the average predicted 10‐year probabilities (based on the risk model and the score) against the observed 10‐year probabilities (Kaplan–Meier estimates) according to the decile of predicted probabilities. The Greenwood—Nam–D'Agostino χ2 statistic was also calculated to quantitatively assess calibration. 16 The Greenwood—Nam–D'Agostino χ2 statistic was calculated by seven groups according to the multivariable model and the simplified score by collapsing adjacent deciles with small numbers of dementia cases in lower categories. 16
All analyses were performed using SAS version 9.4 and Stata version 16. A two‐tailed P value of < .05 was defined as statistically significant for all analyses except for the backward elimination.
3. RESULTS
The baseline characteristics of the study sample are shown in Table 1. The mean age was 74.1 (standard deviation 6.1) years in the whole population, and 61% of participants were female.
TABLE 1.
Baseline characteristics of study participants
| Variables | Mean (standard deviation) or frequency |
|---|---|
| Age, years | 74.1 (6.1) |
| 65–69 years, % | 28.1 |
| 70–74 years, % | 29.1 |
| 75–79 years, % | 22.9 |
| 80–84 years, % | 13.6 |
| ≥85 years, % | 6.4 |
| Women, % | 60.9 |
| Education ≤9 years, % | 73.4 |
| Systolic blood pressure, mmHg | 144.1 (24.6) |
| Diastolic blood pressure, mmHg | 75.6 (11.2) |
| Use of antihypertensive agents, % | 28.6 |
| Hypertension, % | 61.9 |
| Diabetes, % | 13.6 |
| Use of glucose‐lowering agents, % | 4.9 |
| Serum total cholesterol, mg/dL | 207.1 (44.0) |
| Hypercholesterolemia, % | 35.2 |
| Body mass index, kg/m2 | 21.9 (3.2) |
| Body mass index <18.5 kg/m2, % | 14.0 |
| Electrocardiograph abnormalities, % | 23.2 |
| History of stroke, % | 6.3 |
| History of cancer, % | 4.4 |
| Current smoking, % | 19.8 |
| Current drinking, % | 21.9 |
| Regular exercise at least once per week, % | 33.0 |
| Sedentariness, % | 7.3 |
During the 24‐year follow‐up, 364 subjects developed dementia. The univariate association of potential predictors with the risk of dementia is shown in Table S1 in supporting information. In the multivariable analysis with backward variable selection, age, female sex, formal education ≤9 years, BMI <18.5 kg/m2, hypertension, diabetes, history of stroke, current smoking, and sedentariness were selected as significant predictors for incident dementia. The regression coefficient (β), its standard error, the hazard ratio and its 95% confidence intervals (95% CIs) of each selected predictor are shown in Table 2. These variables were identical to the variables selected in ≥40% (80/200) of the bootstrap samples (Figure S1 in supporting information). In the sensitivity analysis after excluding 64 subjects with dementia onset within the first 5 years, who were likely to be older and in poorer health, the association of the predictors, except for BMI <18.5 kg/m2 and history of stroke, with dementia was unchanged (Tables S2 and S3 in supporting information).
TABLE 2.
Multivariable model for predicting dementia in older adults aged 65 and over
| Variables | (reference) | β coefficient | SE | Hazard ratio (95% CI) | P value |
|---|---|---|---|---|---|
| Age groups | |||||
| 70–74 years | (vs 65‐69 years) | 0.552 | 0.14 | 1.74 (1.32–2.29) | <.001 |
| 75–79 years | 0.783 | 0.16 | 2.19 (1.60–2.99) | <.001 | |
| 80–84 years | 1.372 | 0.20 | 3.97 (2.68–5.88) | <.001 | |
| ≥85 years | 2.165 | 0.24 | 8.72 (5.44–13.99) | <.001 | |
| Women | (vs. men) | 0.325 | 0.13 | 1.39 (1.08–1.78) | .01 |
| Education ≤9 years | (vs. >9 years) | 0.302 | 0.13 | 1.35 (1.08–1.78) | .02 |
| Hypertension | (vs. no) | 0.316 | 0.12 | 1.37 (1.10‐1.72) | .01 |
| Diabetes | (vs. no) | 0.461 | 0.15 | 1.58 (1.18–2.13) | .002 |
| Body mass index <18.5 kg/m2 | (vs. ≥18.5 kg/m2) | 0.341 | 0.16 | 1.40 (1.02–1.94) | .04 |
| History of stroke | (vs. no) | 0.518 | 0.22 | 1.68 (1.10–2.56) | .02 |
| Current smoking | (vs. past‐/non‐smoker) | 0.378 | 0.16 | 1.46 (1.07–1.98) | .02 |
| Sedentariness | (vs. no) | 0.612 | 0.21 | 1.84 (1.21–2.79) | .004 |
| Index of the predictive ability for the multivariable model | |||||
| Harrell's C index | 0.718 (0.686–0.750) | ||||
| Optimism‐corrected C index | 0.703 |
Abbreviations: CI, confidence interval; SE, standard error.
Notes: Only the variables selected by backward elimination (P < .10) are presented.
The average survival rate was 0.8254 at 10‐year periods in the study population.
The optimism‐corrected C index was calculated based on 200 bootstrap samples.
The baseline survival function (i.e., 10‐year probabilities) for incident dementia in this cohort was calculated as S0(10) = 0.8254. Finally, we developed the following risk prediction model for incident dementia:
where ∑βixi = (0.552 if age of 70–74 years) + (0.783 if age of 75–79 years) + (1.372 if age of 80–84 years) + (2.165 if age of 85 years and over) + (0.325 if women) + (0.302 if formal education of ≤9 years) + (0.316 if hypertension) + (0.461 if diabetes) + (0.341 if BMI < 18.5 kg/m2) + (0.518 if having history of stroke) + (0.378 if current smoker) + (0.612 if sedentary [mostly sitting or lying down during the day]).
The final multivariable prediction model was translated into a simplified risk score. The total score ranged from 0 to 16. Based on the simplified risk score, the 10‐year risk for dementia can be calculated as follows:
The calculation of the simplified score and the corresponding predicted 10‐year probability of the development of dementia are presented in Figure 1. The predicted 10‐year probabilities of dementia by the multivariable model and by the simplified score were highly linearly correlated (Spearman's correlation coefficient r = 0.993; intercept = −0.004; and regression coefficient β = 0.977 [95% CI 0.969 to 0.985] in a bivariate linear regression model that regressed the model‐predicted probability on the score‐predicted probability). The Harrell's C statistic for the multivariable model was 0.718 (95% CI 0.686 to 0.750) in the original cohort, and the optimism‐corrected C statistic calculated by 200 bootstrap samples was 0.703. Compared to the model that only included age category as a predictor, the multivariable prediction model showed a significant improvement in model fitness, based on the likelihood ratio test (P < .01). The simplified risk score also showed good discrimination ability with Harrell's C statistic of 0.755 (95% CI 0.724 to 0.786).
FIGURE 1.
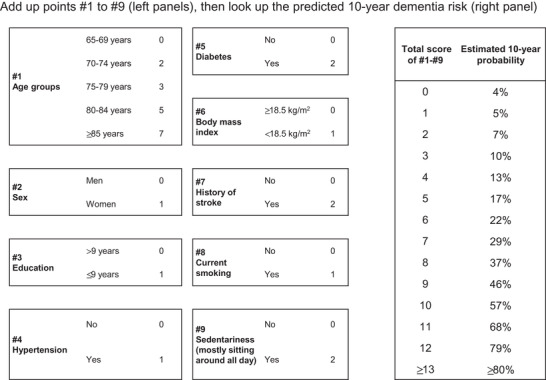
Simplified point‐based scoring system for dementia. The predicted 10‐year probability was determined using the following formula: p̂ = 1–0.8254exp(total score × 0.302–1.543)
Calibration plots demonstrated that the model‐predicted 10‐year probability and the observed 10‐year probability were highly linearly correlated (Figure 2A), and the Greenwood–Nam–D'Agostino tests indicated a good calibration of the model (P = .19). The predicted 10‐year probability according to the simplified score also showed a highly linear correlation with the observed 10‐year probability (Figure 2B), with a P value of .07 for the Greenwood—Nam–D'Agostino χ2 test.
FIGURE 2.
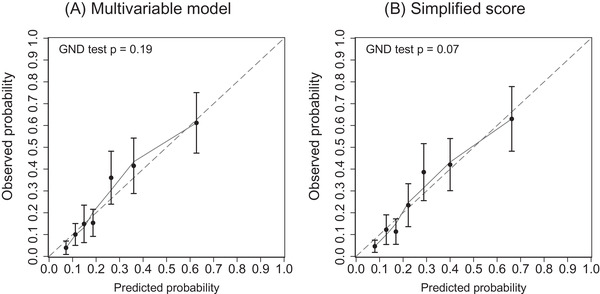
Calibration plots for predicting dementia in the Hisayama cohort. The predicted risk (horizontal axis) was estimated from (A) the prediction and (B) the simplified risk score. The solid curve is the Loess‐estimated calibration curve. GND test, Greenwood—Nam–D'Agostino χ2 test
The clinical examples with different risk profiles are presented in Table S4 in supporting information. In this example, a man (A) has some risk‐elevating factors including shorter educational attainment, hypertension, low BMI, and smoking habit. Another man (B) has a similar profile except for the absence of hypertension, and the other man (C) also has no smoking habit. The predicted 10‐year probabilities of dementia for A, B, and C can be calculated as 29%, 22%, and 16%, respectively. Calculated with the simplified score, the probabilities were reproduced very closely.
4. DISCUSSION
Using the data collected in a general Japanese elderly population over a long‐term follow‐up with extremely high participation and follow‐up rates, we developed a multivariable risk prediction model and a simplified scoring system for predicting the development of dementia. The proposed multivariable model and the simplified score showed good discrimination, an adequate calibration, and satisfactory internal validity. These findings support the practical utility of our risk prediction tools for dementia in a community. These tools were based on information readily available in a primary care setting, which could enhance individuals’ motivation to engage in risk factor management to delay the onset of dementia and promote risk stratification by primary care practitioners for the introduction of specialized examination and care.
The prediction model developed in the present study included well‐known, explainable risk factors for dementia, such as advanced age, low education, smoking habits, and the presence of chronic diseases (hypertension, diabetes, and stroke). 17 The selected predictors were generally consistent with those in existing dementia prediction models developed in Western countries. 18 , 19 , 20 , 21 , 22 Because sociocultural background and lifestyles play a role in modifying risk for dementia, this study is novel in that its weights were determined in a cohort of Japanese, who have unique cultural backgrounds, living environments, and a long life expectancy. Meanwhile, there were some notable differences in predictors between the existing models and ours. For example, several existing models consider obesity as a risk factor. 18 In contrast, our multivariable model as well as some other models included leanness as a risk factor. 20 , 21 A recent meta‐analysis of 23 cohort studies revealed that subjects with a BMI < 18.5 kg/m2 had a greater risk of dementia than those with a BMI 18.5 to 22.4 kg/m2. 23 Moreover, hypercholesterolemia was used as a predictor in some prior models 18 , 20 but was not used in our current prediction model. These discrepancies may have been due to the different age ranges of participants among studies: BMI and serum cholesterol levels were reported to be risk factors for the onset of dementia in middle‐aged subjects with a long follow‐up period but not in cohorts of older adults. 4 A history of cancer was included in the risk model from the Framingham Heart Study, 21 but not in our prediction model. Although there is currently a lack of consensus, some observational studies reported no or inverse associations of history of cancer and dementia. 24 , 25 Taken together, there is no strong justification for considering history of cancer as a predictor of dementia.
The predictors that were included in the proposed model were mostly based on directly or indirectly modifiable factors, 17 which may provide a rationale for risk factor–based intervention. Incorporating modifiable, lifestyle‐related factors as predictors in a risk prediction model may facilitate patients’ awareness of their accumulated risk and its relationship with their lifestyle choices, which is potentially useful preparation for a lifestyle modification consultation with goal setting. 26 In addition, our risk prediction model was designed to include predictors that are commonly measured at community or primary care facilities. A qualitative analysis pointed out that some older individuals find dementia screening to be strenuous, and that healthier individuals were less willing to be routinely screened for memory problems, 27 suggesting that community screening using neuropsychological examinations could overlook potential dementia cases. In contrast, our risk prediction model could be incorporated into routine health checkups, because health insurers in Japan (municipalities or corporate health insurance societies) mandatorily provide annual health checkups for all residents aged 40 to 74 under the universal health insurance coverage system. Further studies are warranted to investigate the cost‐effectiveness and clinical usefulness of dementia screening with our prediction model in community settings.
Importantly, the association of risk factors in the developed predictive model was not confirmed by intervention studies. Leanness and stroke were no longer statistically significant in the sensitivity analysis after excluding early onset cases. This suggests that, rather than interpreting as causal, it would be more appropriate to interpret them as suggesting that they may be markers for identifying vulnerable individuals. On the other hand, a certain causal effect between the remaining factors and dementia onset was suggested. Also, the risk estimates themselves should be interpreted with caution. We gave three examples with slightly different risk factor profiles to illustrate the use of the prediction model and the simplified scores. However, the change in predicted dementia risk obtained by changing the risk factors in the prediction model may be different from the amount of change expected when the behavior actually changed. Further intervention studies are required to examine the degree of risk reduction that can be achieved by changing risk factors.
The strengths of this study include the rigorous surveillance and detailed examinations for determining the endpoints during the follow‐up, which should have greatly improved the accuracy of diagnosis of dementia. The estimates of absolute risk were also considered to be highly accurate. In general, follow‐up studies of dementia are generally prone to biases such as the use of electronic health records and that due to drop‐out, and thus the onset of dementia tends to be overlooked, but this is unlikely to be the case in the present study. In addition, the continued long‐term follow‐up may allow us to identify potential influential risk factors for dementia as predictors. Indeed, we found that most of the selected predictors were not likely to be affected by reverse causality. Several limitations should also be noted. First, we did not externally validate the proposed model, because no data were available. Further validation in different populations is warranted. Second, we did not examine some potential predictors that are known to be risk factors, such as hearing loss, head trauma, depression, and low social contact, because information on these factors was not available at baseline. Third, some participants may have been prescribed medications or may have undergone therapeutic treatments for the risk factors during the follow‐up period, which could have reduced the predictive ability of the developed models.
In conclusion, we developed a risk prediction model and a simplified score for dementia for use in a primary health‐care setting. The developed prediction tools may help individuals to achieve a better understanding of their accumulated risk and its connection to their lifestyle, and enhance early identification of older adults who are at high risk of dementia in a community.
CONFLICTS OF INTEREST
Dr. Takanori Honda reports no conflicts of interest. Dr. Tomoyuki Ohara reports no conflicts of interest. Dr. Daigo Yoshida reports no conflicts of interest. Dr. Mao Shibata reports no conflicts of interest. Ms. Yuki Ishida reports no conflicts of interest. Dr. Yoshihiko Furuta reports no conflicts of interest. Dr. Emi Oishi reports no conflicts of interest. Dr. Yoichiro Hirakawa reports no conflicts of interest. Dr. Satoko Sakata reports no conflicts of interest. Dr. Jun Hata reports no conflicts of interest. Dr. Tomohiro Nakano reports having received honoraria from Mochida Pharmaceutical Co., Ltd.; Eisai Co.; Takeda Pharmaceutical Co., Ltd.; Dainippon‐Sumitomo Pharma Co. Ltd.; Otsuka Pharmaceutical Co., Ltd.; Janssen Pharmaceutical K. K.; Meiji Seika Pharma Co. Ltd.; Yoshitomiyakuhin Co.; and Shionogi & Co., Ltd. Dr. Toshiharu Ninomiya reports that DeSC Co., Ltd. sponsored the present study as a collaborative research project with Kyushu University. Dr. Tomohiro Nakano reports that his institution received research funding from MSD K. K.; Dainippon‐Sumitomo Pharma Co. Ltd.; Janssen Pharmaceutical K. K.; Pfizer Inc.; Mochida Pharmaceutical Co. Ltd.; Eisai Co.; Mitsubishi Tanabe Pharma Co.; Meiji Seika Pharma Co., Ltd.; Yoshitomiyakuhin Co.; Shionogi & Co., Ltd.
AUTHOR CONTRIBUTIONS
Takanori Honda contributed to the study design, statistical analyses, interpretation, and drafting of the manuscript; Tomoyuki Ohara, Daigo Yoshida, Mao Shibata, Yuki Ishida, Yoshihiko Furuta, Oishi Emi, Yoichiro Hirakawa, Satoko Sakata, and Jun Hata contributed to the data collection, interpretation, and revision; Tomohiro Nakano contributed to critical revision; Toshiharu Ninomiya contributed to the study design, statistical analysis, interpretation, and critical revision. All authors have read the final version of the manuscript and approved its submission for publication.
Supporting information
Supporting material
Supporting material
ACKNOWLEDGMENTS
The authors thank the residents of the town of Hisayama for their participation in the survey and the staff of the Division of Health of Hisayama for their cooperation with this study. The statistical analyses were carried out using the computer resources offered under the category of General Projects by the Research Institute for Information Technology, Kyushu University. We would like to thank KN International for English proofreading. This study was supported in part by Grants‐in‐Aid for Scientific Research A (JP16H02692), B (JP17H04126, JP18H02737, JP19H03863), and C (JP18K07565, JP18K09412, JP19K07890, JP20K10503, JP20K11020), and by Grants‐in‐Aid for Early‐Career Scientists (JP18K17925) and Research Activity Start‐up (JP19K23971) from the Ministry of Education, Culture, Sports, Science and Technology of Japan; by Health and Labor Sciences Research Grants of the Ministry of Health, Labor and Welfare of Japan (20FA1002); and by the Japan Agency for Medical Research and Development (JP20dk0207025, JP20km0405202, JP20fk0108075). In addition, this study was sponsored by DeSC Co., Ltd. (Tokyo). The funders had no role in the design and conduct of the study; the collection, analysis, and interpretation of the data; the preparation or review of the manuscript; or the decision to submit the manuscript for publication.
Honda T, Ohara T, Yoshida D, et al. Development of a dementia prediction model for primary care: The Hisayama Study. Alzheimer's Dement. 2021;13:e12221. 10.1002/dad2.12221
REFERENCES
- 1. Livingston G, Huntley J, Sommerlad A, Ames D, Ballard C, Banerjee S. Dementia prevention, intervention, and care: 2020 report of the Lancet Commission. Lancet. 2020;396:413‐446. [DOI] [PMC free article] [PubMed] [Google Scholar]
- 2. Prince M, Bryce R, Ferri C. World Alzheimer Report 2011: The Benefits of Early Diagnosis and Intervention. London: Alzheimer's Disease International; 2011. [Google Scholar]
- 3. Duboisa B, Padovanib A, Scheltensc P, Rossid A, Agnello GD. Timely diagnosis for Alzheimer's disease: a literature review on benefits and challenges. J Alzheimer's Dis. 2015;49:617‐631. [DOI] [PMC free article] [PubMed] [Google Scholar]
- 4. Hou XH, Feng L, Zhang C, Cao XP, Tan L, Yu JT. Models for predicting risk of dementia: a systematic review. J Neurol Neurosurg Psychiatry. 2018;90(4):373‐379. [DOI] [PubMed] [Google Scholar]
- 5. Stephan BCM, Kurth T, Matthews FE, Brayne C, Dufouil C. Dementia risk prediction in the population: are screening models accurate?. Nat Rev Neurol. 2010;6:318‐326. [DOI] [PubMed] [Google Scholar]
- 6. Ritchie CW, Muniz‐Terrera G. Models for dementia risk prediction: so much activity brings a need for coordination and clarity. J Neurol Neurosurg Psychiatry. 2018;90:1111. [DOI] [PubMed] [Google Scholar]
- 7. Walters K, Hardoon S, Petersen I, Iliffe S, Omar RZ, Nazareth I. Predicting dementia risk in primary care: development and validation of the dementia risk score using routinely collected data. BMC Med. 2016;14:1‐12. [DOI] [PMC free article] [PubMed] [Google Scholar]
- 8. Lin HR, Tsuji T, Kondo K, Imanaka Y. Development of a risk score for the prediction of incident dementia in older adults using a frailty index and health checkup data: the JAGES longitudinal study. Prev Med (Baltim). 2018;112:88‐96. [DOI] [PubMed] [Google Scholar]
- 9. Tomata Y, Sugiyama K, Kaiho Y, Sugawara Y, Hozawa A, Tsuji I. Predictive ability of a simple subjective memory complaints scale for incident dementia: evaluation of Japan's national checklist, the “Kihon Checklist. Geriatr Gerontol Int. 2017;17:1300‐1305. [DOI] [PubMed] [Google Scholar]
- 10. Ninomiya T. Japanese legacy cohort studies: the Hisayama Study. J Epidemiol. 2018;28:444‐451. [DOI] [PMC free article] [PubMed] [Google Scholar]
- 11. Ohara T, Hata J, Yoshida D, Mukai N, Nagata M, Iwaki T. Trends in dementia prevalence, incidence, and survival rate in a Japanese community. Neurology. 2017;88:1925‐1932. [DOI] [PubMed] [Google Scholar]
- 12. Hatabe Y, Shibata M, Ohara T, Oishi E, Yoshida D, Honda T. Decline in handgrip strength from midlife to late‐life is associated with dementia in a Japanese community: the Hisayama Study. J Epidemiol. 2020;30:15‐23. [DOI] [PMC free article] [PubMed] [Google Scholar]
- 13. American Psychiatric Association . Diagnostic and Statistical Manual of Mental Disorders. (3rd ed). Washington, DC: American Psychiatric Association; 1987. [Google Scholar]
- 14. Sullivan LM, Massaro JM, D'Agostino RB. Presentation of multivariate data for clinical use: the Framingham Study risk score functions. Stat Med. 2004;23:1631‐1660. [DOI] [PubMed] [Google Scholar]
- 15. Harrell FE, Lee KL, Mark DB. Multivariable prognostic models: issues in developing models, evaluating assumptions and adequacy, and measuring and reducing errors. Stat Med. 1996;15:361‐387. [DOI] [PubMed] [Google Scholar]
- 16. Demler OV, Paynter NP, Cook NR. Tests of calibration and goodness‐of‐fit in the survival setting. Stat Med. 2015;34:1659‐1680. [DOI] [PMC free article] [PubMed] [Google Scholar]
- 17. Di Marco LY, Marzo A, Muñoz‐Ruiz M, Ikram MA, Kivipelto M, Ruefenacht D. Modifiable lifestyle factors in dementia: a systematic review of longitudinal observational cohort studies. J Alzheimer's Dis. 2014;42:119‐135. [DOI] [PubMed] [Google Scholar]
- 18. Kivipelto M, Ngandu T, Laatikainen T, Winblad B, Soininen H, Tuomilehto J. Risk score for the prediction of dementia risk in 20 years among middle aged people: a longitudinal, population‐based study. Lancet Neurol. 2006;5:735‐741. [DOI] [PubMed] [Google Scholar]
- 19. Barnes DE, Beiser AS, Lee A, Langa KM, Koyama A, Preis SR. Development and validation of a brief dementia screening indicator for primary care. Alzheimer's Dement. 2014;10:656‐665. [DOI] [PMC free article] [PubMed] [Google Scholar]
- 20. Reitz C, Tang M, Schupf N, Manly J, Mayeux R, Luchsinger J. A summary risk score for the prediction of Alzheimer disease in eldelry persons. Arch Neurol. 2010;67:835‐841. [DOI] [PMC free article] [PubMed] [Google Scholar]
- 21. Li J, Ogrodnik M, Devine S, Auerbach S, Wolf PA, Au R. Practical risk score for 5‐, 10‐, and 20‐year prediction of dementia in elderly persons: Framingham Heart Study. Alzheimer's Dement. 2018;14:35‐42. [DOI] [PMC free article] [PubMed] [Google Scholar]
- 22. Anstey KJ, Cherbuin N, Herath PM, Qiu C, Kuller LH, Lopez OL. A self‐report risk index to predict occurrence of dementia in three independent cohorts of older adults: the ANU‐ADRI. PLoS One. 2014;9:e86141. [DOI] [PMC free article] [PubMed] [Google Scholar]
- 23. Lee CMY, Woodward M, Batty GD, Beiser AS, Bell S, Berr C. Association of anthropometry and weight change with risk of dementia and its major subtypes: a meta‐analysis consisting 2.8 million adults with 57 294 cases of dementia. Obes Rev. 2020;21:1‐14. [DOI] [PMC free article] [PubMed] [Google Scholar]
- 24. Yarchoan M, James BD, Shah RC, Arvanitakis Z, Wilson RS, Schneider J. Association of cancer history with Alzheimer's disease dementia and neuropathology. J Alzheimer's Dis. 2017;56:699‐706. [DOI] [PMC free article] [PubMed] [Google Scholar]
- 25. Aiello Bowles EJ, Walker RL, Anderson ML, Dublin S, Crane PK, Larson EB. Risk of Alzheimer's disease or dementia following a cancer diagnosis. PLoS One. 2017;12:1‐11. [DOI] [PMC free article] [PubMed] [Google Scholar]
- 26. Bosco A, Jones KA, Di L C, Stephan BCM, Orrell M, Oliveira D. Changing lifestyle for dementia risk reduction: inductive content analysis of a national UK survey. PLoS One. 2020;15:1‐12. [DOI] [PMC free article] [PubMed] [Google Scholar]
- 27. Martin S, Kelly S, Khan A, Cullum S, Dening T, Rait G. Attitudes and preferences towards screening for dementia: a systematic review of the literature. BMC Geriatr. 2015;15:1‐12. [DOI] [PMC free article] [PubMed] [Google Scholar]
Associated Data
This section collects any data citations, data availability statements, or supplementary materials included in this article.
Supplementary Materials
Supporting material
Supporting material