

Summary
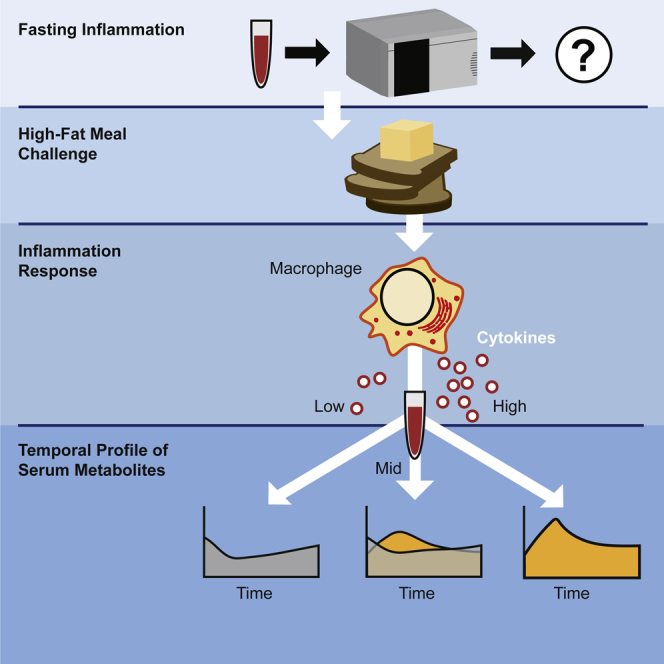
Chronic low-grade inflammation is a subclinical condition directly and indirectly linked to the development of a wide range of diseases responsible for the vast majority of morbidity. To examine mechanisms coupled to chronic disease, a group of overweight and obese human subjects without known inflammatory diseases participated in a high-fat meal challenge as an acute inflammation stimulus. Analysis of serum metabolites grouped by baseline cytokine levels revealed that single samples had little power in differentiating groups. However, an analysis that incorporated temporal response separated inflammatory response phenotypes and allowed us to create a metabolic signature of inflammation which revealed metabolic components that are crucial to a cytokine-mediated inflammation response. The use of temporal response, rather than a single time point, improved metabolomic prediction of high postprandial inflammation responses and led to the development of a dynamic biosignature as a potential tool for stratifying risk to a wide range of diseases.
Keywords: Pathophysiology, Systems biology, Metabolomics
Graphical abstract
Highlights
-
•
Dynamic responses often provide insight into disease pathology
-
•
Temporal metabolic responses to acute inflammation were explored in obese people
-
•
Temporal metabolite levels differentiated low, mid, and high inflammation groups
-
•
Inflammation-linked metabolites were shown to be predictors of cytokine responses
Pathophysiology; Systems biology; Metabolomics
Introduction
Inflammatory diseases including type 2 diabetes, ischemic heart disease, neurodegenerative diseases, and cancer represent a group of human illnesses increasing in prevalence and causing the bulk of human deaths worldwide (Katakami, 2018; Denver and Mcclean, 2018; Park et al., 2018). While there are many causes of low-grade inflammation, one of the most common is upregulation of inflammatory activity in response to hypertrophy-induced adipose tissue dysfunction, particularly visceral adipose tissue located within the abdominal compartment (Ringseis, et al., 2015; Engin, 2017). Thus, low-grade inflammation is a putative driver of obesity-related disease. However, a substantial proportion of obese individuals are metabolically healthy in that they do not meet the criteria for metabolic syndrome (Denis and Obin, 2013; Bagheri, et al., 2018). The extent to which low-grade chronic inflammation alters metabolism in overweight and obese individuals is unclear. Elucidation of the metabolic impacts of being overweight or obese with and without inflammation is needed.
Metabolic impacts of inflammation stem from the actions of inflammatory cytokines and mediators on metabolic pathways (Gregor and Hotamisligil, 2011; Hotamisligil, 2017). Low-grade inflammation is characterized by persistent elevation in pro-inflammatory markers stemming from increased abundance of classically activated M1 macrophages, particularly the cytokines tumor necrosis factor (TNF)-α, interleukin (IL)-1β, and IL-6 (Hotamisligil, 2017). These cytokines have impacts on nutrient metabolism, including the impairment of glucose metabolism. However, impacts of nutrients on inflammation have also been identified, creating a complex web of interactions that is difficult to assess from static biomarkers.
Metabolomic-based biomarkers have been shown to be indicators of disease states while also providing insight into mechanistic causes of disease (Soga, et al., 2006; Considine, 2019). Biomarkers have been identified for many diseases, including ones with a known inflammatory component such as diabetes and atherosclerosis (Stenvinkel, et al., 1999; Wheelock et al., 2013). Patients with chronic low-grade inflammation have different metabolomic profiles that correlate with inflammation status (Pietzner et al., 2017; Fitzpatrick and Young, 2013). Although biomarkers for chronic low-grade inflammation have been reported, biomarkers for progression from chronic low-grade inflammation to inflammatory diseases are limited. This may be due to the challenge of tracking temporal biological processes, with a static, single time point measurement (Bansal, et al., 2007; Tokmina-Lukaszewska, et al., 2014). The purpose of this study is to compare static and temporal metabolomic approaches for predicting the magnitude of inflammatory response and then to elucidate metabolic impacts of those inflammatory responses. The power of our approach arises from looking at metabolite levels over time leading to the generation of a “dynamic biosignature”.
Results
Participants with a body mass index (BMI) >27 and <35 kg·m−2 and no overt health concerns were screened for metabolic syndrome via measurement of waist circumference, blood pressure, and fasting glucose triglycerides and high-density lipoprotein (HDL) (Grundy, 2016). Inflammation cytokine concentration and other factors were also determined before consumption of a high-fat meal, which is an established test to induce inflammation in humans (Herieka and Erridge, 2014). Subsequent glucose and cytokine concentrations were determined at 1, 2, 3, and 4 hr after consumption. Inflammation was determined using a high sensitivity cytokine panel that included TNFα, GM-CSF, IL-1B, IL-6, IL-17, and IL-23. The maximum difference between basal and post meal value for each cytokine over the five time points was used to generate an inflammation response value for each participant. A comprehensive response value was then calculated for each participant by summing the normalized response values for each cytokine. The comprehensive response values were then grouped using a k-means analysis, and participants were designated as either high, mid, or low inflammation responders based on the magnitude of their inflammation response (Hartigan and Wong, 1979) (Figure 1A). Seventeen subjects were classified as low responders, fourteen as mid responders and nine as high responders (Figure 1B, Table S1). High and mid responders had lower fasting cholesterol levels than low responders and were more likely to meet the criteria for metabolic syndrome but did not vary in other measured anthropomorphic or static metabolic characteristics (Table S1). To generate a metabolic profile for each participant, a non-targeted metabolomic analysis of serum samples was conducted using liquid chromatography mass spectrometry (LCMS). An established hydrophilic interaction chromatography (HILIC) method facilitated rapid, reproducible, and deep sample profiling (Awwad, et al., 2016). Raw data were retention time aligned, and background signals were removed using mzMine (Katajamaa, et al., 2006). Through this process, a dataset of 560 unique mass features was obtained. The high-resolution LCMS data showed that the overall metabolic state was similar across the participant pool and did not change dramatically for a given individual during the time series (Figure S1).
Figure 1.

Grouping of participants by cytokine response
(A) K-means analysis of the cytokine concentrations for participants in the cohort. The “elbow” of the optimal clusters graph shows that three groups is the best way to bin the subjects based on cytokine response.
(B) Plots for pro-inflammatory cytokines used in the study at each time point from fasting to four hours after meal. Error bars are included and indicate 95% confidence intervals. See also Table S1.
The composite cytokine response k-means grouping was used to analyze the LCMS at each time point using MetaboAnalyst (Chong, et al., 2019). Principal component analysis (PCA) was performed to examine the separation between inflammation response groups and the impact of time. A PCA analysis of response groupings showed extensive overlap of the groups (Figure 2A, Figure S2). Analysis of variance (ANOVA) confirmed that the groups could not be differentiated, as no metabolites were significantly different at a p value of <0.05 across the time series. Metabolomic profiles were examined in closer detail by generating heatmaps, which showed little to no clustering of specific metabolites based on cytokine-based inflammation responses (Figure 2B). Our conclusion is that these statistical analyses have limited power to differentiate inflammatory responders at specific time points based on the intensity of metabolic features.
Figure 2.

Static metabolic profiling of high and low inflammation groups
(A) A principal component analysis (PCA) of response groups at one hour after meal shows little to no separation.
(B) Heatmap for time point two showing the top 25 discriminating features. The dendrogram at the top of the figure shows little clustering of the inflammation groups. See also Figure S2.
Inflammatory response is a time-dependent process; therefore, we reasoned that even quantitative metabolomics data based on a single time point may fail to capture objective differences (Grigorov, 2011). This is particularly challenging with human subjects as there is a wide range of biological and lifestyle variation. To address this, we analyzed the metabolomic profiles as dynamic datasets with the addition of a temporal component to match our cytokine response groupings. Using time series software in MetaboAnalyst, an analysis of variance-simultaneous component analysis (ASCA) was performed to identify features which contribute to systemic variation in a time-resolved manner. ASCA is accomplished by producing interaction matrices for each feature and then determining the contribution of each feature to systemic variation, much like a PCA model (Saccenti, et al., 2018; Smilde, et al., 2005). This method allows for analysis of multivariate time course data. Discriminating temporal features were then filtered using a squared prediction error (SPE) and a leverage calculation (Figure 3A). This yielded 17 well-modeled features based on q-values and leverage criteria that have group specific concentration patterns.
Figure 3.

Feature interaction based on time and inflammation response
(A) Important features for the interaction between response groups over the time course found by combining SPE scores and leverage.
(B) Cp plot of well-modeled features in a linear regression model predicting cytokine response. Columns represent mass features and rows show BIC values where the best model is on the top row.
The next step was to identify the 17 selected features. This was completed using tandem mass spectrometry (MSMS) to generate collision-induced fragmentation patterns which were matched using an in-house standards library and Sum formula Identification by Ranking Isotope patterns Using mass Spectrometry (SIRIUS) formula and structure prediction software (Dührkop, et al., 2015; Dührkop, et al., 2019). Based on high-resolution mass measurement, retention time, and fragmentation pattern, chemical formula could be assigned for all 17 features, and confident identifications were made for 13 metabolites (Table 1). Identification of the ions at m/z 133.131, 164.142, 240.151, and 82.026 was inconclusive based on available fragmentation databases.
Table 1.
Identification of important features
| Metabolite | Mass | RT | Validation |
|---|---|---|---|
| Acetamide | 60.044 | 1.4 | Authentic standard |
| C4H3NO | 82.026 | 2.4 | MSMS |
| Creatine | 114.065 | 1.8 | Authentic standard |
| Proline | 116.106 | 3.5 | Authentic standard |
| Organonitrogen compound C6H16N2O | 133.131 | 5 | MSMS |
| Hydroxymethyluracil | 143.047 | 1.8 | MSMS |
| Threitol | 145.048 | 1.5 | Authentic standard |
| 4-Guanidinobutyrate | 146.068 | 2.4 | MSMS |
| Guanine | 152.055 | 1.5 | Authentic standard |
| Carnitine | 162.111 | 3.5 | Authentic standard |
| Aralkylamin compound C11H17N | 164.142 | 3.4 | MSMS |
| (5-Amino-6-Hydroxyhexyl)carbamate | 177.119 | 4.9 | MSMS |
| Tigylglycine | 180.064 | 1.7 | MSMS |
| Butyrylglycine | 184.044 | 1.2 | MSMS |
| Azacyclic compound C10H17N5O2 | 240.151 | 1.3 | MSMS |
| Guanosine | 284.097 | 1.5 | Authentic standard |
| Histidinylhistidine | 293.134 | 3.5 | MSMS |
See also Table S3.
Linear models were then generated and tested using the 17 selected metabolites to describe the pro-inflammatory cytokine baseline-to-peak response values, and models with the best Mallow's Cp values (Figure 3B) were determined (Table 2). Linear models were created for each of the six individual cytokine responses that included eleven of the selected metabolites, nine of which were successfully identified (Table 3). Four of the six models, corresponding to IL1B, IL6, TNFα, and granulocyte-macrophage colony-stimulating factor (GMCSF) response, were significant to a p value of <0.05, while the IL17 and IL23 response models had p values of 0.12 and 0.068, respectively. The models associated with IL1B, IL6, TNFα, and GMCSF had the highest coverage as well, with R2 values between 0.65 and 0.25. In contrast, the models for IL17 and IL23 had R2 values below 0.1. Along with individual cytokine models, a composite model was created to better describe the inflammation response as a whole and was composed of five metabolites. A key point is that the cytokine models had the power to predict inflammation response phenotype using only serum metabolite data.
Table 2.
Matrix showing the metabolites in each model
| Metabolite | IL1B | IL6 | IL17 | IL23 | TNF | GMCSF | Composite |
|---|---|---|---|---|---|---|---|
| Creatine | X | X | X | X | |||
| Hydroxymethyluracil | X | X | X | X | |||
| Histidinylhistidine | X | X | X | X | |||
| Threitol | X | X | |||||
| 4-Guanidinobutyric acid | X | X | |||||
| Butyrylglycine | X | X | |||||
| (5-Amino-6-hydroxyhexyl)carbamic acid | X | X | |||||
| 240.151 | X | X | |||||
| Guanine | X | ||||||
| Guanosine | X | ||||||
| 82.026 | X |
Table 3.
Models for each cytokine response and the composite cytokine response
| Cytokine | Metabolites | p value | R2 |
|---|---|---|---|
| IL1B | Creatine + hydroxymethyluracil + threitol + 4-guanidinobutyrate + histidinylhistidine | 0.014 | 0.33 |
| IL6 | Hydroxymethyluracil + guanine + guanosine | 0.016 | 0.25 |
| IL17 | Butyrylglycine | 0.12 | 0.062 |
| IL23 | Hydroxymethyluracil | 0.068 | 0.085 |
| TNF | m/z 82.026 + creatine + (5-amino6-hydroxyhexyl)carbamic acid + m/z 240.151 + histidinylhistidine | 9.50 × 10⁻⁵ | 0.52 |
| GMCSF | Creatine + threitol + butyrylglycine + 4-guanidobutyrate + histidinylhistidine | 6.21 × 10⁻⁷ | 0.65 |
| Composite | Creatine + hydroxymethyluracil + (5-amino6-hydroxyhexyl)carbamic acid + m/z 240.151 + histidinylhistidine | 0.019 | 0.32 |
To validate the dynamic biosignature, data from two independent trials were obtained. Participants were part of food supplementation studies that included a high-fat meal challenge, metabolomic profile analysis, and pro-inflammatory cytokine determination. The high-fat meal challenge used in these studies was identical to the challenge used for the cohort analyzed in this paper. The only criteria for selection was having a BMI >27 and <35 kg·m−2. Each subject was assigned to the appropriate cytokine inflammation group, and metabolites in the composite dynamic biosignature were compiled and placed in the composite linear model. For the 13 participants, the metabolic biosignature assigned 9 to the correct inflammation group (Table 4). Three of the four mis-assignments involved the mid-inflammation designation. Interestingly, the remaining participant had a dynamic biosignature that placed them in the low inflammation group, while their cytokine profile was consistent with high.
Table 4.
Validation studies
| Participant | Study | Predicted | Actual |
|---|---|---|---|
| 1∗ | Lentil | LO | MID |
| 2 | Lentil | LO | LO |
| 3 | Lentil | LO | LO |
| 4 | Lentil | HI | HI |
| 5 | Lentil | LO | LO |
| 6 | Lentil | LO | LO |
| 7 | Lentil | HI | HI |
| 8∗ | Lentil | MID | LO |
| 9∗ | Lentil | LO | HI |
| 1 | Aronia | LO | LO |
| 2 | Aronia | LO | LO |
| 3∗ | Aronia | HI | MID |
| 4 | Aronia | LO | LO |
∗ indicates participants who were incorrectly predicted.
LO, MID and HI indicate participants who were determined to be low-, mid- and high-inflammation responders, respectively.
See also Table S4.
A closer investigation of the model shows that between the basal and one hour after high-fat meal challenge, the high and low inflammation response groups have an inverse slope (Figures 4 and 5). This diametric relationship between high and low inflammation groups was consistent in 8 of the 11 features included in the individual and composite models. Of the eight features with this pattern, the mid-inflammation response group trends with the high-response group for seven of the metabolites and the low-response group for the unknown metabolite m/z 240.151. We describe this and similar patterns of differing metabolic responses between inflammation groups over time as a dynamic biosignature. To understand the metabolic impacts of concentration changes in the selected metabolites, we further examined each metabolite in the context of their metabolic roles and specific patterns in the time series.
Figure 4.

Composite model
Plots of the five metabolites found in the composite model including error bars indicating 95% confidence intervals. Relative concentrations are shown for the entirety of the time course. Creatine, hydroxymethyluracil, and histidinylhistidine represent the three most common metabolites, found in three cytokine models and the composite model while carbamic acid and the unknown metabolite were found in one model each and the composite model. Note the slope change between the high and low response groups at one hour after meal.
Figure 5.

Six of the metabolites from the cytokine models
Each of these metabolites were found in specific cytokine models but were not included in the composite model. 4-Guanidinobutyrate, butyrylglycine, and threitol were part of two cytokine models. The other metabolites were found in one model each. Relative concentrations are shown for the entirety of the time course with error bars indicating 95% confidence intervals.
Discussion
A major finding of this study was that temporal metabolomic responses to an inflammatory stimulus generated clear physiological distinctions not present under basal conditions that were predictive of cytokine-based inflammation responses. A traditional static biosignature can be an effective indicator of a specific metabolic activity or disease state. However, in our case, a static biosignature was unable to convincingly differentiate subjects into groups based on inflammation phenotype. Our breakthrough is the demonstration that the change in metabolic state over time is a more powerful way to differentiate underlying physiologic states than measuring absolute values at any given time. This is analogous to the role of derivatives in the analysis of mathematical functions. Values are based on the change in concentration over a change in time and not on absolute initial or final concentration. Correspondingly, while the group with the lowest inflammation responses had the highest cholesterol and a trend for higher average blood glucose levels over time (as indicated by a trend for higher glycosylated hemoglobin), the group with the highest inflammation responses was more likely to meet the criteria for metabolic syndrome.
Data from 560 serum metabolites collected before and at four time points after a high-fat meal challenge using LCMS were used to construct a predictive model. By coupling the change in markers of inflammation and response kinetics, metabolites having a significant difference between inflammation groups were discovered. Using selected metabolites, linear models were created for each cytokine, and a composite cytokine model was also created. Models showed overlap with several metabolites, including histidinylhistidine and creatine, belonging to the same cytokine model (Table 3). This suggests involvement in the same metabolic response, i.e. histidinylhistidine and creatine abundance are linked. This is consistent with known metabolic pathways and validates the approach used to generate the models (Smith and Ning, 1961).
A further investigation of modeled metabolites from inflammation response groups showed distinct and repeated patterns between the basal and two-hour post-meal metabolomic profiles which includes three time points (Figures 4 and 5). For each metabolite in the composite model, an initial opposing slope direction between the basal and one hour post-meal concentration is observed, after which metabolites show a general trend back to the basal concentration two hours after meal. Three of the five metabolites demonstrated an increase in the first hour for the high responders and a decrease in the first hour for the remaining two metabolites. Low responders displayed the opposite trend. The difference in the concentration changes of the modeled metabolites show that an important temporal component of the cytokine immune response is correlated to the change in concentration of specific metabolites at one hour after meal. However, this trend was not universal with the rest of the metabolites in the cytokine models. Of the six selected metabolites not in the composite model, four had the same pattern of inverse slopes between high and low responders from basal to one hour after meal seen in the composite model metabolites. Modeled metabolites were investigated for known associations with cytokine specific inflammation, inflammation in general, or an inflammatory disease. Several of the metabolites fit into one or all of these categories with some having links between the metabolite and the cytokine in a specific model.
Composite model metabolites
The composite model included creatine, hydroxymethyluracil, histidinylhistdine, (5-amino-6-hydroxyhexyl) carbamic acid, and an unknown metabolite with an m/z value of 240.151.
Creatine is part of the composite model, as well as three individual cytokine models. Creatine is synthesized from amino acids and can be converted to phosphocreatine which is used to replenish ATP stores in muscle cells through the action of creatine kinase (Wallimann, et al., 2011). In our cohort, creatine was included in the IL1B, TNFα, GMCSF, and composite models. Previous work has shown that IL1B and TNFα are inversely correlated with creatine concentration (Bassit et al., 2008). IL1B and TNFα are both alarm cytokines that are expressed early in an inflammatory response due to increases in stress hormones and promote production of other pro-inflammatory cytokines (Baumann and Glaudie 1994; Cupps and Fauci 1982). Phosphocreatine and creatine help to maintain ATP availability and barrier function in the intestinal mucosa during inflammation. High fat and sugar intake induces increased creatine uptake in the intestinal epithelium (Colgan, et al., 2015; Poupin, et al., 2019). Low responders showed an initial increase in creatine concentrations followed by a return to fasting concentrations after two hours (Figure 4A). Mid and high responders had an opposite trend during the first hour showing increasing creatine concentrations with an eventual return to below fasting levels. Our data are consistent with IL1B and TNFα being early responders to inflammation as well as being inversely related to creatine concentration.
Along with creatine, hydroxymethyluracil was included in the composite model, as well as three individual cytokine models. Hydroxymethyluracil is a uracil derivative and is a biomarker for oxidative stress and DNA damage (Decarroz, et al., 1986). It has also been shown to be more abundant in disease states such as in colorectal cancer (Rozalski, et al., 2015). Hydroxymethyluracil fit into models for IL1B, IL6, IL23, and the cytokine composite model. In a recent study, the removal of thymine DNA glycosylase, a DNA oxidation repair mechanism, resulted in the increase of hydroxymethyluracil and IL1B (Tricarico, et al., 2019). Alternatively, increased intracellular ascorbic acid (vitamin C) has been shown to induce hydroxylation of thymine leading to an increase of intracellular hydroxymethyuracil in cell culture (Modrzejewska, et al., 2016). Our data indicate that the high and mid responders showed a decrease in hydroxymethyluracil levels with the introduction of the high-fat meal, while the low responders showed an increase (Figure 4B). Thus, the elevation in hydroxymethyluracil may reflect adaptation of the gut to different nutritional environment between groups that could have conferred some level of resistance to inflammatory stimuli in the low responders. This is a novel observation worthy of follow-up with respect to the potential of antioxidant supplements to mitigate inflammation in the gut.
The final metabolite to be included in not only the composite model but also three additional cytokine models is histidinylhistidine. Histidinylhistidine, also known as histidylhistidine, is composed of two histidine residues and is a product of incomplete protein degradation. This dipeptide appeared in four cytokine models: IL1B, TNFα, GMCSF, and the composite model. Both IL1B and TNFα are potent stimulators of proteolysis, and GMCSF is a pro-inflammatory cytokine that stimulate proliferation and activation of phagocytic leukocytes capable of producing IL1B and TNFα (Chang and Bistrian, 1998; Shiomi and Usui, 2015). These are the same three cytokines models that creatine appears in, and there has been some research showing an effect of histidine on creatine concentrations leading us to postulate that histidinylhistidine may be involved in creatine metabolism signaling (Smith and Ning, 1961). If so, this effect would most likely be inhibitory. A clear inverse relationship is seen within response groups between creatine and histidinylhistidine. Although an association has been observed, this avenue of investigation does not appear to have not been explored since 1961.
One hour after meal, high and mid responders have an increase in histidinylhistidine corresponding to a decrease in creatine during the same time period (Figure 4C). Low responders have an initial decrease in histidinylhistidine and an increase in creatine in the first hour. Histidinylhistidine also has a link to human carbonic anhydrase III (HCA III), a metalloenzyme that converts CO2 to HCO3. This reaction is completed in a two-part process consisting of the conversion of CO2 to HCO3 followed by the release of HCO3 and its replacement with water. This reaction is significantly faster in other human carbonic anhydrases, such as HCA II, and appears to be a result of a residue substitution at Phe 198. This does not hinder the first portion of the reaction but sterically inhibits binding of proton-rich molecules needed to facilitate the release of HCO3 from the enzyme. Histidinylhistidine has been found to bind to Phe 198 and activate the release of HCO3 (Duda, et al., 2005). Changes in HCO3 concentrations have an effect on inflammatory responses through the modulation of cytokine expression including a direct relationship with several interleukins (Ori, et al., 2015; Kawakami, et al., 2020). Therefore, histidinylhistidine binding to Phe 198 on HCA III leads to an increase in HCO3 concentrations, which in turn causes an increase in interleukins and an increased inflammation response.
The fourth metabolite in the composite model is (5-amino-6-hydroxyhexyl)carbamic acid. Carbamic acids are involved in numerous metabolic processes including the transport of carbon dioxide in hemoglobin. Although there are currently no links to inflammation, this metabolite should be investigated further. Concentrations of (5-amino-6-hydroxyhexyl)carbamic acid differed between the low-inflammation and high and mid-inflammation responders from two to three hours after the meal challenge with low-responders increasing and mid- and high-responders decreasing in concentration (Figure 4D). Carbamic acid was also part of the TNFα model.
The final metabolite to be included in the composite model was unable to be identified using our standard library or MSMS fragmentation pattern matching. This unknown metabolite has an m/z value of 240.151 ± 0.005. Although not identified, the unknown metabolite could be an integral part of the dynamic biosignature for inflammation as it shows two different trends one hour after meal (Figure 4E). Low and mid responders showed a decrease in concentration while high responders showed an increase in concentration. This metabolite was also included in the TNFα model.
Cytokine-specific model metabolites
Of the eleven metabolites selected for models, six of them were not included in the composite model. Three metabolites, glutamine, threitol, and 4-guanidinobutyric acid, were part of two different models. The final three metabolites, guanine, guanosin,e and the unknown feature with an m/z value of 82.026, were each included in just one model. However, even though these metabolites were not included in the composite model or in a large number of cytokine models, it does not mean that they do not have an important impact on the inflammatory response.
4-Guanidinobutyrate is a product of arginine metabolism and the first of the metabolites included in two cytokine models. Inflammatory stimuli indirectly affect 4-guanidinobutyric acid production by upregulation of nitric oxide production, which in turn inhibits production of 4-guanidinobutyric acid (Satriano 2004). Increases in 4-guanidinobutyrate were also seen in human monocytes infected with Lyme disease (Kerstholt, et al., 2018). Corresponding to the increase in 4-guanidinobutyric acid in the Lyme disease-infected monocytes was an increase in pro-inflammatory cytokines. 4-Guanidinobutyrate was part of the IL1B and GMCSF models. We measured higher fasting 4-guanidinobutyrate in the low responder group which decreased postprandially (Figure 5A). This shows that 4-guanidinobutyric acid may be part of an initial inflammation response or part of an early effect from the initial inflammation response.
Threitol was also included in two cytokine models. Threitol is a product of xylose metabolism and has been associated with several inflammatory diseases including diabetes (Jing and Chengji, 2019). Threitol was part of our IL1B and GMCSF models and has been linked to IL1B. IL1B and threitol have both shown to lead to arterial calcification by modulating vascular maintenance cells (Collett and Canfield, 2005; Sage, et al., 2010). In our model, threitol concentrations increased in the pivotal first hour in the high and mid responders while decreasing in the low responders (Figure 5B). This pattern reinforces the parallel findings related to arterial calcification.
The last metabolite selected for two models is butyrylglycine, an acyl glycine and a byproduct of butyryl-CoA accumulation. As fatty oxidation activity decreases, the initial compounds, like butyryl-CoA, increase in concentration and are degraded to compounds like butyrylglycine via various metabolic processes. Accumulation of short-chain fatty acids is seen in individuals with short-chain acyl-CoA dehydrogenase deficiency as short-chain acyl-dehydrogenase (SCAD) catalyzes the first step in beta-oxidation for small fatty acids with four to six carbon chains (Lisyová et al., 2018). Fatty acid oxidation rates have an inflammation specific outcome in macrophage mitochondria where increases in fatty acid oxidation, indirectly leading to decreases in butyrylglycine, have been indicated in a decreased inflammatory response (Namgaladze and Brüne, 2016). Butyrylglycine has also been shown to be differentially regulated in obese mice in response to stress associated with a differential inflammatory response (Haley, et al., 2017). Our cohort did not differentiate with respect to slope from the basal time to two hours after meal. However, the high response group continued to increase from two hours after meal to three hours after meal, contrasting the static trend seen in the low and mid responders over the same time period (Figure 5C). As differential processing of fatty acids from the high-fat meal challenge occurs over time, so would differential accumulation of butyryl-CoA and therefore butyrylglycine. This could be due to many factors including SCAD differences in either effectiveness or concentration. Increased butyrylglycine would indicate a decrease in fatty acid oxidation and, if occurring in macrophages, a decrease in inflammation which aligns with our data. High responders show a relatively large increase in butyrylglycine two hours after meal while low responders stay relatively stable. Fittingly, this metabolite was part of the GMCSF model, as well as the IL17 model.
The next two metabolites to be selected for a model were guanine and guanosine. Guanine is a nucleobase and a purine derivative while guanosine is a nucleoside comprising a guanine attached to ribose. Guanine and guanosine have been shown to modulate T-cell-mediated inflammation responses. They accomplish this via an anti-inflammatory effect by inhibiting cytokine production, including IL6 and IL2 (Shinohara and Tsukimoto, 2018). Guanine and guanosine were part of the IL6 model, and both exhibit a pattern where low responders showed increased levels in the first hour while high and mid responders showed decreased levels (Figures 5D and 5E). As an inhibitor of cytokine production, the decrease in the high and mid responders would be expected.
Finally, the unknown feature with an m/z value of 82.026 was also selected for one model. This feature was unable to be identified by either the in-house standard library or by MSMS. The unknown feature is in the TNFα model, and our data show a much higher fasting concentration in the high responder group (Figure 5F). However, this concentration dramatically decreases relative to the other groups to such a degree that after one hour, the high responders have a lower concentration than the other groups.
Taken together, these results paint a complex picture of dynamic inflammation response. Inclusion of metabolites in our models with ample support for roles in inflammation responses, such as creatine and hydroxymethyluracil, reinforces the importance of these metabolites in pro-inflammatory responses. By having well-documented connections between cytokines and specific metabolites in several models, credibility is lent to our statistical methodology and to our models. At the same time, this also provides support for the importance of the metabolites without corresponding inflammation associations in the literature, such as (5-amino-6-hydroxyhexyl) carbamic acid and the unknown metabolites with the m/z values of 240.151 and 82.026, respectively.
This analysis also shows how specific metabolites can be used to describe a dynamic inflammatory response. Previous studies describe the inverse relationship between creatine and cytokines such as IL1B (Bassit et al., 2008). Our work takes this a step further in showing that the inverse relationship is most prominent in the first hour of an inflammatory response in individuals having a low inflammation response. We propose that the increase in creatine is likely contributing to their lower cytokine response. Although the clinical significance of the magnitude of inflammatory responses is unknown, investigating the metabolic profiles of different responses can elucidate vital health information. A further examination could find parameters describing healthy magnitudes of inflammatory response for distinct groups and use these data to provide treatment.
Inflammation responses are complex and variable between individuals so untangling the intricate web of interactions is challenging. Although many compounds in biological systems modulate or are modulated by immune responses, this analysis determined a suite of metabolites that may be predictive of immune response. This study also shows that temporal cytokine responses are correlated with temporal metabolic changes, which we refer to as a dynamic biosignature. By using a temporal interaction model, we were able to correlate changes in cytokines and metabolites which lead to distinct patterns of metabolic activity differentiating overweight and obese adults who responded differently to a dietary inflammation stimulus. In this way, a dynamic lens can provide insight into possible interventions for inflammatory diseases but can also pinpoint relevant interactions and time-dependent modalities.
Limitations of the study
Inflammatory responses measured in this study are to a specific dietary stimulus in a population of overweight and obese adults and demonstrate the utility of our dynamic biosignature approach. Therefore, the specific dynamic biosignature identified in response to this stimulus may not be generalizable to other inflammatory stimuli or populations.
STAR★Methods
Key resources table
| REAGENT or RESOURCE | SOURCE | IDENTIFIER |
|---|---|---|
| Biological samples | ||
| Human serum | Mary Miles Lab | IRB# MM021116-FC |
| Human serum validation data #1 | Mary Miles Lab | IRB#MM010320 |
| Human serum validation data #2 | Mary Miles Lab | IRB#MM100918 |
| Chemicals, peptides, and recombinant proteins | ||
| HPLC grade methanol | Fisher Scientific | Cat#A454 |
| HPLC grade acetonitrile | Fisher Scientific | Cat#A998 |
| HPLC grade water | Fisher Scientific | Cat#W5 |
| Acetone | Sigma Aldrich | Product#650501 |
| Ammonium formate | Sigma Aldrich | Product#70221 |
| Critical commercial assays | ||
| Picollo Xpress Chemistry Analyzer lipid panels | Abaxis, Inc. | Part#400 |
| MILLIPLEX Map Human High Sensitivity T Cell Panel – Immunology Multiplex Assay | Millipore Sigma | Product #HSTCMAG-28SK |
| Deposited data | ||
| Mass spectrometry data | Mendeley Data | https://doi.org/10.17632/j9rfpwbjhj.1 |
| Software and algorithms | ||
| MetaboAnalyst | Chong, et al., 2019 | RRID:SCR_015539 |
| SIRIUS | Dührkop, et al., 2019 | https://bio.informatik.unijena.de/software/sirius/ |
Resource availability
Lead contact
-
•
Further information and requests for resources should be directed to and will be fulfilled by the lead contact, Mary Miles (mmiles@montana.edu).
Materials availability
-
•
The study did not generate new unique reagents.
Data and code availability
-
•
Mass spectrometry data generated in this study have been deposited to Mendeley Data and are publicly available as of the date of publication. DOIs are listed in the key resources table (https://data.mendeley.com/datasets/j9rfpwbjhj/1).
-
•
This paper does not report original code.
-
•
Any additional information required to reanalyze the data reported in this paper is available from the lead contact upon request.
Experimental model and subject details
Ethics statement
The protocol was approved by the Institutional Review Board at Montana State University. Written informed consent was obtained from all participants prior to their participation. The IRB protocol number is MM021116-FC. The protocol was also approved for the separate studies used in the validation analysis by the Institutional Review Board at Montana State University. The associated IRB protocol numbers are MM010320 and MM100918.
Participant selection
Forty overweight and obese (BMI >25), although otherwise apparently healthy men and women participated in testing of anthropometric and metabolic markers and ingestion of a 50g high-fat meal challenge. Participants were 18-55 years old within a body mass index (BMI) of 27 - 36 kg/m2 (Table S1). Potential participants were excluded if they had taken oral antibiotics within 90 days of study enrollment, regularly used anti-inflammatory medications, used estrogen-only contraceptive, had a wheat and/or dairy allergies, were pregnant, or had any musculoskeletal, cardiovascular, gastrointestinal, or immunological condition that could interfere with the study. The second cohort used in the validation study consisted of participants in two separate studies exploring food supplementation. This group had the same BMI criteria (BMI>25), was otherwise healthy, and underwent the same high-fat meal challenge (Table S4).
Method details
Anthropometrics
Measurements were collected from participants using the validated segmental multifrequency bioelectrical impedance analysis (SECA mBCA 515, Hamburg, Germany) (Bosy-Westphal et al., 2013). Fat mass (%) and estimated visceral adipose (L) were used for analysis.
High-fat meal challenge
The high-fat meal contained salted butter (58.3 g, Tillamook) over 3 pieces of whole wheat toast (127.5 g; Wheat Montana). Total energy content of the meal was 714 kcal, with 43.1% from fat, with a macronutrient breakdown of 50 g fat, 54 g carbohydrate, and 12 g protein. Water was provided with the meal; caffeinated black tea was provided for participants who identified as habitual coffee consumers.
Blood sampling
Participants were instructed to avoid alcohol consumption and strenuous physical activity in the 24 hours prior to their visit and to complete an overnight fast (10 - 12 hours) before blood collection. Participant blood samples were collected by a certified nurse or physician in the morning before ingestion of the meal and hourly for 4 hours after meal ingestion, totaling five time points. Whole blood in serum separating tubes was allowed to clot for 15 minutes before centrifugation at 1200 RPM for 15 minutes with resulting serum aliquoted and stored at -80°C until analysis.
Determination of blood markers
Blood markers of metabolic syndrome were determined from whole blood run on Picollo Xpress Chemistry Analyzer lipid panels (Abaxis, Union City, USA). Cytokine measurement was performed using high-sensitivity multiplexing technology (Bio-Rad Bio-Plex® 200 HTS) following procedures by Millipore (EMD Millipore Corporation, Billerica, USA). Selected pro-inflammatory cytokines include granulocyte macrophage colony stimulating factor (GM-CSF), four interleukins (IL) including IL-1β, IL-6, IL-17, IL-23, and tumor necrosis factor alpha (TNF-α). Serum samples at each time point during the high-fat meal challenge were run in duplicate.
Low-grade inflammation and inflammation response group assignment
Assignment of participants to low, mid or high low-grade inflammation groups was made based on a k-means analysis of the cytokine responses (Hartigan and Wong, 1979). K-means analysis is an unsupervised machine learning algorithm that groups data in the most significant way possible while trying to maintain the lowest number of groups. To start the analysis, the cytokine response first needed to be determined. Cytokine response was calculated by taking the time point with the highest post-prandial concentration for each cytokine and then subtracted this value from the basal cytokine concentration. Response values were determined for each of the six cytokines using this method. Cytokine responses were then examined using a k-means analysis in R. The results of the k-means analysis clustered the 40 subjects into three inflammation groups that correspond to low, medium and high inflammation response. 17 subjects were included in the low inflammation response group, 14 were included in the medium inflammation response group and 9 were included in the high inflammation response group. Composite response scores were also created by normalizing values between cytokines to give each cytokine an equal contribution to the overall response score.
Metabolite extraction
Frozen serum samples were thawed and 20μL was placed in a clean tube. 80μL of HPLC grade methanol was added to the sample after which it was vortexed briefly and placed in a -80°C freezer for two hours. After two hours, the sample was centrifuged at 20,000g for 10 minutes. The metabolite supernatant was collected and concentrated in a Speed Vac to dryness while the protein pellet was discarded. Samples were then stored at -80°C until ready for liquid chromatography mass spectrometry (LCMS) analysis at which time they were reconstituted with 40μL of methanol:water (50:50) and placed in a clean mass spectrometry vial.
LCMS conditions
Analysis was completed on an Agilent 6538 Q-TOF MS coupled to an Agilent 1290 UHPLC using a 130Å, 1.7μm, 2.1mm X 100mm Acquity BEH-HILIC HPLC column. Samples were ionized via electrospray ionization and runs were completed in positive mode. Mobile phase A was 15mmol/L ammonium formate and mobile phase B was ACN using a 10-40% A gradient over 6 minutes. Flow was kept at 400μL/minute and the column compartment temperature was set at 30ºC (Awwad, et al., 2016). Pooled serum samples were included in runs before, during and after sample analysis to ensure LCMS function and repeatability of analysis. MSMS analysis, or tandem mass spectrometry, was completed using the same LC conditions while targeting specific ions using retention time and m/z values from previous MS runs.
Quantification and statistical analysis
After LCMS analysis completion, raw data files were converted to .mzML files using MSConvert (Chambers, et al., 2012). Vendor peak picking was used along with a threshold of the 300 most intense ions per scan for data conversion. Data was then mined with mzMine using an intensity minimum value of 1,000 counts based on a visual inspection of the total ion chromatogram to remove noise (Katajamaa, et al., 2006). An error of 20 ppm was used with mzMine along with a retention time window of 0.2 minutes to differentiate unique peaks with similar m/z values. Retention times were analyzed for creatine, m/z value 114.065, to determine retention time drift over the course of the LCMS analysis (Table S2). Blank samples were also run and the resulting features were removed from the biological data if present at a ratio under 5:1 in the sample compared to the blank. Mined data were then input to MetaboAnalyst for statistical analysis including an ANOVA analysis. Sample data was not filtered in MetaboAnalyst due to the number of features and data was normalized using the auto scaling function. Multiple testing correction was accomplished using Tukey’s test. Reproducibility was confirmed by determining the coefficient of variation for each selected metabolite’s ion intensity from the pooled samples that were ran before, during and after the experimental analysis (Table S3). MSMS data were converted to .mgf files using MSConvert and analyzed with Sirius software to obtain compound identifications (Dührkop, et al., 2015; Dührkop, et al., 2019). Molecular formula and molecule identifications were determined by searching the Human Metabolomics Database (HMDB). SIRIUS was used to generate formulas while CSI:Finger ID was used for molecule identification. Both searches were done within a 20ppm error window. Reported identifications were the top metabolite selected by CSI:FingerID. The ZODIAC network tool was used to confirm chemical formula selection and CANOPUS software was utilized to determine the compound class of unknown features.
Additional resources
-
•
This study has been registered with the U.S. National Library of Medicine at clinicaltrials.gov (NCT04128839).
-
•
The secondary cohort, or validation group, in this study consists of participant data from two separate studies, one registered with clinicaltrials.gov (NCT04283448) and a second study that is unregistered.
Acknowledgments
The authors would like to acknowledge the support from a USDA-NIFA (2017-67018-26367) grant, a Montana State University Research Initiative (51040-MSUR12015-03) grant, and the Office of the Vice President for Research and Economic Development at Montana State University. We would also like to thank Dr. Ganesh Balasubramanian and Jesse Thomas from the Montana State University Proteomics, Metabolomics and Mass Spectrometry Facility, for their mass spectrometry expertise and Dr. Sarah Bronsky for supervising sample collection. Funding for the Proteomics, Metabolomics and Mass Spectrometry Facility used in his publication was made possible in part by the MJ Murdock Charitable Trust and the National Institute of General Medical Sciences of the National Institutes of Health under Award Number P20GM103474. The content is solely the responsibility of the authors and does not necessarily represent the official view of the National Institutes of Health.
Author contributions
J.T.P. performed and designed experiments, analyzed data, created figures, and wrote the manuscript. S.M.W. performed and designed experiments, analyzed data, created figures, and collected samples. L.D.G. and L.F. performed experiments and analyzed data. T.T. interpreted statistical data. S.T.W. and C.J.Y. conceived the project. M.P.M. and B.B. conceived and supervised the project and wrote the manuscript.
Declaration of interests
The authors declare no competing interests.
Inclusion and diversity
We worked to ensure gender balance in the recruitment of human subjects. We worked to ensure ethnic or other types of diversity in the recruitment of human subjects. We worked to ensure that the study questionnaires were prepared in an inclusive way. One or more of the authors of this paper self-identifies as an underrepresented ethnic minority in science. One or more of the authors of this paper self-identifies as a member of the LGBTQ + community.
Published: August 20, 2021
Footnotes
Supplemental information can be found online at https://doi.org/10.1016/j.isci.2021.102817.
Contributor Information
Brian Bothner, Email: bbothner@montana.edu.
Mary P. Miles, Email: mmiles@montana.edu.
Supplemental information
References
- Awwad H.M., Geisel J., Obeid R. Determination of trimethylamine, trimethylamine N-oxide, and taurine in human plasma and urine by UHPLC-MS/MS technique. J. Chromatogr. B Analyt. Technol. Biomed. Life Sci. 2016;1038:12–18. doi: 10.1016/j.jchromb.2016.10.017. [DOI] [PubMed] [Google Scholar]
- Bagheri M., Farzadfar F., Qi L., Yekaninejad M.S., Chamari M., Zeleznik O.A., Kalantar Z., Ebrahimi Z., Sheidaie A., Koletzko B. Obesity-related metabolomic profiles and discrimination of metabolically unhealthy obesity. J. Proteome Res. 2018;17:1452–1462. doi: 10.1021/acs.jproteome.7b00802. [DOI] [PubMed] [Google Scholar]
- Bansal S., Buring J.E., Rifai N., Mora S., Sacks F.M., Ridker P.M. Fasting compared with nonfasting triglycerides and risk of cardiovascular events in women. JAMA. 2007;298:309–316. doi: 10.1001/jama.298.3.309. [DOI] [PubMed] [Google Scholar]
- Bassit R.A., Curi R., Costa Rosa L.F. Creatine supplementation reduces plasma levels of pro-inflammatory cytokines and PGE2 after a half-ironman competition. Amino Acids. 2008;35:425–431. doi: 10.1007/s00726-007-0582-4. [DOI] [PubMed] [Google Scholar]
- Baumann H., Gauldie J. The acute phase response. Immunol. Today. 1994;15:74–80. doi: 10.1016/0167-5699(94)90137-6. [DOI] [PubMed] [Google Scholar]
- Bosy-Westphal A., Schautz B., Later W., Kehayias J.J., Gallagher D., Müller M.J. What makes a BIA equation unique? Validity of eight-electrode multifrequency BIA to estimate body composition in a healthy adult population. Eur. J. Clin. Nutr. 2013;67:S14–S21. doi: 10.1038/ejcn.2012.160. [DOI] [PubMed] [Google Scholar]
- Chambers M.C., Maclean B., Burke R., Amodei D., Ruderman D.L., Neumann S., Gatto L., Fischer B., Pratt B., Egertson J. A cross-platform toolkit for mass spectrometry and proteomics. Nat. Biotechnol. 2012;30:918–920. doi: 10.1038/nbt.2377. [DOI] [PMC free article] [PubMed] [Google Scholar]
- Chang H.R., Bistrian B. The role of cytokines in the catabolic consequences of infection and injury. JPEN J. Parenter. Enteral Nutr. 1998;22:156–166. doi: 10.1177/0148607198022003156. [DOI] [PubMed] [Google Scholar]
- Chong J., Wishart D.S., Xia J. Using MetaboAnalyst 4.0 for comprehensive and integrative metabolomics data analysis. Curr. Protoc. Bioinformatics. 2019;68:e86. doi: 10.1002/cpbi.86. [DOI] [PubMed] [Google Scholar]
- Colgan S.P., Curtis V.F., Lanis J.M., Glover L.E. Metabolic regulation of intestinal epithelial barrier during inflammation. Tissue Barriers. 2015;3:e970936. doi: 10.4161/21688362.2014.970936. [DOI] [PMC free article] [PubMed] [Google Scholar]
- Collett G.D.M., Canfield A.E. Angiogenesis and pericytes in the initiation of ectopic calcification. Circ. Res. 2005;96:930–938. doi: 10.1161/01.RES.0000163634.51301.0d. [DOI] [PubMed] [Google Scholar]
- Considine C.E. The search for clinically useful biomarkers of complex disease: a data analysis perspective. Metabolites. 2019;9:126. doi: 10.3390/metabo9070126. [DOI] [PMC free article] [PubMed] [Google Scholar]
- Cupps T.R., Fauci A.S. Corticosteroid-mediated immunoregulation in man. Immunol. Rev. 1982;65:133–155. doi: 10.1111/j.1600-065x.1982.tb00431.x. [DOI] [PubMed] [Google Scholar]
- Decarroz C., Wagner J.R., Van Lier J.E., Krishna C.M., Riesz P., Cadet J. Sensitized photo-oxidation of thymidine by 2-methyl-1,4-naphthoquinone. Characterization of the stable photoproducts. Int. J. Radiat. Biol. Relat. Stud. Phys. Chem. Med. 1986;50:491–505. doi: 10.1080/09553008614550901. [DOI] [PubMed] [Google Scholar]
- Denis G.V., Obin M.S. 'Metabolically healthy obesity': origins and implications. Mol. Aspects Med. 2013;34:59–70. doi: 10.1016/j.mam.2012.10.004. [DOI] [PMC free article] [PubMed] [Google Scholar]
- Denver P., Mcclean P.L. Distinguishing normal brain aging from the development of Alzheimer's disease: inflammation, insulin signaling and cognition. Neural Regen. Res. 2018;13:1719–1730. doi: 10.4103/1673-5374.238608. [DOI] [PMC free article] [PubMed] [Google Scholar]
- Duda D.M., Tu C., Fisher S.Z., An H., Yoshioka C., Govindasamy L., Laipis P.J., Agbandje-Mckenna M., Silverman D.N., Mckenna R. Human carbonic anhydrase III: structural and kinetic study of catalysis and proton transfer. Biochemistry. 2005;44:10046–10053. doi: 10.1021/bi050610h. [DOI] [PubMed] [Google Scholar]
- Dührkop K., Fleischauer M., Ludwig M., Aksenov A.A., Melnik A.V., Meusel M., Dorrestein P.C., Rousu J., Böcker S. SIRIUS 4: a rapid tool for turning tandem mass spectra into metabolite structure information. Nat. Methods. 2019;16:299–302. doi: 10.1038/s41592-019-0344-8. [DOI] [PubMed] [Google Scholar]
- Dührkop K., Shen H., Meusel M., Rousu J., Böcker S. Searching molecular structure databases with tandem mass spectra using CSI:FingerID. Proc. Natl. Acad. Sci. 2015;112:12580. doi: 10.1073/pnas.1509788112. [DOI] [PMC free article] [PubMed] [Google Scholar]
- Engin A. The pathogenesis of obesity-associated adipose tissue inflammation. In: Engin A.B., Engin A., editors. Obesity and Lipotoxicity. Springer International Publishing; Cham: 2017. pp. 221–245. [Google Scholar]
- Fitzpatrick M., Young S.P. Metabolomics--a novel window into inflammatory disease. Swiss Med. Wkly. 2013;143:w13743. doi: 10.4414/smw.2013.13743. [DOI] [PMC free article] [PubMed] [Google Scholar]
- Gregor M.F., Hotamisligil G.S. Inflammatory mechanisms in obesity. Annu. Rev. Immunol. 2011;29:415–445. doi: 10.1146/annurev-immunol-031210-101322. [DOI] [PubMed] [Google Scholar]
- Grigorov M.G. Analysis of time course omics datasets. In: Mayer B., editor. Bioinformatics for Omics Data: Methods and Protocols. Humana Press; Totowa, NJ: 2011. pp. 153–172. [Google Scholar]
- Grundy S.M. Metabolic syndrome update. Trends Cardiovasc. Med. 2016;26:364–373. doi: 10.1016/j.tcm.2015.10.004. [DOI] [PubMed] [Google Scholar]
- Haley M.J., Mullard G., Hollywood K.A., Cooper G.J., Dunn W.B., Lawrence C.B. Adipose tissue and metabolic and inflammatory responses to stroke are altered in obese mice. Dis. Model. Mech. 2017;10:1229–1243. doi: 10.1242/dmm.030411. [DOI] [PMC free article] [PubMed] [Google Scholar]
- Hartigan J.A., Wong M.A. Algorithm AS 136: a K-means clustering algorithm. J. R. Stat. Soc. Ser. C Appl. Stat. 1979;28:100–108. [Google Scholar]
- Herieka M., Erridge C. High-fat meal induced postprandial inflammation. Mol. Nutr. Food Res. 2014;58:136–146. doi: 10.1002/mnfr.201300104. [DOI] [PubMed] [Google Scholar]
- Hotamisligil G.S. Inflammation, metaflammation and immunometabolic disorders. Nature. 2017;542:177. doi: 10.1038/nature21363. [DOI] [PubMed] [Google Scholar]
- Jing L., Chengji W. GC/MS-based metabolomics strategy to analyze the effect of exercise intervention in diabetic rats. Endocr Connect. 2019;8:654–660. doi: 10.1530/EC-19-0012. [DOI] [PMC free article] [PubMed] [Google Scholar]
- Katajamaa M., Miettinen J., Orešič M. MZmine: toolbox for processing and visualization of mass spectrometry based molecular profile data. Bioinformatics. 2006;22:634–636. doi: 10.1093/bioinformatics/btk039. [DOI] [PubMed] [Google Scholar]
- Katakami N. Mechanism of development of atherosclerosis and cardiovascular disease in diabetes mellitus. J. Atheroscler. Thromb. 2018;25:27–39. doi: 10.5551/jat.RV17014. [DOI] [PMC free article] [PubMed] [Google Scholar]
- Kawakami T., Koike A., Maehara T., Hayashi T., Fujimori K. Bicarbonate enhances the inflammatory response by activating JAK/STAT signalling in LPS + IFN-γ-stimulated macrophages. J. Biochem. 2020;167:623–631. doi: 10.1093/jb/mvaa010. [DOI] [PubMed] [Google Scholar]
- Kerstholt M., Vrijmoeth H., Lachmandas E., Oosting M., Lupse M., Flonta M., Dinarello C.A., Netea M.G., Joosten L.A.B. Role of glutathione metabolism in host defense against <em>Borrelia burgdorferi</em> infection. Proc. Natl. Acad. Sci. 2018;115:E2320. doi: 10.1073/pnas.1720833115. [DOI] [PMC free article] [PubMed] [Google Scholar]
- Lisyová J., Chandoga J., Jungová P., Repiský M., Knapková M., Machková M., Dluholucký S., Behúlová D., Šaligová J., Potočňáková Ľ. An unusually high frequency of SCAD deficiency caused by two pathogenic variants in the ACADS gene and its relationship to the ethnic structure in Slovakia. BMC Med. Genet. 2018;19:64. doi: 10.1186/s12881-018-0566-0. [DOI] [PMC free article] [PubMed] [Google Scholar]
- Modrzejewska M., Gawronski M., Skonieczna M., Zarakowska E., Starczak M., Foksinski M., Rzeszowska-Wolny J., Gackowski D., Olinski R. Vitamin C enhances substantially formation of 5-hydroxymethyluracil in cellular DNA. Free Radic. Biol. Med. 2016;101:378–383. doi: 10.1016/j.freeradbiomed.2016.10.535. [DOI] [PubMed] [Google Scholar]
- Namgaladze D., Brüne B. Macrophage fatty acid oxidation and its roles in macrophage polarization and fatty acid-induced inflammation. Biochim. Biophys. Acta. 2016;1861:1796–1807. doi: 10.1016/j.bbalip.2016.09.002. [DOI] [PubMed] [Google Scholar]
- Ori Y., Zingerman B., Bergman M., Bessler H., Salman H. The effect of sodium bicarbonate on cytokine secretion in CKD patients with metabolic acidosis. Biomed. Pharmacother. 2015;71:98–101. doi: 10.1016/j.biopha.2015.02.012. [DOI] [PubMed] [Google Scholar]
- Park C.H., Eun C.S., Han D.S. Intestinal microbiota, chronic inflammation, and colorectal cancer. Intestinal Res. 2018;16:338–345. doi: 10.5217/ir.2018.16.3.338. [DOI] [PMC free article] [PubMed] [Google Scholar]
- Pietzner M., Kaul A., Henning A.K., Kastenmuller G., Artati A., Lerch M.M., Adamski J., Nauck M., Friedrich N. Comprehensive metabolic profiling of chronic low-grade inflammation among generally healthy individuals. BMC MEDICINE. 2017;15 doi: 10.1186/s12916-017-0974-6. [DOI] [PMC free article] [PubMed] [Google Scholar]
- Poupin N., Tremblay-Franco M., Amiel A., Canlet C., Rémond D., Debrauwer L., Dardevet D., Thiele I., Aurich M.K., Jourdan F. Arterio-venous metabolomics exploration reveals major changes across liver and intestine in the obese Yucatan minipig. Sci. Rep. 2019;9:12527. doi: 10.1038/s41598-019-48997-2. [DOI] [PMC free article] [PubMed] [Google Scholar]
- Ringseis R., Eder K., Mooren F., Krüger K. Metabolic signals and innate immune activation in obesity and exercise. Exerc. Immunol. Rev. 2015;21:2015. [PubMed] [Google Scholar]
- Rozalski R., Gackowski D., Siomek-Gorecka A., Starczak M., Modrzejewska M., Banaszkiewicz Z., Olinski R. Urinary 5-hydroxymethyluracil and 8-oxo-7,8-dihydroguanine as potential biomarkers in patients with colorectal cancer. Biomarkers. 2015;20:287–291. doi: 10.3109/1354750X.2015.1068860. [DOI] [PubMed] [Google Scholar]
- Saccenti E., Smilde A.K., Camacho J. Group-wise ANOVA simultaneous component analysis for designed omics experiments. Metabolomics. 2018;14:73. doi: 10.1007/s11306-018-1369-1. [DOI] [PMC free article] [PubMed] [Google Scholar]
- Sage A.P., Tintut Y., Demer L.L. Regulatory mechanisms in vascular calcification. Nat. Rev. Cardiol. 2010;7:528–536. doi: 10.1038/nrcardio.2010.115. [DOI] [PMC free article] [PubMed] [Google Scholar]
- Satriano J. Arginine pathways and the inflammatory response: interregulation of nitric oxide and polyamines: review article. Amino Acids. 2004;26:321–329. doi: 10.1007/s00726-004-0078-4. [DOI] [PubMed] [Google Scholar]
- Shinohara Y., Tsukimoto M. Adenine nucleotides attenuate murine T cell activation induced by concanavalin A or T cell receptor stimulation. Front. Pharmacol. 2018;8:986. doi: 10.3389/fphar.2017.00986. [DOI] [PMC free article] [PubMed] [Google Scholar]
- Shiomi A., Usui T. Pivotal roles of GM-CSF in autoimmunity and inflammation. Mediators Inflamm. 2015;2015:568543. doi: 10.1155/2015/568543. [DOI] [PMC free article] [PubMed] [Google Scholar]
- Smilde A.K., Jansen J.J., Hoefsloot H.C.J., Lamers R.-J.A.N., Van Der Greef J., Timmerman M.E. ANOVA-simultaneous component analysis (ASCA): a new tool for analyzing designed metabolomics data. Bioinformatics. 2005;21:3043–3048. doi: 10.1093/bioinformatics/bti476. [DOI] [PubMed] [Google Scholar]
- Smith L.C., Ning K.C. Effect of L-histidine on creatine, histidine, and 1-methylhistidine excretion of normal and Vit. E-Deficient rabbits. Proc. Soc. Exp. Biol. Med. 1961;107:929–931. doi: 10.3181/00379727-107-26799. [DOI] [PubMed] [Google Scholar]
- Soga T., Baran R., Suematsu M., Ueno Y., Ikeda S., Sakurakawa T., Kakazu Y., Ishikawa T., Robert M., Nishioka T., Tomita M. Differential metabolomics reveals ophthalmic acid as an oxidative stress biomarker indicating hepatic glutathione consumption. J. Biol. Chem. 2006;281:16768–16776. doi: 10.1074/jbc.M601876200. [DOI] [PubMed] [Google Scholar]
- Stenvinkel P., Heimbürger O., Paultre F., Diczfalusy U., Wang T., Berglund L., Jogestrand T. Strong association between malnutrition, inflammation, and atherosclerosis in chronic renal failure. Kidney Int. 1999;55:1899–1911. doi: 10.1046/j.1523-1755.1999.00422.x. [DOI] [PubMed] [Google Scholar]
- Tokmina-Lukaszewska M., Movahed N., Lusczek E.R., Mulier K.E., Beilman G.J., Bothner B. Transformation of UPLC-MS data overcomes extreme variability in urine concentration and metabolite fold change. Curr. Metabolomics. 2014;2:78–87. [Google Scholar]
- Tricarico R., Madzo J., Scher G., Maegawa S., Jelinek J., Scher C., Chang W.-C., Nicolas E., Zhou Y., Slifker M. <em>TET1</em> and <em>TDG</em> suppress intestinal tumorigenesis by down-regulating the inflammatory and immune response pathways. bioRxiv. 2019:676445. [Google Scholar]
- Wallimann T., Tokarska-Schlattner M., Schlattner U. The creatine kinase system and pleiotropic effects of creatine. Amino Acids. 2011;40:1271–1296. doi: 10.1007/s00726-011-0877-3. [DOI] [PMC free article] [PubMed] [Google Scholar]
- Wheelock C.E., Goss V.M., Balgoma D., Nicholas B., Brandsma J., Skipp P.J., Snowden S., Burg D., Amico A., Horvath I. Application of ’omics technologies to biomarker discovery in inflammatory lung diseases. Eur. Respir. J. 2013;42:802. doi: 10.1183/09031936.00078812. [DOI] [PubMed] [Google Scholar]
Associated Data
This section collects any data citations, data availability statements, or supplementary materials included in this article.
Supplementary Materials
Data Availability Statement
-
•
Mass spectrometry data generated in this study have been deposited to Mendeley Data and are publicly available as of the date of publication. DOIs are listed in the key resources table (https://data.mendeley.com/datasets/j9rfpwbjhj/1).
-
•
This paper does not report original code.
-
•
Any additional information required to reanalyze the data reported in this paper is available from the lead contact upon request.