

Abstract
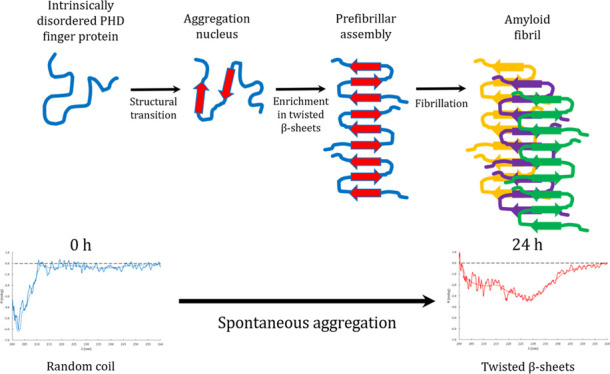
Double PHD fingers 3 (DPF3) is a human epigenetic factor found in the multiprotein BRG1-associated factor (BAF) chromatin remodeling complex. It has two isoforms: DPF3b and DPF3a, but very little is known about the latter. Despite the lack of structural data, it has been established that DPF3a is involved in various protein–protein interactions and that it is subject to phosphorylation. These features are typical of intrinsically disordered proteins (IDPs) for which the disorder is essential to their functionality. IDPs are also prone to aggregation and can assemble into cytotoxic amyloid fibrils in specific pathological contexts. In the present work, the DPF3a disordered nature and propensity to aggregation have been investigated using a combination of disorder predictors and biophysical methods. The DPF3a-predicted disordered character has been correlated to a characteristic random coil signal in far-UV circular dichroism (CD) and to a fluorescence emission band typical of Trp residues fully exposed to the solvent. After DPF3a purification and 24 h of incubation at room temperature, dynamic light scattering confirmed the presence of DPF3a aggregates whose amyloid nature have been highlighted by a specific deep-blue autofluorescence signature, as well as by an increase in thioflavin T fluorescence upon binding. These results are supported by an enrichment in twisted β-sheets as observed in far-UV CD and a blue shift in intrinsic Trp fluorescence. Both indicate that DPF3a spontaneously tends to orderly aggregate into amyloid fibrils. The diversity of optical signatures originates from dynamical transitions between the disordered and aggregated states of the protein during the incubation. Transmission electron microscopy micrographs reveal that the DPF3a fibrillation process leads to the formation of short needle-shape filaments.
1. Introduction
The double plant homeodomain (PHD) fingers 3 (DPF3) protein is a human epigenetic factor that is part of the multiprotein BRG1-associated factor (BAF) chromatin remodeling complex.1,2 At its C-terminus, the first isoform of DPF3 (DPF3b) is characterized by the typical PHD zinc fingers tandem of the DPF family serving as an epigenetic reader domain.3−5 Thanks to these two PHD fingers, DPF3b acts as a histone reader in the BAF complex by binding acetylated or methylated histones on the chromatin.6,7 In contrast to DPF3b, the second isoform DPF3a lacks this pair of PHD fingers, and its sequence ends with a truncated PHD finger (PHD-1/2) and a C-terminal domain whose functions are still unknown (Figure 1A).1,7 All DPF family members present another zinc finger domain (a C2H2 Krüppel-like finger), which is highly conserved even between the two isoforms of DPF3.8 After phosphorylation, DPF3a is involved in the differentiation and development of cardiac or skeletal myocytes, depending on the protein–protein interactions (PPIs).9,10 From a structural point of view, only the PHD tandem of the isoform DPF3b in complex with modified histone peptides has been characterized up to now.6,7 No structural data are available for DPF3a.
Figure 1.

Sequences and predicted disordered regions of the two isoforms of DPF3. (A) Domains organization along the sequence of DPF3b and DPF3a. Distinctive domains are differently colored, while identical domains are depicted with the same color. Between both isoforms, the sequence is perfectly conserved from the 1st to the 292nd residue. (B) PONDR score for DPF3b and (C) for DPF3a along their respective sequence using VSL2 (purple curve), VL-XT (red curve), and XL1-XT (yellow curve) algorithms. Main domains are highlighted with green dashed lines. The horizontal black line at a score of 0.5 is the threshold value above which the sequence is considered disordered. The thicker black line corresponds to the fully disordered regions.
It has recently been predicted that several subunits of the BAF complex are intrinsically disordered proteins (IDPs), and indeed, DPF3 has a predicted percentage of intrinsic disorder (PPID) of 50.5%.11 IDPs do not fold into a well-defined tertiary structure yet remaining fully functional. Conceptually, IDPs radically question the classical protein structure–function paradigm.12,13 Due to their high conformational flexibility, they are able to interact with many different protein partners, hence acting as PPIs hubs. They are also subject to post-translational modifications and can endorse multiple and various structural, functional, and regulatory roles in numerous physiological and pathological contexts.14−16 The structural disorder is strongly related to the functionality of IDPs, which are essential constituents of many multiprotein complexes. IDPs are highly involved in severe human pathologies such as diabetes, cancers, and cardiovascular and neurodegenerative diseases.17 In Alzheimer’s and Parkinson’s diseases, α-synuclein and tau protein are well-described IDPs, which tend to assemble into cytotoxic aggregates including high-order oligomers and fibrillar or amyloid structures.18,19 This type of organized protein aggregate is built on the association of long fibers in which proteins are folded in β-strands and stacked perpendicularly to the axis of the fibril, resulting in a characteristic cross β-sheet structure.20,21
In addition to its high PPID, other hints such as the involvement in diverse PPIs and the propensity to phosphorylation both suggest that DPF3a enters the IDP definition. The characterization of DPF3a disordered nature is therefore fully pertinent for a better understanding of its functionality. Furthermore, the identification of specific aggregation properties can also reveal new DPF3a functions, making it a new drug-targetable amyloidogenic protein. By combining predictive disorder algorithms, as well as spectroscopic, microscopy, and scattering techniques, we report the intrinsically disordered character and prone-to-aggregate in vitro behavior of DPF3a.
2. Results and Discussion
2.1. First Hints of DPF3a Intrinsic Disorder
According to disorder predictors, both DPF3a and b isoforms present disordered structures. However, an appreciable discrepancy of PPID scores is observed between the two isoforms. While DPF3b shows scores of a moderately disordered protein (PPIDVSL2 = 56.4%, PPIDVL-XT = 40.5%, and PPIDXL1-XT = 34.4%), DPF3a is a highly disordered protein (PPIDVSL2 = 78.7%, PPIDVL-XT = 59.1%, and PPIDXL1-XT = 48.46%) with scores comparable to those of α-synuclein (PPIDVSL2 = 90.7%, PPIDVL-XT = 37.1%, and PPIDXL1-XT = 45.7%) and tau protein (PPIDVSL2 = 99.1%, PPIDVL-XT = 77.6%, and PPIDXL1-XT = 82.4%). Thus, DPF3a is predicted to be far more disordered than DPF3b, especially from its truncated finger PHD-1/2 up to the end of its sequence at the C-terminus, for which the algorithms return high disorder scores (Figure 1C). Moreover, the disorder score significantly drops in the region of the tandem PHD domain of DPF3b (Figure 1B).
Several experimental evidences of DPF3a intrinsic disorder have also been highlighted, as just after purification it exhibits typical footprints of IDPs. From far-UV circular dichroism (CD) spectroscopy, a distinctive random coil signature is observed with a strong negative band at 202 nm (Figure 2A), which is typically observed for disordered proteins.22 Presented raw data could not be normalized to molar ellipticity due to the difficulty to accurately determine the DPF3a concentration (ranging from 4 to 120 μM for analyzed samples) from conventional methods (such as Bradford or absorbance at 280 nm), as often noticed for IDPs.23
Figure 2.

Spectroscopic signatures of intrinsic disorder and protein aggregation. (A) Far-UV CD spectra of DPF3a after purification (blue curve) and after 24 h of incubation at r.t. (red curve). (B) ITF spectra (λexc = 295 nm and sw = 5 nm) of DPF3a after purification (blue curve) and after 24 h of incubation at r.t. (red curve). The buffer spectrum (green curve) corresponds to the protease buffer (50 mM Tris-HCl pH 7.5, 150 mM NaCl, and 1 mM CaCl2).
A signature associated to disorder is also observed by intrinsic tryptophan fluorescence (ITF). After excitation at 295 nm, the ITF spectrum reveals an emission signal at 355 nm corresponding to Trp residues fully exposed to the solvent (Figure 2B).24 In other words, Trp residues of DPF3a are not located in a stable hydrophobic core as commonly found in globular proteins but are rather completely exposed to the solvent. Together, these first predictive and experimental clues clearly indicate that DPF3a belongs to the class of IDPs.
2.2. DPF3a Is a Prone-to-Aggregate Protein with Typical Amyloid Fibril Signatures
Spontaneous fibrillation behavior of amyloidogenic proteins such as α-synuclein has already been reported in the literature.25 Kinetics of such mechanisms are influenced by the solvent, the pH, and the ionic strength. At physiological pH and 100 mM NaCl, α-synuclein (concentration ∼ 140 μM) assembles into amyloid fibrils within 20 h.26 In order to determine if DPF3a can spontaneously aggregate similarly to α-synuclein, the protein was characterized after an incubation time of 24 h at room temperature (r.t.) following the purification step.
Dynamic light scattering (DLS) measurements unequivocally reveal the formation of large protein aggregates after incubation. Indeed, after 24 h, the D̅h value increases from ∼31 to >250 nm (see Figure S1 in the Supporting Information). Such dimensions are much larger than the hydrodynamical diameter range expected for globular proteins (from ∼3 to ∼10 nm) and nonaggregated IDPs (from ∼5 to ∼22 nm).27 At time 0 h, DPF3a is likely to partially assemble into a low-order oligomeric form.
The nature of DPF3a aggregates has also been assessed by deep-blue autofluorescence (dbAF). After excitation ranging from 350 to 355 nm, the intrinsic blue-green fluorescence phenomenon is typically found among amyloidogenic proteins during their fibrillation process and could originate from electron exchange between cross β-sheets.28,29 We indeed observe a characteristic dbAF emission band at 456 nm after 24 h of incubation, indicating that DPF3a can aggregate into amyloid fibrils (Figure 3A).
Figure 3.

Intrinsic and extrinsic spectroscopic signatures of amyloid fibrils. (A) dbAF spectra (λexc = 350 nm, sw = 5 nm) of DPF3a after purification (blue curve) and after 24 h of incubation at r.t. (red curve). The buffer spectrum (green curve) corresponds to the protease buffer (50 mM Tris-HCl pH 7.5, 150 mM NaCl, and 1 mM CaCl2). (B) ThT binding assay spectra (λexc = 440 nm, sw = 10 nm, and CThT = 20 μM) of DPF3a after purification (blue curve) and after 24 h of incubation at r.t. (red curve). The buffer spectrum (green curve) corresponds to the work solution of 20 μM ThT in 10 mM phosphate buffer pH 7.0, 150 mM NaCl. Both dbAF and ThT footprints obtained after 24 h are typical of amyloid aggregates.
Second, the thioflavin T (ThT) binding assay shows a fivefold increase (compared to the ThT work solution) in intensity of the ThT emission band (at 485 nm) for the incubated sample (Figure 3B). Such an increase in ThT fluorescence intensity is also an indicator of amyloid aggregates,30 supporting the dbAF observations. In the same way, the nonincubated sample does not display such a ThT fluorescence increase. It can be concluded from dbAF and ThT analyses that DPF3a has achieved spontaneous amyloid fibrillation after a 24 h incubation.
DPF3a propensity to form amyloid fibrils is also supported by CD. Indeed, compared to the previously observed random coil band, the far-UV CD spectrum of the incubated sample presents a band shift to 227 nm, indicating that DPF3a can undergo dramatic conformational changes (Figure 2A). Such a CD signature has already been reported for α-synuclein amyloid fibrils and is related to an enrichment in twisted β-sheets.31,32 The coexistence of this footprint with the random coil is not inconsistent as IDPs are known to be prone to aggregate, sometimes leading to amyloid fibrils.
DPF3a conformational transition due to amyloid fibrillation is observed by ITF as well. In comparison with the nonincubated sample, the Trp emission band is blue-shifted to 335 nm, implying that DPF3a Trp residues are less exposed to the solvent when the protein undergoes a transition to β-sheet ordered structures and aggregates into fibrils (Figure 2B). The 24 h-incubated sample also exhibits a second emission band at 453 nm, which is reproducible.
To better understand the role of Trp residues in this new fluorescence signature, both ITF emission bands (respectively at 335 and 453 nm) have been recorded at excitation wavelengths higher than the Trp one (295 nm). As expected from the first emission band related to Trp residues, its intensity quickly decreases from 295 nm (Figure 4). Regarding the second emission band, its fluorescence intensity increases from 310 to 330 nm. To the best of our knowledge, this is the first time this second ITF emission band in the visible range is reported but still needs further investigation.
Figure 4.

First ITF emission band (blue points) and second ITF emission band (red points) intensity variations of DPF3a after 24 h of incubation at r.t. according to the excitation wavelength.
It is common to find cysteine (Cys)-rich proteins (>5% of the sequence content) falling under the definition of IDPs or containing IDRs.33 In addition, Cys residues are very sensitive to redox conditions, which can dramatically impact the aggregation mechanisms and amyloid fibrillation of proteins.34 In the case of DPF3a, it contains 12 Cys residues, which represents 3.4% of its sequence content. This value is not that far from the average proportion of Cys residues found among mammalian proteins (2.3%).35 In comparison, DPF3b is more enriched in Cys residues as it contains 21 of these, corresponding to 5.6% of its sequence content. The relative high occurrence of Cys residues in both DPF3 isoforms is mainly due to the presence of zinc fingers (C2H2 Krüppel-like and PHD domains) which require up to four Cys to complex Zn2+ cations. Cys residues involved in such zinc finger structures are reduced (thiol).
Although DPF3a is a disordered protein containing <5% Cys, it is likely to be sensitive to redox conditions. Apart from the Cys residues found in zinc fingers, it is indeed possible that those remaining are involved in intermolecular disulfide bridges between DPF3a monomers under specific conditions. The oxidation state of Cys residues could therefore alter DPF3a aggregation properties.
2.3. DPF3a Aggregates Show a Morphologic Diversity Associated to the Fibrillation Mechanism
After 24 h of incubation, DPF3a unambiguously forms in vitro protein aggregates with a particular variety of not only morphologies but also sizes (Figure 5), which correlate with the D̅h range measured by DLS. As suggested by transmission electron microscopy (TEM) micrographs, DPF3a can follow an aggregation mechanism, leading to fibrillar structures through a series of intermediary aggregated states (Figure 5A).36 Fibrillation starts with protein oligomerization into spherical high-order oligomers which are called spherical nucleation units (SNUs) due to their distinctive shape (Figure 5B). DPF3a SNUs then cluster together and elongate into granular prefibrillar aggregates or granular protofibrils that present the shape of a string of beads (Figure 5C). Protofibrils usually assemble into mature and extended fibrils that gather into cytotoxic amyloid fibril networks. However, such amyloid assemblies have not been detected in DPF3a samples. Instead, short (between 100 and 200 nm long), striated, and needle-shape filaments or fibrils have been identified (Figure 5D). The filaments are not isolated and regroup in highly concentrated areas in which SNUs are also detected. Their striated aspect can result from the association of smaller linear protofibrils. Such a fibrillation process and morphologic diversity of aggregates have already been reported for amyloidogenic and disordered proteins such as the tau protein.37−39
Figure 5.

Morphologic diversity of DPF3a aggregates shown by NS TEM micrographs. (A) Suggested DPF3a in vitro fibrillation and aggregation pathways. (B) Oligomers or SNUs based on the shape of protein assemblies. (C) Granular prefibrillar aggregates or granular protofibrils that elongate from the clustering of SNUs. (D) Short, striated, and needle-shaped filaments or fibrils (red arrow) forming highly concentrated areas where SNUs (blue arrow) are also detected. (E) Amorphous aggregates. These typical aggregated structures are consistently found within DPF3a samples incubated 24 h at r.t. Micrographs were recorded at a voltage of 100 kV, and on each one of them, the scale bar is indicated at the bottom right.
Beside this aggregation pattern, DPF3a forms unorganized protein assemblies reflected by large amorphous aggregates (Figure 5E). Amorphous aggregates have also been observed for the tau protein, and similarly to protofibrils, they could also act as a starting point for amyloid fibrillation.40
3. Conclusions
It has been shown by predictive disorder algorithms and demonstrated by spectroscopic signatures that DPF3a belongs to the class of IDPs. In addition, DPF3a tends to spontaneously aggregate into large diffusing entities detected by DLS. The amyloid nature of aggregates was ascertained by dbAF, ThT binding, and far-UV CD analyses. A second ITF emission band was recorded for DPF3a amyloid fibrils.
The diversity of obtained spectral footprints is due to the dynamical character of structural transitions between disordered and orderly aggregated states of DPF3a. Indeed, while DPF3a collected after purification displays typical IDP signals, the incubated sample is related to amyloid fibrils. These structural changes are also reflected in the morphologic variety observed by TEM. DPF3a follows specific aggregation mechanisms leading to amyloid-like needle-shape filaments.
This study has given the first clues about DPF3a being an amyloidogenic IDP, along with α-synuclein and tau protein. Beyond the scope of the present paper, the aggregation kinetics and associated physicochemical factors (pH, ionic strength, protein concentration, and redox conditions) and the in cellulo effective cytotoxicity of such DPF3a aggregates will be assessed in near future.
The detected intrinsic disorder and the amyloid-like aggregation properties both suggest that DPF3a, beyond its histone reader function, can play a role in neuronal cells. DPF3a has recently been shown to act in stemness maintenance of glioma initiating cells and highlighted as a potential therapeutic target for glioblastoma.41 DPF3a therefore appears as a new promising candidate in drug design strategies targeting IDPs and prone-to-aggregate proteins. To avoid side effects, the druggability process of DPF3a will have to consider possible inhibitory actions interfering with its transcriptional activity in the BAF complex.
4. Materials and Methods
4.1. Overexpression and Purification of DPF3a
DPF3a recombinant proteins were expressed with a GST tag at its N-terminus using the pGEX-3X vector in Escherichia coli BL21 Rosetta 2. The transformed bacterial strain was precultured in 20 g/L LB Lennox broth with 0.36 mM ampicillin at 37 °C for 16 h. From a 5.0 mL preculture aliquot, strains were cultured in 20 g/L LB with 0.14 mM ampicillin at 37 °C until the optical density at 600 nm reached 0.6. Cultures were then induced with 0.5 mM isopropyl β-d-1-thiogalactopyranoside at 37 °C for 4 h and centrifuged. Once the supernatants were discarded, pellets were conserved at −20 °C. For the lysis step, the pellet was suspended in the lysis buffer, that is, phosphate-buffered saline (PBS) pH 7.3, 0.5% Triton X-100, 200 mM KCl, and 200 μM phenylmethylsulfonyl fluoride, and sonicated in an ice-water bath. The supernatant is collected after centrifugation and purified on an Äkta purifier fast protein liquid chromatography system. With the binding buffer, that is, PBS pH 7.3, 200 mM KCl, DPF3a-GST fusion proteins were bound on a 5 mL GSTrap FF prepacked column (GE Healthcare). DPF3a proteins were cleaved on the column (at 23 °C for 16 h) from their GST tag with 20 μg of factor Xa (New England Biolabs) in the protease buffer, that is, 50 mM Tris-HCl pH 7.5, 150 mM NaCl, and 1 mM CaCl2. Cleaved proteins were gathered in the protease buffer, and the presence of DPF3a was further confirmed with mass spectrometry analysis. Characterization analyses were performed just after purification and after 24 h of incubation. The presented results are the typical signatures which have been systematically reproduced for a consistent amount of DPF3a samples.
4.2. Determination of Protein Concentration
Measurements of the absorbance at 280 nm were performed with a UV-6300PC spectrophotometer (VWR), using a 10 mm pathlength quartz QS cell (Hellma). From the DPF3a-calculated molar extinction coefficient (ε = 25,620 M–1·cm–1),42 concentrations ranging from 4 to 120 μM were obtained.
4.3. Dynamic Light Scattering
DLS measurements were carried out with a Horiba Zetasizer SZ-100 nanoparticle analyzer with the detector at 90° at 25 °C. The autocorrelation function was successfully fitted 20 times per analysis, and the results were expressed as the mean hydrodynamical diameter D̅h (nm).
4.4. CD Spectroscopy
Far-UV CD spectra (195–260 nm) were recorded with a Jasco J-810 spectropolarimeter at 20 °C in the protease buffer, using a 1 mm pathlength quartz Suprasil cell (Hellma). Four scans (50 nm/min, 1 nm bandwidth, 0.1 nm data pitch, and 1 s digital integration time) were averaged, baselines were subtracted, and no smoothing was applied. Data obtained with an applied high-tension voltage of above 600 V were not considered.
4.5. Fluorescence Spectroscopy
This section details the fluorescence procedures, that is, ITF, dbAF, and ThT binding assay. Fluorescence spectra (λexc = 600 nm) were recorded with an Agilent Cary Eclipse fluorescence spectrophotometer at r.t. in the protease buffer, using a 10 mm pathlength quartz QS cell (Hellma). The following parameters were used for ITF: excitation and emission slit width (sw) = 5 nm and λexc = 295 nm. For dbAF, sw = 5 nm and λexc = 350 nm. For ThT binding assay, sw = 10 nm and λexc = 440 nm. The resulting spectra were obtained by scanning the emission range of interest by increments of 1.0 nm. Specific to the extrinsic ThT fluorescence procedure, 50 μL of the protein material was mixed with 950 μL of 20 μM ThT in 10 mM phosphate buffer pH 7.0 and 150 mM NaCl. Before use, the ThT work solution was passed through a 0.2 μm polyether sulfone filter.
4.6. Transmission Electron Microscopy
TEM micrographs were obtained with a PHILIPS/FEI Tecnai 10 electron microscope operating at 100 kV. Protein aggregates were visualized by negative staining (NS). Formvar/carbon-coated copper grids were beforehand hydrophilized by glow discharge. The grid was left for 2 min on a 5 μL droplet of the protein material and then deposited on a 5 μL droplet of 0.5% (w/v) uranyl acetate (as contrast agent) for 1 min. The grid was rinsed with Milli-Q water and dried for 5 min. At each step, the excess of solution was blotted with a Whatman filter paper.
4.7. PONDR Disorder Prediction
Intrinsic disordered regions were localized with the Predictors of Natural Disordered Regions (PONDR) (http://www.pondr.com/). Predictions were based on the DPF3a known sequence (UniProt: Q92784-2) and on the following per-residue prediction algorithms: VSL2,43 VL-XT,44 and XL1-XT.43 The protein propensity to disorder relies on the nature of its constituting amino acids, which can be placed on a scale ranging from 0 (fully ordering amino acids) to 1 (fully disordering amino acids). The amino acids above the threshold value of 0.5 are classified as disorder-promoting. Ratios of disordered residues within query sequences are expressed in terms of the PPID.
Acknowledgments
Authors are grateful to the Research Unit in Biology of Microorganisms, as well as to the MaSUN, L.O.S., and Morph-Im platforms of the University of Namur. G.V. thanks the Belgian National Fund for Scientific Research (FNRS) for her TELEVIE PhD student position. C.M. and D.M. also thank the FNRS for their Research Associate position. E.A.P. also thanks the FNRS for his Senior Research Associate position. This research did not receive any specific grant from funding agencies in the public, commercial, or not-for-profit sectors.
Glossary
Abbreviations
- BAF
BRG1-associated factor
- CD
circular dichroism
- dbAF
deep-blue autofluorescence
- DPF3
double PHD fingers 3
- DLS
dynamic light scattering
- IDP
intrinsically disordered protein
- ITF
intrinsic tryptophan fluorescence
- NS
negative staining
- PHD
plant homeodomain
- PPID
predicted percentage of intrinsic disorder
- PONDR
Predictors of Natural Disordered Regions
- PPI
protein–protein interaction
- r.t.
room temperature
- SNU
spherical nucleation unit
- TEM
transmission electron microscopy
- ThT
thioflavin T
Supporting Information Available
The Supporting Information is available free of charge at https://pubs.acs.org/doi/10.1021/acsomega.1c01948.
Typical size distribution and g2(T) intensity correlation function, obtained by DLS, of the DPF3a sample after 24 h (PDF)
The authors declare no competing financial interest.
Supplementary Material
References
- Lange M.; Kaynak B.; Forster U. B.; Tönjes M.; Fischer J. J.; Grimm C.; Schlesinger J.; Just S.; Dunkel I.; Krueger T.; Mebus S.; Lehrach H.; Lurz R.; Gobom J.; Rottbauer W.; Abdelilah-Seyfried S.; Sperling S. Regulation of Muscle Development by DPF3, a Novel Histone Acetylation and Methylation Reader of the BAF Chromatin Remodeling Complex. Genes Dev. 2008, 22, 2370–2384. 10.1101/gad.471408. [DOI] [PMC free article] [PubMed] [Google Scholar]
- Ishizaka A.; Mizutani T.; Kobayashi K.; Tando T.; Sakurai K.; Fujiwara T.; Iba H. Double Plant Homeodomain (PHD) Finger Proteins DPF3a and -3b Are Required as Transcriptional Co-Activators in SWI/SNF Complex-Dependent Activation of NF-ΚB RelA/P50 Heterodimer. J. Biol. Chem. 2012, 287, 11924–11933. 10.1074/jbc.m111.322792. [DOI] [PMC free article] [PubMed] [Google Scholar]
- Kulikova D. A.; Mertsalov I. B.; Simonova O. B. D4 Family Genes: Genomic Organization and Expression. Russ. J. Dev. Biol. 2013, 44, 1–6. 10.1134/s1062360413010037. [DOI] [PubMed] [Google Scholar]
- Sanchez R.; Zhou M. M. The PHD Finger: A Versatile Epigenome Reader. Trends Biochem. Sci. 2011, 36, 364–372. 10.1016/j.tibs.2011.03.005. [DOI] [PMC free article] [PubMed] [Google Scholar]
- Boamah D.; Lin T.; Poppinga F. A.; Basu S.; Rahman S.; Essel F.; Chakravarty S. Characteristics of a PHD Finger Subtype. Biochemistry 2018, 57, 525–539. 10.1021/acs.biochem.7b00705. [DOI] [PMC free article] [PubMed] [Google Scholar]
- Zeng L.; Zhang Q.; Li S.; Plotnikov A. N.; Walsh M. J.; Zhou M.-M. Mechanism and Regulation of Acetylated Histone Binding by the Tandem PHD Finger of DPF3b. Nature 2010, 466, 258–262. 10.1038/nature09139. [DOI] [PMC free article] [PubMed] [Google Scholar]
- Li W.; Zhao A.; Tempel W.; Loppnau P.; Liu Y. Crystal Structure of DPF3b in Complex with an Acetylated Histone Peptide. J. Struct. Biol. 2016, 195, 365–372. 10.1016/j.jsb.2016.07.001. [DOI] [PubMed] [Google Scholar]
- Zhang W.; Xu C.; Bian C.; Tempel W.; Crombet L.; MacKenzie F.; Min J.; Liu Z.; Qi C. Crystal Structure of the Cys2His2-Type Zinc Finger Domain of Human DPF2. Biochem. Biophys. Res. Commun. 2011, 413, 58–61. 10.1016/j.bbrc.2011.08.043. [DOI] [PubMed] [Google Scholar]
- Cui H.; Schlesinger J.; Schoenhals S.; Tönjes M.; Dunkel I.; Meierhofer D.; Cano E.; Schulz K.; Berger M. F.; Haack T.; Abdelilah-Seyfried S.; Bulyk M. L.; Sauer S.; Sperling S. R. Phosphorylation of the Chromatin Remodeling Factor DPF3a Induces Cardiac Hypertrophy through Releasing HEY Repressors from DNA. Nucleic Acids Res. 2015, 44, 2538–2553. 10.1093/nar/gkv1244. [DOI] [PMC free article] [PubMed] [Google Scholar]
- Zhu X.; Lan B.; Yi X.; He C.; Dang L.; Zhou X.; Lu Y.; Sun Y.; Liu Z.; Bai X.; Zhang K.; Li B.; Li M. J.; Chen Y.; Zhang L. HRP2-DPF3a-BAF Complex Coordinates Histone Modification and Chromatin Remodeling to Regulate Myogenic Gene Transcription. Nucleic Acids Res. 2020, 48, 6563–6582. 10.1093/nar/gkaa441. [DOI] [PMC free article] [PubMed] [Google Scholar]
- El Hadidy N.; Uversky V. N. Intrinsic Disorder of the Baf Complex: Roles in Chromatin Remodeling and Disease Development. Int. J. Mol. Sci. 2019, 20, 5260. 10.3390/ijms20215260. [DOI] [PMC free article] [PubMed] [Google Scholar]
- Wright P. E.; Dyson H. J. Intrinsically Unstructured Proteins: Re-Assessing the Protein Structure-Function Paradigm. J. Mol. Biol. 1999, 293, 321–331. 10.1006/jmbi.1999.3110. [DOI] [PubMed] [Google Scholar]
- Dunker A. K.; Lawson J. D.; Brown C. J.; Williams R. M.; Romero P.; Oh J. S.; Oldfield C. J.; Campen A. M.; Ratliff C. M.; Hipps K. W.; Ausio J.; Nissen M. S.; Reeves R.; Kang C.; Kissinger C. R.; Bailey R. W.; Griswold M. D.; Chiu W.; Garner E. C.; Obradovic Z. Intrinsically Disordered Protein. J. Mol. Graphics Modell. 2001, 19, 26–59. 10.1016/s1093-3263(00)00138-8. [DOI] [PubMed] [Google Scholar]
- Tompa P.Structure and Function of Intrinsically Disordered Proteins, 1st ed.; Chapman & Hall/CRC Press: Boca Raton, 2009. [Google Scholar]
- Wright P. E.; Dyson H. J. Intrinsically Disordered Proteins in Cellular Signaling and Regulation. Nat. Rev. Mol. Cell Biol. 2015, 16, 18–29. 10.1038/nrm3920. [DOI] [PMC free article] [PubMed] [Google Scholar]
- Darling A. L.; Uversky V. N. Intrinsic Disorder and Posttranslational Modifications: The Darker Side of the Biological Dark Matter. Front. Genet. 2018, 9, 158. 10.3389/fgene.2018.00158. [DOI] [PMC free article] [PubMed] [Google Scholar]
- Metallo S. J. Intrinsically Disordered Proteins Are Potential Drug Targets. Curr. Opin. Chem. Biol. 2010, 14, 481–488. 10.1016/j.cbpa.2010.06.169. [DOI] [PMC free article] [PubMed] [Google Scholar]
- Uversky V. N. Intrinsically Disordered Proteins and Novel Strategies for Drug Discovery. Expert Opin. Drug Discovery 2012, 7, 475–488. 10.1517/17460441.2012.686489. [DOI] [PubMed] [Google Scholar]
- Vasili E.; Dominguez-Meijide A.; Outeiro T. F. Spreading of α-Synuclein and Tau: A Systematic Comparison of the Mechanisms Involved. Front. Mol. Neurosci. 2019, 12, 107. 10.3389/fnmol.2019.00107. [DOI] [PMC free article] [PubMed] [Google Scholar]
- Maji S. K.; Wang L.; Greenwald J.; Riek R. Structure-Activity Relationship of Amyloid Fibrils. FEBS Lett. 2009, 583, 2610–2617. 10.1016/j.febslet.2009.07.003. [DOI] [PubMed] [Google Scholar]
- Fitzpatrick A. W. P.; Debelouchina G. T.; Bayro M. J.; Clare D. K.; Caporini M. A.; Bajaj V. S.; Jaroniec C. P.; Wang L.; Ladizhansky V.; Müller S. A.; MacPhee C. E.; Waudby C. A.; Mott H. R.; De Simone A.; Knowles T. P. J.; Saibil H. R.; Vendruscolo M.; Orlova E. V.; Griffin R. G.; Dobson C. M. Atomic Structure and Hierarchical Assembly of a Cross-β Amyloid Fibril. Proc. Natl. Acad. Sci. U.S.A. 2013, 110, 5468–5473. 10.1073/pnas.1219476110. [DOI] [PMC free article] [PubMed] [Google Scholar]
- Uversky V. N.Biophysical Methods to Investigate Intrinsically Disordered Proteins: Avoiding an “Elephant and Blind Men” Situation. Intrinsically Disordered Proteins Studied by NMR Spectroscopy; Springer, 2015; pp 215–260. [DOI] [PubMed] [Google Scholar]
- Contreras-Martos S.; Nguyen H. H.; Nguyen P. N.; Hristozova N.; Macossay-Castillo M.; Kovacs D.; Bekesi A.; Oemig J. S.; Maes D.; Pauwels K.; Tompa P.; Lebrun P. Quantification of Intrinsically Disordered Proteins: A Problem Not Fully Appreciated. Front. Mol. Biosci. 2018, 5, 83. 10.3389/fmolb.2018.00083. [DOI] [PMC free article] [PubMed] [Google Scholar]
- Vivian J. T.; Callis P. R. Mechanisms of Tryptophan Fluorescence Shifts in Proteins. Biophys. J. 2001, 80, 2093–2109. 10.1016/s0006-3495(01)76183-8. [DOI] [PMC free article] [PubMed] [Google Scholar]
- Gentile A.; Amadoro G.; Corsetti V.; Ciotti M. T.; Serafino A.; Calissano P. Spontaneous Aggregation and Altered Intracellular Distribution of Endogenous α-Synuclein during Neuronal Apoptosis. J. Alzheimer’s Dis. 2008, 13, 151–160. 10.3233/jad-2008-13205. [DOI] [PubMed] [Google Scholar]
- de Oliveira G. A. P.; Silva J. L. Alpha-Synuclein Stepwise Aggregation Reveals Features of an Early Onset Mutation in Parkinson’s Disease. Commun. Biol. 2019, 2, 374. 10.1038/s42003-019-0598-9. [DOI] [PMC free article] [PubMed] [Google Scholar]
- Tcherkasskaya O.; Uversky V. N. Denatured Collapsed States in Protein Folding: Example of Apomyoglobin. Proteins: Struct., Funct., Genet. 2001, 44, 244–254. 10.1002/prot.1089. [DOI] [PubMed] [Google Scholar]
- Chan F. T. S.; Kaminski Schierle G. S.; Kumita J. R.; Bertoncini C. W.; Dobson C. M.; Kaminski C. F. Protein Amyloids Develop an Intrinsic Fluorescence Signature during Aggregation. Analyst 2013, 138, 2156–2162. 10.1039/c3an36798c. [DOI] [PMC free article] [PubMed] [Google Scholar]
- Sirangelo I.; Borriello M.; Irace G.; Iannuzzi C. Intrinsic Blue-Green Fluorescence in Amyloyd Fibrils. AIMS Biophys. 2018, 5, 155–165. 10.3934/biophy.2018.2.155. [DOI] [Google Scholar]
- Nilsson M. Techniques to Study Amyloid Fibril Formation in Vitro. Methods 2004, 34, 151–160. 10.1016/j.ymeth.2004.03.012. [DOI] [PubMed] [Google Scholar]
- Manning M. C.; Illangasekare M.; Woody R. W. Circular Dichroism Studies of Distorted α-Helices, Twisted β-Sheets, and β-Turns. Biophys. Chem. 1988, 31, 77–86. 10.1016/0301-4622(88)80011-5. [DOI] [PubMed] [Google Scholar]
- Iyer A.; Roeters S. J.; Kogan V.; Woutersen S.; Claessens M. M. A. E.; Subramaniam V. C-Terminal Truncated α-Synuclein Fibrils Contain Strongly Twisted β-Sheets. J. Am. Chem. Soc. 2017, 139, 15392–15400. 10.1021/jacs.7b07403. [DOI] [PMC free article] [PubMed] [Google Scholar]
- Bhopatkar A. A.; Uversky V. N.; Rangachari V.. Disorder and Cysteines in Proteins: A Design for Orchestration of Conformational See-Saw and Modulatory Functions. Progress in Molecular Biology and Translational Science, 1st ed.; Elsevier Inc., 2020; Vol. 174; pp 331–373. [DOI] [PMC free article] [PubMed] [Google Scholar]
- Marinelli P.; Navarro S.; Graña-Montes R.; Bañó-Polo M.; Fernández M. R.; Papaleo E.; Ventura S. A Single Cysteine Post-Translational Oxidation Suffices to Compromise Globular Proteins Kinetic Stability and Promote Amyloid Formation. Redox Biol. 2018, 14, 566–575. 10.1016/j.redox.2017.10.022. [DOI] [PMC free article] [PubMed] [Google Scholar]
- Miseta A.; Csutora P. Relationship between the Occurrence of Cysteine in Proteins and the Complexity of Organisms. Mol. Biol. Evol. 2000, 17, 1232–1239. 10.1093/oxfordjournals.molbev.a026406. [DOI] [PubMed] [Google Scholar]
- Chen G.-f.; Xu T.-h.; Yan Y.; Zhou Y.-r.; Jiang Y.; Melcher K.; Xu H. E. Amyloid Beta: Structure, Biology and Structure-Based Therapeutic Development. Acta Pharmacol. Sin. 2017, 38, 1205–1235. 10.1038/aps.2017.28. [DOI] [PMC free article] [PubMed] [Google Scholar]
- Xu S.; Brunden K. R.; Trojanowski J. Q.; Lee V. M.-Y. Characterization of Tau Fibrillization in Vitro. Alzheimer’s Dementia 2010, 6, 110–117. 10.1016/j.jalz.2009.06.002. [DOI] [PMC free article] [PubMed] [Google Scholar]
- Cohen T. J.; Guo J. L.; Hurtado D. E.; Kwong L. K.; Mills I. P.; Trojanowski J. Q.; Lee V. M. Y. The Acetylation of Tau Inhibits Its Function and Promotes Pathological Tau Aggregation. Nat. Commun. 2011, 2, 252. 10.1038/ncomms1255. [DOI] [PMC free article] [PubMed] [Google Scholar]
- Karikari T. K.; Nagel D. A.; Grainger A.; Clarke-Bland C.; Hill E. J.; Moffat K. G. Preparation of Stable Tau Oligomers for Cellular and Biochemical Studies. Anal. Biochem. 2019, 566, 67–74. 10.1016/j.ab.2018.10.013. [DOI] [PMC free article] [PubMed] [Google Scholar]
- Fardanesh A.; Zibaie S.; Shariati B.; Attar F.; Rouhollah F.; Akhtari K.; Shahpasand K.; Saboury A. A.; Falahati M. Amorphous Aggregation of Tau in the Presence of Titanium Dioxide Nanoparticles: Biophysical, Computational, and Cellular Studies. Int. J. Nanomed. 2019, 14, 901–911. 10.2147/ijn.s194658. [DOI] [PMC free article] [PubMed] [Google Scholar]
- Hiramatsu H.; Kobayashi K.; Kobayashi K.; Haraguchi T.; Ino Y.; Todo T.; Iba H. The Role of the SWI/SNF Chromatin Remodeling Complex in Maintaining the Stemness of Glioma Initiating Cells. Sci. Rep. 2017, 7, 889. 10.1038/s41598-017-00982-3. [DOI] [PMC free article] [PubMed] [Google Scholar]
- Gill S. C.; von Hippel P. H. Calculation of Protein Extinction Coefficients from Amino Acid Sequence Data. Anal. Biochem. 1989, 182, 319–326. 10.1016/0003-2697(89)90602-7. [DOI] [PubMed] [Google Scholar]
- Peng K.; Vucetic S.; Radivojac P.; Brown C. J.; Dunker A. K.; Obradovic Z. Optimizing Long Intrinsic Disorder Predictors With Protein Evolutionary Information. J. Bioinf. Comput. Biol. 2005, 3, 35–60. 10.1142/s0219720005000886. [DOI] [PubMed] [Google Scholar]
- Williams R. M.; Obradovi Z.; Mathura V.; Braun W.; Garner E. C.; Young J.; Takayama S.; Brown C. J.; Dunker A. K. The Protein Non-Folding Problem: Amino Acid Determinants of Intrinsic Order and Disorder. Pac. Symp. Biocomput. 2001, 2001, 89–100. 10.1142/9789814447362_0010. [DOI] [PubMed] [Google Scholar]
Associated Data
This section collects any data citations, data availability statements, or supplementary materials included in this article.