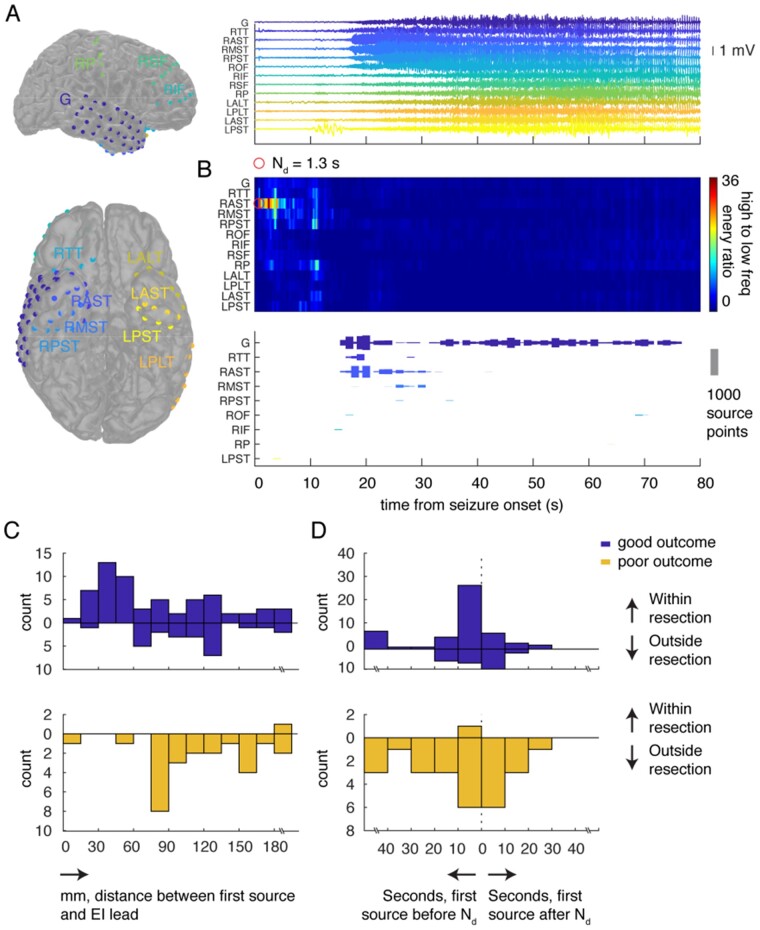
Figure 4.
The seizure source emerges from early high-frequency activity. (A) All electrodes in an example participant are colour-coded and labelled (left). We averaged the iEEG time series across all electrodes in each strip or grid during a single seizure (right). (B) The ratio of high- to low-frequency energy, averaged for each electrode in each strip or grid for this seizure, increases almost immediately after seizure onset in the anterior subtemporal electrodes, with a detection time Nd of 1.3 s (top). In the same seizure, we mapped the estimated location of the seizure source based on low-frequency phase differences to the closest electrode (bottom). Each bar represents the number of times the closest electrode to the estimated source location lay within each strip or grid at every second. (C) In every seizure in every participant, we identified the first second during which a source location could be estimated, and identified the region of interest containing the most estimated locations during that initial second. We binned the geodesic distances between the centres of the identified regions of interest and the location of the electrode exhibiting the highest EI. (D) For every seizure in every participant, we identified the electrode with the highest EI and its detection time, Nd. We computed the relative time between Nd and the first second during which a source location could be estimated based on the low frequency phase differences. We binned these time differences across all seizures in all participants. ALT = anterolateral temporal; AST = anterior subtemporal; G = grid; IF = inferior frontal; L = left; MST = middle subtemporal; OF = orbitofrontal; P = parietal; PLT = posterolateral temporal; PST = posterior subtemporal; R = right; SF = superior frontal; TT = temporal tip.

