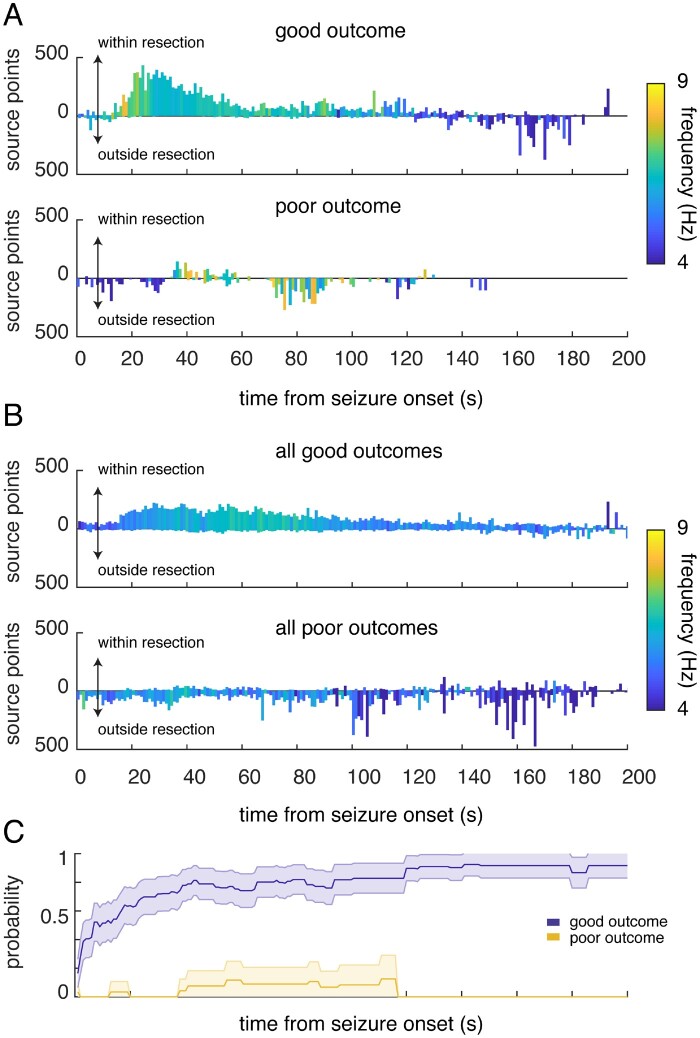
Figure 5.
The estimated seizure source localizes to the resection territory in participants with good outcome. (A) Source localization in an example participant with a good outcome (top) and a poor outcome (bottom). For every second and for every seizure, we counted the number of times any location in the brain was estimated to be the source of the emitted waves, and whether those estimated locations fell within or outside the resection territory. Bars represent the average counts per second across all seizures for each participant. The maximum count in any one second is 1000, given the sampling rate of the recorded iEEG trace. Bars are colour-coded by the frequency of the signal detected by the closest electrode to the estimated source at each time point, averaged across seizures. The frequency of the presumed source decreases with seizure progression. (B) Counts per second of the estimated locations that fall within and outside the resection territory, averaged across all seizures in each participant and then averaged across all participants with good outcomes (top) and with poor outcomes (bottom). Bars are colour-coded by the mean frequency detected by the closest electrode to the estimated source, averaged across seizures and then across participants. (C) As the seizure progresses in time, we identified the region of interest with the highest peak rate of localization thus far and whether that region of interest is within the resection territory. The likelihood (probability) that the identified region of interest with the highest peak thus far is within the resection territory is computed by aggregating this information across all seizures in each participant. Lines represent this probability, averaged across all participants with good and poor outcomes. Shaded regions represent the standard error of the mean (SEM) across participants.

