

See Silagi and Segal (doi:10.1093/brain/awab196) for a scientific commentary on this article.
The chemotherapy drug paclitaxel induces an increase in Nav1.7 channel expression in sensory neurons, enhancing their excitability. Akin et al. use live imaging to visualize trafficking and surface localization of Nav1.7 channels in sensory axons after exposure to paclitaxel, and reveal a role for inflammation in this process.
Keywords: paclitaxel, chemotherapy-induced peripheral neuropathy, Nav1.7, peripheral pain, live microscopy
Abstract
The microtubule-stabilizing chemotherapy drug paclitaxel (PTX) causes dose-limiting chemotherapy-induced peripheral neuropathy (CIPN), which is often accompanied by pain. Among the multifaceted effects of PTX is an increased expression of sodium channel Nav1.7 in rat and human sensory neurons, enhancing their excitability. However, the mechanisms underlying this increased Nav1.7 expression have not been explored, and the effects of PTX treatment on the dynamics of trafficking and localization of Nav1.7 channels in sensory axons have not been possible to investigate to date. In this study we used a recently developed live imaging approach that allows visualization of Nav1.7 surface channels and long-distance axonal vesicular transport in sensory neurons to fill this basic knowledge gap. We demonstrate concentration and time-dependent effects of PTX on vesicular trafficking and membrane localization of Nav1.7 in real-time in sensory axons. Low concentrations of PTX increase surface channel expression and vesicular flux (number of vesicles per axon). By contrast, treatment with a higher concentration of PTX decreases vesicular flux. Interestingly, vesicular velocity is increased for both concentrations of PTX. Treatment with PTX increased levels of endogenous Nav1.7 mRNA and current density in dorsal root ganglion neurons. However, the current produced by transfection of dorsal root ganglion neurons with Halo-tag Nav1.7 was not increased after exposure to PTX. Taken together, this suggests that the increased trafficking and surface localization of Halo-Nav1.7 that we observed by live imaging in transfected dorsal root ganglion neurons after treatment with PTX might be independent of an increased pool of Nav1.7 channels. After exposure to inflammatory mediators to mimic the inflammatory condition seen during chemotherapy, both Nav1.7 surface levels and vesicular transport are increased for both low and high concentrations of PTX. Overall, our results show that PTX treatment increases levels of functional endogenous Nav1.7 channels in dorsal root ganglion neurons and enhances trafficking and surface distribution of Nav1.7 in sensory axons, with outcomes that depend on the presence of an inflammatory milieu, providing a mechanistic explanation for increased excitability of primary afferents and pain in CIPN.
See Silagi and Segal (doi:10.1093/brain/awab196) for a scientific commentary on this article.
Introduction
Paclitaxel (PTX) is a chemotherapeutic agent commonly used for the treatment of multiple types of cancers including breast, ovary, and lung. Dose-limiting side effects include chemotherapy-induced peripheral neuropathy (CIPN), which is frequently accompanied by pain and sensory abnormalities that can impact patient quality of life or survival.1 PTX is a microtubule stabilizer that binds to the inner lumen of the microtubule, promoting microtubule polymerization and stabilizing against depolymerization.2 This is highly effective in preventing mitosis in proliferating cancer cells; however, it can have off-target effects on non-dividing cells, such as neurons, which lead to CIPN. The mechanisms underlying the development of CIPN and pain have remained elusive and are likely multifaceted. PTX causes multiple changes in neurons including mitochondrial dysfunction, calcium dysregulation, microtubule disruption, and alterations to the expression and function of ion channels.3 A better understanding of the underlying mechanisms of PTX-induced neuropathy and pain could provide a basis for treatments that mitigate these dose-limiting effects, allowing more effective use of PTX in treating cancers.
Human and rat dorsal root ganglion (DRG) neurons become hyperexcitable after treatment with PTX, due to increased expression of several types of ion channels,4,5 including the voltage-gated sodium (Nav) channel Nav1.7.6,7 Nav1.7 is an attractive target for understanding PTX-induced neuropathy and pain since it is a key driver of pain in humans: gain or loss-of-function mutations of Nav1.7 result in painful neuropathies or insensitivity to pain, respectively.8,9 However, studies on the effects of PTX on Nav1.7 expression levels and excitability of DRG neurons have been limited to the soma of these neurons and have not addressed underlying mechanisms such as temporal and spatial regulation of channel trafficking or surface distribution in sensory axons. Additionally, the PTX-induced increase in Nav1.7 at nerve endings6 must be reconciled with reported deficits in anterograde axonal trafficking, for example transport of mitochondria.3,10,11
Because of the role of Nav1.7 in human pain, including CIPN, and demonstrated upregulation in response to PTX treatment, there is a need for understanding axonal trafficking of this channel and alterations to its cell surface distribution in response to PTX. Examination of axonal trafficking and membrane localization of Nav channels in real-time has previously been hampered by the lack of tools to study dynamics of channel trafficking and membrane localization in live neurons. We recently developed novel fluorescently-tagged Nav1.7 constructs to enable visualization of Nav1.7 surface distribution and axonal trafficking in the axons of live cultured sensory neurons with high spatial and temporal resolution.12 Using these new methods, we demonstrated fast microtubule-based vesicular Nav1.7 transport in sensory axons, which was disrupted by treatment with the microtubule depolymerizing drug nocodazole.12 Thus, we would expect that PTX-induced changes to microtubules would impact Nav1.7 axonal transport. The new high resolution, real-time imaging techniques are ideally suited for investigation of the dynamic regulation of Nav1.7 channel distribution and trafficking in live sensory neurons in response to treatment with agents such as PTX.
In this study, using a tagged Halo-Nav1.7 construct and live imaging, we show that treatment with low levels of PTX increases the number of membrane inserted channels at sensory axonal terminals, as well as enhancing neuronal trafficking of vesicles carrying Nav1.7; conversely, higher concentrations of PTX result in axonal degeneration, less channel expression at distal axons, and impaired axonal trafficking. We also show that co-treatment with inflammatory mediators, which mimics the inflammatory milieu in peripheral nerves during chemotherapy, further increases surface expression and axonal transport of Nav1.7.
Materials and methods
DNA constructs
The parent plasmid that encodes human Nav1.7,which is rendered tetrodotoxin-resistant (TTX-R) by substituting amino acid Tyr362 with serine (Y362S) has been described previously.13 Cloning of the HaloTag in-frame at the N-terminus of the channel to produce Halo-Nav1.7 has been previously described and characterized.12
Primary rat DRG neuron culture and transfection
Animal studies followed a protocol approved by the Veterans Administration Connecticut Healthcare System Institutional Animal Care and Use Committee. DRG neurons were isolated from 0 to 5-day-old Sprague-Dawley rat pups and transfected with Halo-Nav1.7 as previously described,14 and is briefly described in the Supplementarymaterial.
Microfluidic chambers
Microfluidic chambers (MFCs) (DOC450, two-chamber 450 µm groove, Xona Microfluidics) were placed on 50 mm glass-bottomed dishes (P50G-1.55-30-F, MatTek). In preparation for the assembly of the MFCs, dishes were coated with 0.5 mg/ml poly-l-lysine overnight at 37°C, then the glass surface was washed twice with sterile double distilled water and air dried under the hood. The dishes were then coated with 10 mg/ml laminin for at least 2 h at 37°C, excess laminin was aspirated, and the dishes dried under the hood before MFCs were adhered. Transfected DRG neuron suspension was applied in the soma chamber and DRG medium supplemented with 50 ng/ml growth factors (NGF, GDNF from PeproTech) and 2× growth factors (100 ng/ml) was added to the axonal chamber. Media was changed to serum-free medium in both chambers after 24 h (NeurobasalTM medium supplemented with 2% B27, 1% penicillin/streptomycin, same 1:2 ratio of NGF, GDNF in soma and axonal chambers), and 1 μM uridine/5-fluoro-2-deoxyuridine was added to inhibit the growth of fibroblasts and glia. During the 5–7 days before imaging, volumes were kept slightly higher (∼50 µl) in the somatic chamber as recommended by the manufacturer to fluidically isolate the chambers and maintain the high concentration of growth factors in the axonal chamber.
Treatments
PTX was prepared in advance as a stock solution and diluted to a final concentration of either 25 nM or 250 nM PTX. Inflammatory mediator cocktail (IM)15 was prepared in advance as a stock solution and diluted to a final concentration containing (all from Sigma): bradykinin (1 µM), PGE-2 (10 µM), histamine (10 µM), 5-HT (10 µM) and ATP (15 µM). Stock solutions were stored in aliquots and frozen until use. Treatments were added to both the somatic and axonal chambers for 6, 24 or 48 h before imaging, as indicated. The appropriate volumes of stock solutions [dimethylsulphoxide (DMSO), PTX, and/or IM] were first mixed with a portion of the media removed from the culture dish or slide before mixing the dilution back into the original well, thus preventing exposure of the cells to high concentrations of the compounds.
Imaging system
Images were acquired using an Andor Dragonfly spinning disk confocal microscope built on a Nikon Eclipse Ti fluorescence microscope. Images were collected using an Andor iXon Ultra 888 EMCCD camera through either a 20× air objective or Plan Apo Lambda 60× (NA1.4) oil objective. The system includes an Andor Integrated Laser Engine containing 100 mW 405 nm, 150 mW 488 nm, 150 mW 561 nm, and 140 mW 637 nm solid state lasers. The Nikon Perfect-Focus system was used to maintain focus in the z-plane during time-lapse imaging.
Live cell imaging and surface labelling
All experiments were performed at 37°C using a stage incubator (Tokai Hit). Neurons were kept in DRG neuronal imaging saline (DRG-NIS) containing (in mM): 136 NaCl, 3 KCl, 1 MgSO4, 2.5 CaCl2, 0.15 NaH2PO4, 0.1 ascorbic acid, 20 HEPES, 8 dextrose, pH 7.35 with NaOH (adjusted to 320 mOsmol/l) during incubation and imaging. To surface label Halo-Nav1.7 channels, the culture media in the axonal chamber was removed by washing with NIS, then 100 nM cell-impermeable HaloTag-JF635i ligand (kind gift from Luke D. Lavis and Jonathan B. Grimm, Janelia Research Campus)16,17 was added for 20 min. Axons were washed three times with DRG-NIS, then imaged for up to 1 h after labelling. Analysis of axonal endings (Fig. 1) was performed on images acquired using the 20× objective. All other data were acquired using the 60× objective.
Figure 1.

Formation of retractions bulbs in cultured DRG neurons treated with PTX is concentration and time-dependent. DRG neurons expressing soluble enhanced green fluorescent protein (EGFP) to visualize axonal morphology were cultured in microfluidic chambers and treated with either DMSO (Cntrl), 25 nM PTX, or 250 nM PTX. (A) Example axon endings from the axonal chamber. Control axon endings generally had defined morphologies with protrusions or branches. Cultures treated with PTX showed some axons with bulbed endings (arrowheads), consistent with axonal degeneration. (B) Percentage of healthy versus bulbed axonal endings. Bulbed endings were seen more frequently with higher concentrations of PTX, as well as increasing over time of incubation. Number of axons for each condition is indicated in white text, from three independent cultures.
OPAL imaging
The optical pulse-chase axonal long-distance (OPAL) imaging technique12 was used to selectively label anterograde vesicles containing Halo-Nav1.7 during long-distance axonal transport, and is described in the Supplementarymaterial.
Image analysis
Axon degeneration was measured from three fields of view acquired using the 20× objective from each of three independent cultures. Axon endings were analysed from compressed confocal z-stacks and designated as either healthy or bulbed as previously described.11,18 Healthy axons had similar diameters between the axon shaft and the axon end, or showed branches and extensions. In contrast, bulbed axons were round or oval at the ending with a diameter greater than the axon shaft and did not show any branches or extensions.
To determine the amount of Halo-Nav1.7 on the axonal endings, fluorescence intensity was measured from z-stacks of surface labelled Halo-Nav1.7 on axon endings in the axonal chamber of the MFCs. A compressed z-stack was created in ImageJ by summing individual z-slices. A region of interest was drawn around the final 60 µm of the axon and the mean fluorescence intensity was background subtracted.
To analyse vesicular flux and velocity, kymographs were created from time-lapse image sequences using ImageJ and KymographClear19 and analysed using the automated kymograph analysis software KymoButler, which is based on deep learning.20 Time-lapse movies were loaded into ImageJ and the KymographClear toolset was used to create kymographs from sections of axons. Axons chosen for analysis were isolated away from other axons and had multiple clearly visible vesicles that moved through the region during the image sequence. Representative axons were chosen from each field of view. Vesicle tracks were automatically detected using Kymobutler, which provided velocities for each vesicle track and flux data for each axon. Average velocities included pauses and stops for each vesicle track. Vesicles were classified as stationary if they had an average velocity between −0.1 and 0.1 µm/s, retrograde vesicles had velocities <−0.1 µm/s, and anterograde vesicles had velocities >0.1 µm/s. Run length was determined as described by Lim et al.21 whereby the total length of clearly defined vesicle tracks on kymographs was measured, using only tracks that travelled across the x-axis of the kymograph, and the total number of stops and pauses were measured. A stop or pause was defined as multiple pixels showing a vertical line on the kymographs. Flux was defined by the number of forward moving vesicle tracks that passed the centre of the kymograph. Data were imported into Origin for statistical analysis.
Voltage-clamp recordings in DRG neurons
Nav1.7 currents were recorded from DRG neurons in voltage-clamp mode using an EPC-10 amplifier and the PatchMaster program (HEKA Elektronik, Holliston MA, USA) at room temperature (22–25°C). Details of the methods are provided in the Supplementarymaterial.
Real-time RT-PCR
RNA from DRG neurons in culture was extracted using the RNeasy® kit (Qiagen) according to the manufacturer’s protocol. Complementary DNA was generated from 100 to 200 ng of DRG RNA using Bio-Rad iScriptTM Reverse Transcription Supermix. The following Prime-PCR probe Bio-Rad assays were used: Actb (qRnoCIP0050804), Nav1.7 (qRnoCIP0023430). Samples of 10 µl PCR reactions were run in triplicate for each sample using the Bio-Rad CFX96 Touch System with the following thermal-cycling procedure; 95°C for 30 s followed by 40 cycles of 95°C for 15 s and 60°C for 30 s. Three independent cultures (biological replicates) were used for each condition. The relative quantity and normalized expression data were processed using Bio-Rad CFX Manager.
Image analysis and statistical analysis
Images were processed with ImageJ. For figures with multiple panels, matched panels were processed and contrasted identically. Statistical analysis was performed using Origin or Prism and specific tests are identified in the text. Data are presented as mean ± standard error unless otherwise stated, and statistical significance was considered at P < 0.05. All data represent three independent cultures (imaging and RT-PCR, and voltage-clamp recordings of endogenous Nav1.7 currents), and four cultures for voltage-clamp recordings of Halo-Nav1.7.
Data availability
All information necessary to evaluate the findings of the paper are included in the manuscript. Additional data can be provided from the authors upon request.
Results
Time and concentration-dependent effects of PTX on sensory neuron axons
Effects of PTX treatment have been shown to be time and concentration-dependent.3 For example, low concentrations of PTX promote neurite extension in cultured CNS neurons, while higher concentrations prevent neurite extension.22 In cultured DRG neurons, the degree of axon degradation increases with higher concentrations of PTX or incubation with PTX for longer periods.11 Therefore, we investigated the effects of multiple concentrations of PTX using a sensory neuronal culture system and optical methods that permit high resolution, real-time imaging of Nav1.7 channels. Importantly, we wanted to find PTX concentrations that do not cause acute axonal degradation so we could study the effects of PTX treatment on Nav1.7 axonal trafficking and surface distribution independent of axonal damage, so as to mimic conditions during early phases of treatment with PTX. Studies investigating the effects of PTX on cultured sensory neurons have used concentrations ranging from 10 nM to >2.5 µM.11,23 It is difficult to know what concentrations peripheral axons are exposed to in human patients, and further how this translates to cultured neurons with direct exposure to the drug. Human cancer patients have been reported to display peak concentrations reaching >4 µM,24 but steady state plasma concentrations drop to 21–860 nM over the 2–48 h following treatment.25 Based on this information and our desire to investigate neuronal axons prior to axonal degradation, we chose to treat axons with either 25 nM or 250 nM PTX. After treatment with PTX, rats show an accumulation of PTX both within their DRG where the neuronal cell bodies are located, as well as along the nerves.26 Thus, we chose to incubate both the neuronal cell bodies and axons with PTX to best mimic in vivo conditions.
DRG neurons from neonatal rats were cultured in MFCs with a microgrooved barrier that separates the soma and axon compartments, enabling better visualization of distal axon endings as previously described.12 DRG neurons were transfected with an EGFP plasmid to visualize axon morphology. Using spinning disk microscopy, we observed a dose and time-dependent formation of retraction bulbs in response to PTX treatment. Retraction bulbs have previously been described as markers of axonal degeneration,11,18 and were defined as axonal ends with round or oval enlargements with diameters greater than the axon. Healthy axon endings displayed visible protrusions including branches or filipodia. We found that treatment with 25 nM PTX causes minimal formation of retraction bulbs (Fig. 1A, orange arrows) over the course of 48 h (Fig. 1A), suggesting this is a sub-toxic concentration of PTX within this timeframe. By contrast, the frequency of bulbed axonal endings was greater for 250 nM PTX than for 25 nM PTX, showing increased axonal degeneration with increasing time (Fig. 1B).
Low PTX dose increases the amount of Nav1.7 at the surface of axonal endings
Because of its role as a threshold channel that regulates action potential firing in DRG neurons and as the underlying cause in multiple human pain disorders,27 an increase in the number of Nav1.7 channels at axonal endings of sensory neurons is expected to increase neuronal excitability. DRG neurons expressing Halo-Nav1.7 and soluble enhanced green fluorescent protein (EGFP) were cultured in MFCs. HaloTag is a self-labelling protein that forms a covalent bond with specific cognate ligands, which can be conjugated to fluorophores or other functional groups. We previously demonstrated that the Halo-Nav1.7 channel construct is suitable for live cell imaging.12 The extracellularly tagged channel Halo-Nav1.7 allows for visualization of channels inserted within the plasma membrane at axonal endings using cell-impermeable HaloTag fluorescent ligands (Fig. 2A). Neurons were treated with either vehicle (0.025% DMSO), 25 nM PTX, or 250 nM PTX for either 6, 24 or 48 h. Prior to imaging, the axonal chamber was labelled with cell-impermeable HaloTag-JaneliaFluor635i (JF635i) (Fig. 2B).
Figure 2.
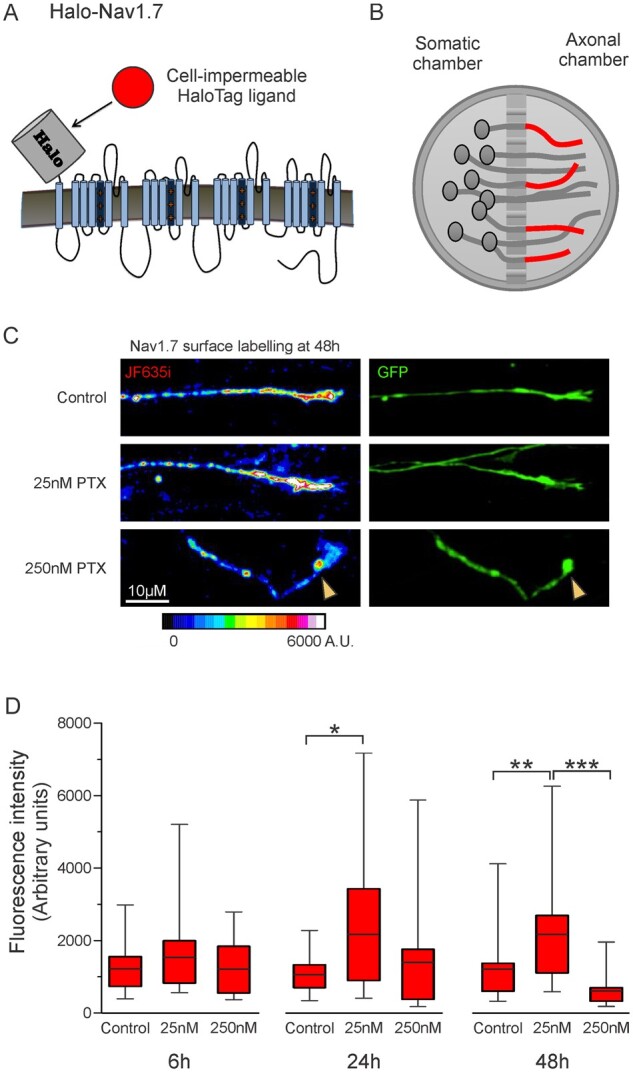
Increased membrane levels of Nav1.7 after 25 nM PTX treatment. DRG neurons expressing Halo-Nav1.7 and soluble EGFP were cultured in microfluidic chambers. (A) Schematic of Halo-Nav1.7. HaloTag was fused to an extra transmembrane segment such that channels inserted in the plasma membrane can be labelled using cell-impermeable fluorescently-conjugated HaloTag ligands. (B) Schematic of neurons cultured in microfluidic chambers where the cell bodies are plated within the somatic chamber and the axons extend through the microbarrier. For surface labelling of axonal endings (shown as red axons), cell-impermeable HaloTag ligand was added to the axonal chamber for 20 min, then excess label washed off. (C) Example axons demonstrating relative labelling of surface Halo-Nav1.7 by Halo-JF635i under different experimental conditions (left) and the EGFP shows axon morphology (right). Fluorescence intensity of the JF635i is shown by a graded scale with the greatest fluorescence intensity displayed as white and the lowest fluorescence intensity displayed as dark blue. (D) Quantification of Halo-Nav1.7 surface levels at axonal endings. Box plots of the mean fluorescence intensities of Halo-Nav1.7 in axons treated with 25 nM PTX are significantly greater than DMSO controls at 24 and 48 h. The horizontal line indicates the median, while the top and the bottom of the box indicate the 75th and 25th percentiles, respectively. The whiskers extend to the maximum and minimum values. Number of axons analysed (in order of control, 25 nM PTX, and 250 nM PTX): 31, 31, 19 (6 h); 21, 19, 13 (24 h), 25, 31, 18 (48 h). *P < 0.05, **P < 0.01. ***P < 0.001; one-way ANOVA with Bonferroni correction.
Figure 2C shows example axons from each treatment group at 48 h, with the pseudo-coloured images demonstrating surface labelled Nav1.7 channels and the EGFP signal showing axon morphology. The surface labelling for the axon treated with 25 nM PTX is much brighter than the DMSO control, representing increased numbers of surface Nav1.7 channels at the axonal ending. Conversely, the axon treated with 250 nM PTX has less surface labelling and its morphology shows a retraction bulb, as is characteristic of degenerating axons. When examined over time, neurons treated with 25 nM PTX showed an increase in mean fluorescence intensity compared to the DMSO control at all time points, with statistically significant increases at 24 and 48 h (Fig. 2D and SupplementaryTable1). This increase was not observed when neurons were treated with 250 nM PTX, and at 48 h axons treated with 250 nM PTX were significantly dimmer than axons treated with 25 nM PTX.
Nav1.7 channel transport is altered after treatment with PTX
Alterations in channel delivery to the plasma membrane at axonal endings could underlie changes in surface expression of Nav1.7. To test the hypothesis that PTX treatment alters Nav1.7 trafficking to distal axons, we used an imaging technique recently developed in our laboratory, OPAL imaging,12 that enables visualization of vesicular transport of Nav1.7 channels with single molecule sensitivity (Fig. 3A). This technique allows imaging of live axonal transport of low abundance proteins that are difficult to image using traditional microscopy methods. For this technique, Halo-Nav1.7 expressing neurons cultured in MFCs are incubated with cell-permeable HaloTag-JaneliaFluor549 only within the somatic chamber. Vesicles carrying Halo-Nav1.7 from the somatic chamber into the axonal chamber carry the labelled channels, allowing selective visualization of anterograde Halo-Nav1.7 vesicles with minimal background when imaging the axonal chamber. OPAL imaging substantially enhances the signal/noise ratio, which permits observation of vesicles carrying a relatively small number of labelled channels.
Figure 3.

Vesicular trafficking of Halo-Nav1.7 containing vesicles is altered after PTX treatment. (A) Schematic depicting the OPAL imaging technique used to visualize vesicular trafficking. DRG neurons expressing Halo-Nav1.7 were cultured in MFCs for 5–7 days. Cell-permeable JF635i-HaloTag ligand was added to the soma chamber for 15 min, then anterogradely moving vesicles in the axonal chamber were imaged using spinning disk confocal microscopy. (B) Example kymographs of line scans along axons from cultures treated for 48 h. Vesicle movement is displayed as position (x-axis) over time (y-axis). (C) Quantification of vesicular flux (number of vesicles passing along each axon per minute). Number of axons analysed (in order of control, 25 nM PTX, 250 nM PTX): 39, 34, 28 (6 h), 24, 22, 16 (24 h), 39, 30, 7 (48 h). (D) Quantification of anterograde vesicular velocity. Vesicle were considered anterograde if they had a velocity >0.1 µm/s. Number of vesicles analysed (in order of control, 25 nM PTX, 250 nM PTX): 627, 566, 516 (6 h), 306, 250, 121) (24 h), 438, 502, 68 (48 h). The horizontal line indicates the median, while the top and the bottom of the box indicate the 75th and 25th percentiles, respectively. The whiskers extend to the maximum and minimum values. *P < 0.05, **P < 0.01. ***P < 0.001; one-way ANOVA with Bonferroni correction.
Figure 3B shows example kymographs depicting time-lapse imaging of axons with Halo-Nav1.7 containing vesicles (SupplementaryVideo1). We observed that cultures incubated with 25 nM PTX had more anterogradely moving vesicles per axon (flux) than control axons at all time points (Fig. 3C and SupplementaryTable2). Conversely, cultures exposed to 250 nM PTX showed similar numbers of vesicles at 6 h, but had decreased flux at 24 and 48 h. We next measured the velocity of anterograde vesicles and found that incubation with either 25 nM or 250 nM PTX caused an increase in average anterograde vesicular velocity, even within 6 h (Fig. 3D and SupplementaryTable3). The exception was for 250 nM PTX at 24 h, which trended towards faster vesicles compared to controls, but this did not reach statistical significance. Together, these data suggest that the number of vesicles travelling along each axon is sensitive to PTX concentrations, while vesicular speed is much less concentration-dependent. Although OPAL imaging enhances visualization of anterograde vesicles, a small number of stationary and retrograde-moving vesicles can be visualized. The distribution of vesicle velocities for all tracks, including stationary and retrograde tracks are shown in SupplementaryFig.1 and the percentage of vesicles for each direction is shown in SupplementaryFig.2. To investigate the vesicle behaviours that contributed to differences in vesicle velocities, we determined the average distance each particle travelled before pausing or stopping (run length) under each condition. We used the method of Lim et al.,21 whereby we summed the total distance travelled for all clearly visible vesicles that travelled the full distance (x-axis) of each kymograph and then divided this distance by the number of stops and pauses observed. We found that the run length trended longer for all the conditions with PTX treatment compared to control conditions [In order of control, 25 nM PTX, 250 nM PTX (in µM): 18.41, 27.17, 32.18 (6 h), 20.84, 24.35, 23.67 (24 h), 16.40, 29.81, 25.14 (48 h)] (SupplementaryTable4).
Next, we assessed the effects of PTX treatment on the expression levels of endogenous Nav1.7 channels as well as the current density in DRG neurons transfected with the Halo-Nav1.7 channels. Exposure of DRG neurons to 25 nM PTX for 24 h resulted in a 1.43-fold increase in endogenous Nav1.7 mRNA as determined by real-time PCR, normalizing the expression levels of Nav1.7 by that of actin (DMSO: 1.03 ± 0.05 a.u.; PTX 1.43 ± 0.08 a.u., P = 0.0002, Studen’s t-test). In parallel experiments using voltage-clamp recordings we found that the ProTx-II-sensitive Nav1.7 current density from PTX-treated DRG neurons was significantly larger than that from DMSO-treated neurons (Fig. 4A); (DMSO: 126.33 ± 12.06 pA/pF, n = 7; PTX: 237.26 ± 31.36 pA/pF, n = 8, Student’s t-test P = 0.008). By contrast, Halo-Nav1.7 current density (TTX-R and ProTx-II-sensitive) in transfected DRG neurons were unaltered by PTX treatment (Fig. 4B); (DMSO: 197.18 ± 60.00 pA/pF, n = 7; PTX: 200.13 ± 27.75 pA/pF, n = 9, Student’s t-test P = 0.96).
Figure 4.
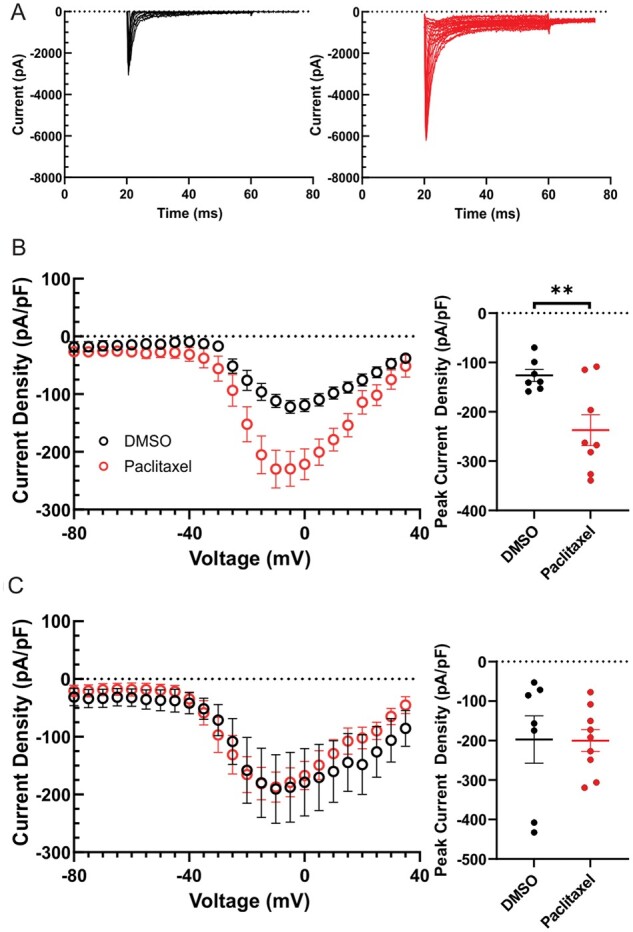
Currents produced by endogenous Nav1.7 but not Halo-Nav1.7 channels increases following treatment with PTX. (A) Family of somatic endogenous Nav1.7 current traces evoked by 40 ms depolarizing voltage steps from −80 mV to +10 mV in 5 mV increments from a holding potential of −100 mV. Representative smoothed (10 points averaged) ProTx-II sensitive Nav1.7 traces from rat DRG neurons treated with DMSO control (black) and 25 nM PTX (red) neurons are displayed. Traces illustrate the current evoked during the test-pulse and omit the response from the pre-pulse stimulus to inactivate axonal Nav currents. (B) Comparison of peak endogenous Nav1.7 current between control (black) and PTX treated conditions (red). (C) Comparison of peak Halo-Nav1.7 current (TTX-R and ProTX-II sensitive) between control (black) and PTX treated conditions (red). Nav1.7 current density was measured by normalizing maximal peak currents with cell capacitance. Scatter plots showing current density of endogenous Nav1.7 current (B) and Halo-Nav1.7 (C); mean and standard error of the mean (SEM) are indicated.
Inflammatory mediators further increase surface labelling and vesicular trafficking of Nav1.7 at axonal endings
Chemotherapy using PTX can also produce nerve inflammation.28,29 Our results thus far showing increased surface labelling and enhanced vesicular trafficking in response to exposure to PTX are similar to previous results12 showing that treatment with IMs increases the presence of Nav1.7 channels in the plasma membrane of axonal endings and increases vesicle flux and velocity, thus we investigated the effects of both PTX and an inflammatory milieu on Nav1.7 trafficking in sensory axons. Since differential surface levels and vesicular trafficking were seen for 25 nM versus 250 nM PTX at 24 h, we investigated the influence of co-treatment with IM on Nav1.7 trafficking at this time point.
Neurons were co-treated with or without IM and either DMSO, 25 nM PTX, or 250 nM PTX for 24 h and Halo-Nav1.7 was labelled with cell-impermeable JF635i-HaloTag ligand as before. Figure 5A shows example axon endings from cultures exposed to vehicle or 25 nM PTX, with or without co-treatment with IM. An increase in mean fluorescence intensity of Nav1.7 surface labelling in axons treated with IM was seen for all conditions (DMSO, 25 nM PTX, 250 nM PTX) compared to axons not receiving IM (Fig. 5B and SupplementaryTable5).
Figure 5.

Membrane levels of Halo-Nav1.7 at axonal endings treated with PTX are increased with treatment with IM. DRG neurons were transfected with Halo-Nav1.7 and cultured in MFCs and treated with DMSO, 25 nM PTX, or 250 nM PTX alone, or co-treated with IM for 24 h. Channels in the plasma membrane were labelled using cell-impermeable JF635i-HaloTag ligand. (A) Example axons showing surface labelling and axon morphology at axonal endings. Fluorescence intensity of the JF635i is shown by a graded scale with the greatest fluorescence intensity displayed as white and the lowest fluorescence intensity displayed as dark blue. (B) Quantification of the mean fluorescent signal of the distal 60 µm at axonal endings. The horizonal line indicates the median, while the top and the bottom of the box indicate the 75th and 25th percentiles, respectively. The whiskers extend to the maximum and minimum values. Number of axons analysed (in order of control, 25 nM PTX, and 250 nM PTX): 21, 19, 13 (no IM); 25, 26, 16 (+IM). *P < 0.05, **P < 0.01. ***P < 0.001; Student’s t-test or Mann-Whitney U-test.
We previously demonstrated that in addition to increased surface expression, treatment with inflammatory mediators enhances vesicular trafficking.12 Thus, we used OPAL imaging to investigate axonal transport for cultures treated with both PTX and IM. Figure 6A shows example kymographs representing vesicular trafficking of axons from cultures treated with 25 nM PTX, with or without IM for 24 h (SupplementaryVideo2). The number of vesicles per axon (flux) and vesicle velocities were measured. Compared to axons not treated with IM, all conditions showed an increase in vesicular flux when treated with IM (Fig. 6B and SupplementaryTable6). Vesicle velocities were also increased for all conditions (Fig. 6C and SupplementaryTable7).
Figure 6.

The velocity and flux of Halo-Nav1.7 vesicles treated with PTX are increased with treatment by IM. DRG neurons were transfected with Halo-Nav1.7 and cultured in MFCs and treated with DMSO, 25 nM PTX, or 250 nM PTX alone, or co-treated with IM for 24 h. OPAL imaging was used to visualize axonal transport of Halo-Nav1.7 containing vesicles. (A) Example kymographs of axons treated for 24 h with 25 nM PTX, either with or without addition of IM. (B) Quantification of anterograde vesicular flux. The horizontal line indicates the median, while the top and the bottom of the box indicate the 75th and 25th percentiles, respectively. The whiskers extend to the maximum and minimum values. Number of axons analysed (in order of control, 25 nM PTX, and 250 nM PTX): 24, 23, 16 (no IM); 24, 21, 10 (+IM). (C) Quantification of vesicular velocity. Number of vesicles analysed (in order of control, 25 nM PTX, and 250 nM PTX): 306, 386, 121 (no IM); 567, 506, 167 (+IM). *P < 0.05, **P < 0.01. ***P < 0.001; Student’s t-test or Mann-Whitney U-test.
Discussion
PTX-related neuropathies most often and most severely affect the extremities that are innervated by DRG neurons with the longest axons. This has led to a focus on the effects of PTX on axonal transport, which may be most apparent in the longest axons. Studies have shown that PTX impairs axonal trafficking,10 although it is unclear whether this is a cause or a result of axonal degradation.11 This reported loss of anterograde trafficking10 needed to be reconciled with the upregulation of proexcitatory ion channels including Nav1.7 at axonal endings in animals treated with PTX. Using high-resolution live imaging in sensory axons, we found that the effects of PTX are time and concentration-dependent. At low concentrations (25 nM PTX), we found increased levels of Nav1.7 at the surface in distal axons at 24 and 48 h, which is accompanied by an enhancement of vesicular trafficking with increases in both the flux and velocity of Nav1.7-containing vesicles. Using a higher concentration (250 nM PTX) we did not observe a change in surface expression relative to the DMSO control, but saw a decrease in the number of vesicles per axon. Treatment of DRG neurons with PTX increased endogenous Nav1.7 mRNA levels and current density. However, the current produced by transfection of DRG neurons with Halo-Nav1.7 was not increased after exposure to PTX. We also found that mimicking PTX-induced tissue inflammation28,29 in our culture with an IM cocktail augments the effects of PTX on surface levels and vesicular trafficking of Nav1.7.
To investigate the dynamic regulation of channel trafficking in sensory axons treated with PTX, we used full-length Nav1.7 constructs and live cell imaging to assess the effect of this treatment on surface expression and vesicular trafficking of Nav1.7. High-resolution imaging of channel trafficking after exposure to PTX requires study of cells in culture, because it is currently not technically feasible to obtain sufficient signal-to-noise ratio for live imaging of channels in in vivo preparations. Neuronal cell cultures for the study of CIPN have been widely used and allow a highly controlled environment whereby specific effects can be studied quickly and efficiently.30 Our studies used in vitro assessment of DRG neurons from young animals, which were required for transfecting and imaging full-length Nav channels and maintaining these transfected cultures for several days. Ideally, future studies can utilize human induced pluripotent stem cells (iPSCs) to provide a model that can better simulate human disease.
In vitro studies of PTX have used a wide variety of concentrations, ranging from 10 nM to >2.5 µM. Human cancer patients have peak concentrations reaching >4 µM,24 but steady-state plasma concentrations drop to 21–860 nM over the 2–48 h following treatment,25 suggesting that submicromolar concentrations may be best to model CIPN. Furthermore, neurons studied in a dish have more immediate exposure to PTX than axons embedded in tissues, suggesting lower concentrations of PTX may be most applicable for in vitro studies. It is also important to note that different compartments of DRG neurons can be exposed to different concentrations of PTX. A study of rats treated with PTX over 6 days showed higher concentrations within the DRG, compared to the dorsal and ventral roots and the sciatic nerve.26 Thus, studies of multiple concentrations of PTX as done here might mimic temporal and spatial effects of the drug on sensory neurons.
In several cell types, lower concentrations of PTX can promote the formation of growth cones and regeneration of axons, while higher concentrations of PTX can be damaging.22 This is consistent with our observation of apparently normal axonal morphology in cultures treated with 25 nM PTX, while axons with end bulbs are evident in cultures treated with 250 nM PTX, indicative of axonal degeneration. Furthermore, axonal trafficking of Nav1.7 is promoted by exposure to 25 nM PTX, while it is inhibited by the higher concentration of 250 nM. The underlying mechanisms for the observed differential effects on Nav1.7 trafficking remain speculative at this time. Low levels of PTX cause modest microtubule stabilization, while higher concentrations of PTX increase the number of microtubules and cause microtubule bundling.31 One hypothesis is that different concentrations of PTX interact with microtubule-based kinesin motors differently; PTX binds to the inner lumen of microtubules where it would not sterically interfere with kinesin transport. Indeed, purified microtubules are commonly stabilized using PTX for in vitro assays of motor proteins.32 However, PTX can affect the post-translational modifications of tubulin, or the compliment of microtubule associated proteins (MAPs).33,34 These modifications can interfere with the affinity of kinesin motors for microtubules, or their ability to navigate the microtubules.35,36 Thus, it is possible that low concentrations of PTX, through microtubule stabilization and modification, enable some kinesin-based axonal transport while higher concentrations can disrupt it.
Most studies have reported impaired, rather than enhanced axonal transport after PTX treatment. However, many used micromolar concentrations of PTX where signs of axonal degeneration were also observed.10 Using isolated squid axoplasm, a decrease in transport velocity was observed for kinesin-1, but not dynein, after 50 min of incubation with 10 µM PTX.37 Another study with cultured mouse DRG axons showed decreased anterograde velocities of mitochondria after exposure to 25 nM PTX for 1 day, or 2.5 µM PTX for 6–9 h.11 Our observations of increased vesicle velocities after incubation with similar PTX concentrations suggest that transport of organelles and transport of vesicles may be differentially altered in response to PTX treatment. This could be due to the involvement of molecular motors that have different sensitivities to alterations in microtubule stability or post-translational modifications. The observed changes in mitochondrial transport11 treated with a wide range of concentrations of PTX (25 nM to 2.5 µM) did not correlate well with the axonal degeneration. Our data show that Nav1.7 is transported to distal axons even in the context of axonal degeneration (presence of bulbed axonal ends), especially in the presence of inflammatory mediators, the clinically relevant condition in chemotherapy.
The use of the OPAL imaging technique to observe Nav1.7-containing vesicles with single-molecule resolution12 enabled the first real-time, live cell visualization of altered ion channel trafficking after exposure to PTX. This technique capitalizes on the labelling of channels in the somatic chamber and imaging the transported channels in the axonal chamber, which preferentially captures anterograde moving vesicles. We observed enhanced anterograde trafficking under conditions that also demonstrated increased surface levels of Nav1.7 at axonal endings, which suggested that this increased trafficking is linked to the increased surface expression. However, these experiments do not rule out the contributions of decreased retrograde trafficking or altered surface stability of membrane-inserted Nav1.7 at axonal endings. Alternate labelling and imaging paradigms will need to be used to address retrograde trafficking and protein turnover at axonal endings.
Our results suggest that DRG neurons regulate Nav1.7 expression on multiple levels in response to PTX. Treatment with 25 nM PTX increased mRNA levels and current density of endogenous Nav1.7 in DRG neurons, which is consistent with a previous report.6 Our data, together with the increased protein levels of Nav1.7 shown in Li et al.,6 suggest that increased Nav1.7 protein after PTX treatment contributes to increased somatic surface levels of Nav1.7. In contrast to the endogenous Nav1.7 current, PTX treatment did not increase the current density produced by transfecting DRG neurons with the Halo-Nav1.7 channels. Although the reasons for this difference in the response of endogenous and Halo-Nav1.7 channels are not well understood, we interpret our data to suggest that the increased axonal vesicular trafficking and surface channels that we observed by live imaging for Halo-Nav1.7 might be independent of increased overall protein levels of the channel. Further experiments will be needed to fully determine the contributions of transcription, translation, trafficking, and protein turnover of Nav1.7 to the PTX-induced pathology in vivo.
PTX-induced peripheral neuropathy has been shown to involve the activity of several additional ion channels including T-type voltage-gated calcium channels and transient receptor potential channels TRPV1, TRPA1 and TRPV4.5,38-40 It is probable that these and other ion channels, including other Nav1 isoforms, would also show similar enhanced anterograde trafficking and increased surface levels at axon endings. We previously demonstrated that Nav1.7 is transported in Rab6A-containing vesicles12 and future studies will determine whether other Nav1 isoforms or other ion channels would be transported in overlapping or distinct vesicle populations and whether they would be differentially regulated by PTX.
PTX has been shown to trigger inflammation in patients receiving PTX.28,29,41–44 To make the culture system more clinically relevant, we mimicked the inflammatory milieu in the peripheral nerves in patients receiving PTX by treating the cultures with an IM cocktail.15 Thus, while cultured neurons have limitations because this model does not recapitulate the complex cellular interactions of the in vivo environment, our studies nevertheless provide an unprecedented view of the dynamic regulation of channel trafficking and surface expression of Nav1.7 under conditions that recapitulate multiple aspects of CIPN. We demonstrate here that IM can cause an increase in surface levels of Nav1.7 and vesicular trafficking above and beyond the modifications observed for PTX treatment alone. The experiments presented here are not able to determine whether the increased trafficking and surface expression seen for PTX and IM are due to overlapping pathways. However, these data provide insight into how axons respond to the combination of PTX and inflammation, which occurs in human patients. Additionally, this suggests that some of the off-target effects of PTX chemotherapy treatment may not be due directly to modifications of microtubules, but additionally are the effect of the accompanying inflammatory response, which may exacerbate the direct effects of the chemotherapeutic agents on neurons.
There is a pressing need for a better understanding of CIPN associated with agents such as PTX. We have shown in this study that vesicular flux and velocity in distal axons are significantly increased upon treatment with 25 nM PTX. These data may reflect an early effect of the treatment when the cumulative dose is still relatively low. The accumulation of the Nav1.7 channels at the surface of distal axons during the early phase of treatment may contribute to the spontaneous activity of nociceptors that has been previously reported.6 Even in the event of distal axon degeneration, the increased surface levels of Nav1.7 channels may continue to support ectopic firing, leading to pain and paraesthesias that are associated with PTX treatment, analogous to the proposed role of this channel in spontaneous firing within painful neuromas.45,46 These data suggest that when determining dosing regimens for chemotherapy treatments, it is important to identify both peak plasma levels, as well as steady state levels of PTX. Our data also suggest that both the concentrations of PTX as well as the inflammatory response need to be addressed when considering treatments for CIPN. Together with the elevated levels of Nav1.7 transcripts and protein that have been demonstrated in human and rodent DRG soma treated with PTX shown here and in the literature,6 our data demonstrate a previously undescribed phenomenon of enhanced trafficking of Nav1.7 to distal axons driven by both the direct effects of PTX and the chemotherapy-induced inflammatory response.
Funding
This work was supported by Merit Review Awards B9253-C and NURP-001-19F from the U.S. Dept. of Veterans Affairs Rehabilitation Research and Development Service and Biomedical Laboratory Research and Development Service, respectively, and by a grant from the Thomson Family Foundation Initiative (S.D.H. and S.G.W.). E.J.A. is supported by Grant #3176 from the Paralyzed Veterans of America Research Foundation. M. A. and G.P.H. are supported by National Institute of Health/National Institute of General Medical Sciences Medical Scientist Training Program T32GM007205. The Center for Neuroscience and Regeneration Research is a Collaboration of the Paralyzed Veterans of America with Yale University.
Competing interests
The authors report no competing interests.
Supplementary material
Supplementary material is available at Brain online.
Supplementary Material
Glossary
- CIPN
chemotherapy-induced peripheral neuropathy
- DRG
dorsal root ganglion
- IM
inflammatory mediator cocktail
- MFC
microfluidic chamber
- OPAL
optical pulse-chase axonal long-distance
- PTX
paclitaxel
References
- 1. Flatters SJL, Dougherty PM, Colvin LA.. Clinical and preclinical perspectives on chemotherapy-induced peripheral neuropathy (CIPN): A narrative review. Br J Anaesth. 2017;119(4):737–749. [DOI] [PubMed] [Google Scholar]
- 2. Gornstein E, Schwarz TL.. The paradox of paclitaxel neurotoxicity: Mechanisms and unanswered questions. Neuropharmacology. 2014;76 Pt A:175–183. [DOI] [PubMed] [Google Scholar]
- 3. Staff NP, Fehrenbacher JC, Caillaud M, Damaj MI, Segal RA, Rieger S.. Pathogenesis of paclitaxel-induced peripheral neuropathy: A current review of in vitro and in vivo findings using rodent and human model systems. Exp Neurol. 2020;324:113121. [DOI] [PMC free article] [PubMed] [Google Scholar]
- 4. Zhang H, Dougherty PM.. Enhanced excitability of primary sensory neurons and altered gene expression of neuronal ion channels in dorsal root ganglion in paclitaxel-induced peripheral neuropathy. Anesthesiology. 2014;120(6):1463–1475. [DOI] [PMC free article] [PubMed] [Google Scholar]
- 5. Li Y, Tatsui CE, Rhines LD, et al. Dorsal root ganglion neurons become hyperexcitable and increase expression of voltage-gated T-type calcium channels (Cav3.2) in paclitaxel-induced peripheral neuropathy. Pain. 2017;158(3):417–429. [DOI] [PMC free article] [PubMed] [Google Scholar]
- 6. Li Y, North RY, Rhines LD, et al. DRG voltage-gated sodium channel 1.7 is upregulated in paclitaxel-induced neuropathy in rats and in humans with neuropathic pain. J Neurosci. 2018;38(5):1124–1136. [DOI] [PMC free article] [PubMed] [Google Scholar]
- 7. Xia Z, Xiao Y, Wu Y, Zhao B.. Sodium channel Nav1.7 expression is upregulated in the dorsal root ganglia in a rat model of paclitaxel-induced peripheral neuropathy. Springerplus. 2016;5(1):1738. [DOI] [PMC free article] [PubMed] [Google Scholar]
- 8. Dib-Hajj SD, Waxman SG.. Sodium channels in human pain disorders: Genetics and pharmacogenomics. Annu Rev Neurosci. 2019;42:87–106. [DOI] [PubMed] [Google Scholar]
- 9. Bennett DL, Clark AJ, Huang J, Waxman SG, Dib-Hajj SD.. The role of voltage-gated sodium channels in pain signaling. Physiol Rev. 2019;99(2):1079–1151. [DOI] [PubMed] [Google Scholar]
- 10. Theiss C, Meller K.. Taxol impairs anterograde axonal transport of microinjected horseradish peroxidase in dorsal root ganglia neurons in vitro. Cell Tissue Res. 2000;299(2):213–224. [DOI] [PubMed] [Google Scholar]
- 11. Gornstein EL, Schwarz TL.. Neurotoxic mechanisms of paclitaxel are local to the distal axon and independent of transport defects. Exp Neurol. 2017;288:153–166. [DOI] [PMC free article] [PubMed] [Google Scholar]
- 12. Akin EJ, Higerd GP, Mis MA, et al. Building sensory axons: Delivery and distribution of NaV1.7 channels and effects of inflammatory mediators. Sci Adv. 2019;5(10):eaax4755. [DOI] [PMC free article] [PubMed] [Google Scholar]
- 13. Herzog RI, Cummins TR, Ghassemi F, Dib-Hajj SD, Waxman SG.. Distinct repriming and closed-state inactivation kinetics of Nav1.6 and Nav1.7 sodium channels in mouse spinal sensory neurons. J Physiol. 2003;551(Pt 3):741–750. [DOI] [PMC free article] [PubMed] [Google Scholar]
- 14. Dib-Hajj SD, Choi JS, Macala LJ, et al. Transfection of rat or mouse neurons by biolistics or electroporation. Nat Protoc. 2009;4(8):1118–1126. [DOI] [PubMed] [Google Scholar]
- 15. Hockley JR, Boundouki G, Cibert-Goton V, et al. Multiple roles for NaV1.9 in the activation of visceral afferents by noxious inflammatory, mechanical, and human disease-derived stimuli. Pain. 2014;155(10):1962–1975. [DOI] [PMC free article] [PubMed] [Google Scholar]
- 16. Grimm JB, English BP, Chen J, et al. A general method to improve fluorophores for live-cell and single-molecule microscopy. Nat Methods. 2015;12(3):244–250, 3P following 250. [DOI] [PMC free article] [PubMed] [Google Scholar]
- 17. Jonker CTH, Deo C, Zager PJ, et al. Accurate measurement of fast endocytic recycling kinetics in real time. J Cell Sci. 2020;133(2):jcs231225. [DOI] [PMC free article] [PubMed] [Google Scholar]
- 18. Erturk A, Hellal F, Enes J, Bradke F.. Disorganized microtubules underlie the formation of retraction bulbs and the failure of axonal regeneration. J Neurosci. 2007;27(34):9169–9180. [DOI] [PMC free article] [PubMed] [Google Scholar]
- 19. Mangeol P, Prevo B, Peterman EJ.. KymographClear and KymographDirect: Two tools for the automated quantitative analysis of molecular and cellular dynamics using kymographs. Mol Biol Cell. 2016;27(12):1948–1957. [DOI] [PMC free article] [PubMed] [Google Scholar]
- 20. Jakobs MA, Dimitracopoulos A, Franze K.. KymoButler, a deep learning software for automated kymograph analysis. Elife. 2019;8:e42288. [DOI] [PMC free article] [PubMed] [Google Scholar]
- 21. Lim A, Rechtsteiner A, Saxton WM.. Two kinesins drive anterograde neuropeptide transport. Mol Biol Cell. 2017;28(24):3542–3553. [DOI] [PMC free article] [PubMed] [Google Scholar]
- 22. Sengottuvel V, Leibinger M, Pfreimer M, Andreadaki A, Fischer D.. Taxol facilitates axon regeneration in the mature CNS. J Neurosci. 2011;31(7):2688–2699. [DOI] [PMC free article] [PubMed] [Google Scholar]
- 23. Pease-Raissi SE, Pazyra-Murphy MF, Li Y, et al. Paclitaxel reduces axonal Bclw to initiate IP3R1-dependent axon degeneration. Neuron. 2017;96(2):373–386.e6. [DOI] [PMC free article] [PubMed] [Google Scholar]
- 24. Huizing MT, Keung AC, Rosing H, et al. Pharmacokinetics of paclitaxel and metabolites in a randomized comparative study in platinum-pretreated ovarian cancer patients. J Clin Oncol. 1993;11(11):2127–2135. [DOI] [PubMed] [Google Scholar]
- 25. Andersen A, Warren DJ, Brunsvig PF, Aamdal S, Kristensen GB, Olsen H.. High sensitivity assays for docetaxel and paclitaxel in plasma using solid-phase extraction and high-performance liquid chromatography with UV detection. BMC Clin Pharmacol. 2006;6:2. [DOI] [PMC free article] [PubMed] [Google Scholar]
- 26. Xiao WH, Zheng H, Zheng FY, Nuydens R, Meert TF, Bennett GJ.. Mitochondrial abnormality in sensory, but not motor, axons in paclitaxel-evoked painful peripheral neuropathy in the rat. Neuroscience. 2011;199:461–469. [DOI] [PMC free article] [PubMed] [Google Scholar]
- 27. Dib-Hajj SD, Yang Y, Black JA, Waxman SG.. The Na(V)1.7 sodium channel: From molecule to man. Nat Rev Neurosci. 2013;14(1):49–62. [DOI] [PubMed] [Google Scholar]
- 28. Zaks-Zilberman M, Zaks TZ, Vogel SN.. Induction of proinflammatory and chemokine genes by lipopolysaccharide and paclitaxel (Taxol) in murine and human breast cancer cell lines. Cytokine. 2001;15(3):156–165. [DOI] [PubMed] [Google Scholar]
- 29. Zhang H, Li Y, de Carvalho-Barbosa M, et al. Dorsal root ganglion infiltration by macrophages contributes to paclitaxel chemotherapy-induced peripheral neuropathy. J Pain. 2016;17(7):775–786. [DOI] [PMC free article] [PubMed] [Google Scholar]
- 30. Lehmann HC, Staff NP, Hoke A.. Modeling chemotherapy induced peripheral neuropathy (CIPN) in vitro: Prospects and limitations. Exp Neurol. 2020;326:113140. [DOI] [PMC free article] [PubMed] [Google Scholar]
- 31. Yvon AM, Wadsworth P, Jordan MA.. Taxol suppresses dynamics of individual microtubules in living human tumor cells. Mol Biol Cell. 1999;10(4):947–959. [DOI] [PMC free article] [PubMed] [Google Scholar]
- 32. Stern JL, Lessard DV, Hoeprich GJ, Morfini GA, Berger CL.. Phosphoregulation of Tau modulates inhibition of kinesin-1 motility. Mol Biol Cell. 2017;28(8):1079–1087. [DOI] [PMC free article] [PubMed] [Google Scholar]
- 33. Nishio K, Arioka H, Ishida T, et al. Enhanced interaction between tubulin and microtubule-associated protein 2 via inhibition of MAP kinase and CDC2 kinase by paclitaxel. Int J Cancer. 1995;63(5):688–693. [DOI] [PubMed] [Google Scholar]
- 34. Fromes Y, Gounon P, Veitia R, Bissery MC, Fellous A.. Influence of microtubule-associated proteins on the differential effects of paclitaxel and docetaxel. J Protein Chem. 1996;15(4):377–388. [DOI] [PubMed] [Google Scholar]
- 35. Dixit R, Ross JL, Goldman YE, Holzbaur EL.. Differential regulation of dynein and kinesin motor proteins by tau. Science. 2008;319(5866):1086–1089. [DOI] [PMC free article] [PubMed] [Google Scholar]
- 36. Seitz A, Kojima H, Oiwa K, Mandelkow EM, Song YH, Mandelkow E.. Single-molecule investigation of the interference between kinesin, tau and MAP2c. EMBO J. 2002;21(18):4896–4905. [DOI] [PMC free article] [PubMed] [Google Scholar]
- 37. LaPointe NE, Morfini G, Brady ST, Feinstein SC, Wilson L, Jordan MA.. Effects of eribulin, vincristine, paclitaxel and ixabepilone on fast axonal transport and kinesin-1 driven microtubule gliding: Implications for chemotherapy-induced peripheral neuropathy. Neurotoxicology. 2013;37:231–239. [DOI] [PMC free article] [PubMed] [Google Scholar]
- 38. Materazzi S, Fusi C, Benemei S, et al. TRPA1 and TRPV4 mediate paclitaxel-induced peripheral neuropathy in mice via a glutathione-sensitive mechanism. Pflugers Arch. 2012;463(4):561–569. [DOI] [PubMed] [Google Scholar]
- 39. Hara T, Chiba T, Abe K, et al. Effect of paclitaxel on transient receptor potential vanilloid 1 in rat dorsal root ganglion. Pain. 2013;154(6):882–889. [DOI] [PubMed] [Google Scholar]
- 40. Alessandri-Haber N, Dina OA, Yeh JJ, Parada CA, Reichling DB, Levine JD.. Transient receptor potential vanilloid 4 is essential in chemotherapy-induced neuropathic pain in the rat. J Neurosci. 2004;24(18):4444–4452. [DOI] [PMC free article] [PubMed] [Google Scholar]
- 41. Peters CM, Jimenez-Andrade JM, Kuskowski MA, Ghilardi JR, Mantyh PW.. An evolving cellular pathology occurs in dorsal root ganglia, peripheral nerve and spinal cord following intravenous administration of paclitaxel in the rat. Brain Res. 2007;1168:46–59. [DOI] [PMC free article] [PubMed] [Google Scholar]
- 42. Zajaczkowska R, Kocot-Kepska M, Leppert W, Wrzosek A, Mika J, Wordliczek J.. Mechanisms of chemotherapy-induced peripheral neuropathy. Int J Mol Sci. 2019;20(6):1451. [DOI] [PMC free article] [PubMed] [Google Scholar]
- 43. Ha JW, You MJ, Park HS, Kim JW, Kwon MS.. Differential effect of LPS and paclitaxel on microglial functional phenotypes and circulating cytokines: The possible role of CX3CR1 and IL-4/10 in blocking persistent inflammation. Arch Pharm Res. 2019;42(4):359–368. [DOI] [PubMed] [Google Scholar]
- 44. Wu P, Chen Y.. Evodiamine ameliorates paclitaxel-induced neuropathic pain by inhibiting inflammation and maintaining mitochondrial anti-oxidant functions. Hum Cell. 2019;32(3):251–259. [DOI] [PubMed] [Google Scholar]
- 45. Black JA, Nikolajsen L, Kroner K, Jensen TS, Waxman SG.. Multiple sodium channel isoforms and mitogen-activated protein kinases are present in painful human neuromas. Ann Neurol. 2008;64(6):644–653. [DOI] [PubMed] [Google Scholar]
- 46. Persson AK, Gasser A, Black JA, Waxman SG.. NaV1.7 accumulates and co-localizes with phosphorylated ERK1/2 within transected axons in early experimental neuromas. Exp Neurol. 2011;230(2):273–279. [DOI] [PubMed] [Google Scholar]
Associated Data
This section collects any data citations, data availability statements, or supplementary materials included in this article.
Supplementary Materials
Data Availability Statement
All information necessary to evaluate the findings of the paper are included in the manuscript. Additional data can be provided from the authors upon request.