

Abstract
Intestinal obstructions lead to a variety of motility disorders. Small intestine smooth muscles undergo dramatic phenotypic changes in response to obstruction, but the underlying molecular mechanisms are unknown. Using RT-PCR, ChIP, Re-ChIP, and Western blots, we examined the effect of small bowel mechanical obstruction on smooth muscle gene expression. Obstruction caused a transient hyperplasia, followed by a prolonged hypertrophic response of small intestine smooth muscle cells. Smooth muscle myosin heavy chain (MHC), α-actin, and γ-actin expression decreased initially, and then increased as hypertrophy developed. Myocardin expression decreased initially and then increased, while kruppel-like factors (KLF)4 and KLF5 expression increased initially, and then decreased. Serum response factor (SRF) expression decreased initially, and then recovered to sham-operated levels as hypertrophy developed. SRF binding to smooth muscle MHC and α-actin promoters decreased initially, but then increased above sham-operated levels as hypertrophy developed. Elk-1 binding to smooth muscle myosin heavy chain and α-actin promoters increased initially, and then decreased to sham-operated levels as hypertrophy developed. c-fos expression increased initially, which was associated with increased SRF/Elk-1 binding to the c-fos promoter. The Elk-1 phosphorylation inhibitor U-0126 inhibited the increase in c-fos expression. These findings indicate a dynamic response of small intestine smooth muscles to bowel obstruction involving switching between differentiated, proliferative, and hypertrophic phenotypes. These results suggest that changes in the expression and interactions between SRF, myocardin, Elk-1, and c-fos play key roles in the phenotypic switching of small intestine smooth muscles in response to mechanical obstruction.
Keywords: intestinal obstruction, serum response factor, smooth muscle
INTRODUCTION
Several congenital and acquired digestive tract motility disorders are associated with localized lumenal obstructions.1,2 Partial obstruction of the lumen induces intestinal distention, and increased muscle layer thickness oral to the obstruction in response to the increased functional demands.3 Animal models of intestinal obstruction, in which a constricting ring is placed around the small intestine, have provided a wealth of experimental data detailing the morphological, histological, ultrastructural and bio-mechanical changes that occur in obstructed intestinal smooth muscles.4–6 However, little is known about the molecular changes that occur in intestinal smooth muscles in response to mechanical obstruction.
Smooth muscle cells display phenotypic plasticity in response to local environmental cues.7 A hallmark of this phenotypic switching is decreased expression of smooth muscle-marker genes such as α-actin, smooth muscle myosin heavy chain (MHC), SM22α and desmin.8 The expression of virtually all smooth muscle-specific genes is regulated by serum response factor (SRF) binding to CC(A/T)6GG (CArG) elements in the promoters of these genes.9,10 Interestingly, the expression of immediate early growth-response genes, which is viewed as mutually exclusive to muscle differentiation, is also SRF/CArG dependent.9,10 Switching SRF-dependent transcription between two disparate CArG-dependent sets of genes requires the coordinated recruitment of several factors including myocardin, Elk-1, kruppel-like factors (KLF), GATA6 and FOXO4.10–12 However, these findings are mainly based on studies of cultured vascular, airway and cardiac myocytes.
Intestinal smooth muscle hypertrophy and hyperplasia occur in response to bowel obstruction, but the contributions of each phenotype to bowel dysmotility is unknown.3,13 In addition, the temporal and molecular regulation of the hypertrophic and hyperplastic responses of intestinal smooth muscle cells to bowel obstruction has not been reported. Understanding the molecular mechanisms underlying the phenotypic responses of smooth muscles to intestinal obstruction is important for understanding the basis of the loss of functional efficiency that characterizes bowel obstruction. We hypothesized that phenotypic switching occurs at different times following bowel obstruction, thus providing an in vivo model for studying the underlying mechanisms regulating intestinal smooth muscle phenotypic switching. In this study, we assessed smooth muscle phenotypic changes and SRF/CArG-dependent transcriptional regulation following mechanical obstruction of the murine small intestine. We investigated SRF-dependent transcriptional activities by evaluating SRF binding to smooth muscle-marker promoters in endogenous chromatin. In addition, SRF expression levels, the regulation of the SRF-dependent transcription, and the interactions between SRF and several cofactors were examined.
METHODS
Surgical procedures and treatments
Intestinal obstruction was induced in male CD-1 mice (Charles River Laboratories, Wilmington, MA, USA; 40–60 days old) as described, with minor modifications.4 The mice were anaesthetized with Avertin (tribromoethanol, 0.4 mg g−1) subcutaneously. A silicone ring with an internal diameter 1–2 mm greater than the small intestine was placed around the small intestine 30–50 mm oral to the ileo-cecal junction. Sham-operated age-matched controls underwent the same intestinal manipulation except for ring application. Only animals without postoperative adhesions were used for experiments. For the indicated experiments, U-0126 (10 mg kg−1) was dissolved in 0.4% DMSO in phosphate-buffered saline. U-0126 was administrated subcutaneously to mice with partial-obstruction surgery, immediately after the surgery, and then every 8 h until 24 h after surgery. A set of mice with partial-obstruction surgery received subcutaneous injections of vehicle alone as controls for the injection procedure. Non-operated and sham-operated mice did not receive subcutaneous injections of U-0126. The animals were maintained and experiments performed in accordance with the National Institutes of Health Guide for the Care and Use of Laboratory Animals, and all procedures were approved by the Institutional Animal Use and Care Committee at the University of Nevada, Reno. Experimental animals and sham-operated animals were killed at 6 h, and 1, 3, 7 and 14 days after surgery by isofluorane anaesthesia followed by decapitation. For most of the studies, tissues were collected from non-operated control animals (n = 3) the same day that tissues were collected from animals 14 days after partial-obstruction surgery. When sham-operated and experimental animals were killed 6 h or 1 day after surgery, the non-operated control animals were killed at the same time. The 50-mm segment of small intestine oral to the obstruction was removed and pinned out in a Sylgard-lined dish containing Krebs buffer.14 The segment was opened by cutting lengthwise, washed with Krebs, and the mucosa and submucosa removed by sharp dissection. The smooth muscles were quick frozen in liquid nitrogen and stored at −80 °C.
Histology and immunohistochemistry
For the histological and immunohistochemical analyses, 10 mm segments of smooth muscle oral to the occlusion ring were used. Cryostat sections (5 μm) were prepared using the standard protocol, stained with haematoxylin and eosin, and examined by light microscopy. The cross-sectional thickness of the circular muscle layer was measured, and the average of three measurements from five different mice was used for statistical analysis. The number of smooth muscle cells in the circular muscle layer was determined by counting the number of nuclei within a 100 μm cross-sectional area. Similar regions from the ileum of sham-operated mice were analysed. Whole-mounts were used for immunohistochemical analysis. Following mucosa and submucosa removal, the smooth muscles were stretched to 110% of their resting length, fixed with 4% paraformaldehyde-saline pH 7.4 for 10 min at room temperature, and permeabilized with 0.3% Triton-X 100-saline for 1 h at 4 °C. The tissues were incubated in 1% BSA-saline for 1 h at room temperature, labelled with anti-SRF antibodies for 48 h at 4 °C followed by incubation with Alexa-488-conjugated secondary antibodies (Molecular Probes, Eugene, OR, USA) for 1 h at room temperature. Propidium iodide (Vector Laboratories, Burlingame, CA, USA) was used to stain nuclei. Specificity was verified by omitting either primary or secondary antibodies. Whole-mounts were examined with a Zeiss LSM 510 META confocal microscope (Thornwood, NY, USA). Similar regions from the ileum of non-operated mice were analysed.
Isolation of cytosolic and nuclear proteins
All steps were performed at 4 °C. Frozen 50 mm segments of small intestine smooth muscle oral to the obstruction were sliced into small pieces, Dounce homogenized in ice-cold hypotonic buffer (20% glycerol, 10 mmol L−1 Hepes pH 7.5, 1.5 mmol L−1 MgCl2, 5 mmol L−1 KCl, 5 mmol L−1 NaF, 3 mmol L−1 EGTA, 0.5 mmol L−1 phenylmethylsulfonyl fluoride, 1 mmol L−1 dithiothreitol, 2 μmol L−1 okadaic acid, and a protease inhibitor tablet (Roche, Roche Diagnostics, Indianapolis, IN, USA), centrifuged at 16 000 g for 10 min, and the supernatant collected as the cytosolic fraction. The pellet was resuspended, sieved through nylon syringe filters of decreasing pore size (200 and 50 μm; Spectrum Medical, Rancho Dominguez, CA, USA), and the flow-through centrifuged at 16 000 g for 10 min. The pellet was resuspended in hypertonic buffer [20% glycerol, 20 mmol L−1 Hepes pH 7.5, 1.5 mmol L−1 MgCl2, 400 mmol L−1 NaCl, 5 mmol L−1 NaF, 3 mmol L−1 EGTA, 0.5 mmol L−1 phenylmethylsulfonyl fluoride, 1 mmol L−1 dithiothreitol, 2 μmol L−1 okadaic acid, and a protease inhibitor tablet (Roche)], incubated on a rocking platform for 30 min, centrifuged at 16 000 g for 20 min, and the supernatant collected as the crude nuclear fraction. Protein concentrations were determined using the Bradford assay with bovine γ-globulin as standard. The protein fractions were quick frozen in liquid nitrogen and stored at −80 °C. Similar regions from the ileum of mice without occlusion rings were analysed.
SDS-PAGE and Western blotting
SDS-PAGE and Western blotting was performed as previously described.14 Equal amounts of protein were loaded into each lane. The following antibodies were used: anti-smooth muscle MHC (1:2000) (Biomedical Technologies, Stoughton, MA, USA), anti-smooth muscle α-actin (1:2000) (Sigma-Aldrich, St Louis, MO, USA), anti-smooth muscle γ-actin (1:2000) (Seven Hill Biore-agents, Cincinnati, OH, USA.), anti-SRF (1:500) (Santa Cruz Biotechnology, Santa Cruz, CA, USA) and anti-Elk-1 (1:1000) (Santa Cruz Biotechnology). Horseradish peroxidase-conjugated secondary antibodies (1:50 000) (Chemicon, Temecula, CA, USA) were used to detect protein bands by enhanced chemiluminescence (ECL Advantage, Amersham Bioscience, Piscataway, NJ, USA). Protein bands were visualized by CCD-camera detection (Epi Chem II, UVP Laboratory Products, Upland, CA, USA), and the TIFF images were analysed using Adobe Photoshop. The Western blots in each figure are representative of six separate experiments.
Quantitative ChIP and Re-ChIP assays
Fifty millimetre segments of small intestine smooth muscle oral to the obstruction were sliced into small pieces and treated with 1% formaldehyde for 15 min at 37 °C. The fixed tissues were immunoprecipitated as described by the manufacturer (Upstate Biotechnology, Lake Placid, NY, USA) with minor modifications. Briefly, cross-linked chromatin was immunoprecipitated with anti-SRF antibody (Santa Cruz Biotechnology) and protein A-coated agarose beads. Pre-immune rabbit IgG was used as control. The immunoprecipitated chromatin DNA was purified, and quantitated using Picogreen (Invitrogen Inc., Carlsbad, CA, USA) according to the manufacturer’s instructions. Real-time PCR was performed on 4 ng of purified input DNA and immunoprecipitated DNA. Relative quantities (RQ) were calculated with the DART-PCR algorithm. The target sequence fold-enrichment was calculated from the ratio of R0(IP)/R0 (input) − R0(no-antibody control)/R0 (input). The averages and standard errors of the mean were calculated from three independent experiments. For the Re-ChIP assays, the specific protein/DNA complex was extracted twice with 10 mmol L−1 dithiothreitol, and immunoprecipitated with anti-Elk-1 (Santa Cruz Biotechnology). The primer sequences for amplifying promoters containing the CArG box and ETS binding site were: SM-MHC, 5′-CGCGGGACC ATAT-TTAGTCAGG-3′/ 5′-TCAGG CCATAAAAGGAAGTCGAG-3′; SM α-actin, 5′-GGAGCAGAACAGAGGAATGCA-3′/ 5′-GCTTCCCAAACAAGGAGCAA-3′; c-fos, 5′-CAGCCGGCGAGCTGTT-3′/ 5′-ACC GGCCGTGGAAACCT-3′.
Real-time RT-PCR
Total RNA was isolated from the 10-mm segment of small intestine smooth muscles immediately oral to the occlusion ring with TRIzol (Invitrogen), treated with DNase I (Ambion, Austin, TX, USA), and reverse transcribed with Superscript II and random hexamer primers (Invitrogen) according to the manufacturer’s protocol. Similar smooth muscle segments were obtained from the ileum from non-operated control and sham-operated mice. Real-time PCR was performed using Syber Green PCR master mix (Applied Biosystems, Foster City, CA, USA) and an ABI PRISM 7300 Sequencer (Applied Biosystems). Reactions were run in triplicate containing 40 ng of cDNA in 25 μL. Melting curves were performed using dissociation curves to ensure single product amplification, and samples were also run on 3% agarose gels to confirm specificity. Raw fluorescence data (Rct) was exported from sds 1.3 software (Applied Biosystems) and relative quantities (R0) of each gene automatically calculated using Excel Data Analysis for Real-Time PCR (DART-PCR), as described.15 The R0 value of each gene was normalized to that of 18S rRNA, whose expression stability was verified from normal and obstructed small intestine smooth muscle samples. The normalized R0 value of each gene from normal small intestine smooth muscles was used as control for calibration. The sequences of primers used were: smooth muscle MHC, 5′-GAGAAAGGAAACACCAAG GTCAAGC-3′/5′-AACAAATGAAGCCTCCTGGTGGCTC-3′; smooth muscle α-actin, 5′-CCAGACAT-CAGGGAGTAATGGTTG-3′/5′-TTTCCATGTCGTCCCAGTTGGT-3′; myocardin, 5′-TCTGGCACCCAAGCAGACAG-3′/5′-GGAATTGAAAACGTTGGCCC-3′; KLF4, 5′-CACACTTGTGACTATGCAGGCTGT-3′/5′-AATTTCCACCCACAGCCGTC-3′; SRF, 5′-CGCCACCATCATGACGTCGTCTGT-3′/5′-AGGCATTGAGCACGGTGAGGCT-3′; c-fos, 5′-ATCGGCAGAAGGGGCAAAGTAG-3′/5′-GCAACGCAGACTTCTCATCTTC AAG-3′; 18S rRNA, 5′-CGGCTACCACATCCAAGGAA-3′/5′-AGCTGGAATTACCGCG GC-3′. The sequences of smooth muscle γ-actin (ID: 6752952a1), KLF5 (ID: 31981873a3) and Elk-1 (ID: 6679631a2) primers were from PrimerBank.16
Statistical analysis
Statistical analysis was performed using Student’s t-test, comparing the corresponding time points after surgery from sham-operated animals and animals with small intestine partial-obstruction surgery. The non-operated animals were used as controls for calibration in real-time PCR and to provide normalized values for binding status in the ChIP assays. Differences were considered to be statistically significant when P < 0.05.
RESULTS
Morphological analysis of small intestine smooth muscles
The size and number of smooth muscle cells markedly increase following small intestine partial obstruction.4 As the morphological and ultrastructural changes in the small bowel wall have been described,3,4 only the cell number and muscle thickness were examined to characterize the hyperplastic and hypertrophic responses for the molecular studies. Fig. 1A shows that there was a small, but noticeable increase in muscle wall thickness 10 mm from the occlusion ring after 3 days of partial obstruction (middle panel), compared with the sham-operated control (left panel). Fourteen days after partial obstruction, the thickness of the longitudinal and circular muscle layers was markedly increased (right panel). Fig. 1B shows that the response of the circular muscle layer to obstruction could be divided into cell proliferation and cell hypertrophy phases. The proliferation phase occurred during the first 3 days after obstruction, as indicated by a doubling of the cell number. In the circular muscle layer from sham-operated animals, the average cross-sectional number of cells was 23 ± 2 (n = 5). Three days after partial obstruction, the average cross-sectional number of cells in the circular muscle layer 10 mm from the occlusion ring was 46 ± 4 (n = 5, P < 0.05). The average thickness of the circular muscle layer from sham-operated controls was 46 ± 2 μm (n = 5). Three days after partial obstruction, the average thickness of the circular muscle layer was 77 ± 4 μm (n = 5, P < 0.05). Fourteen days after partial obstruction, the average thickness of the circular muscle layer 10 mm from the occlusion ring was 386 ± 13 μm (n = 5, P < 0.05). The increase in the circular muscle layer thickness was due to an increase in the size of smooth muscle cells, as there was no further significant increase in cell number between 3 and 14 days after obstruction (Fig. 1B). These findings indicate that the cell hypertrophy phase occurred between 3 and 14 days after obstruction.
Figure 1.
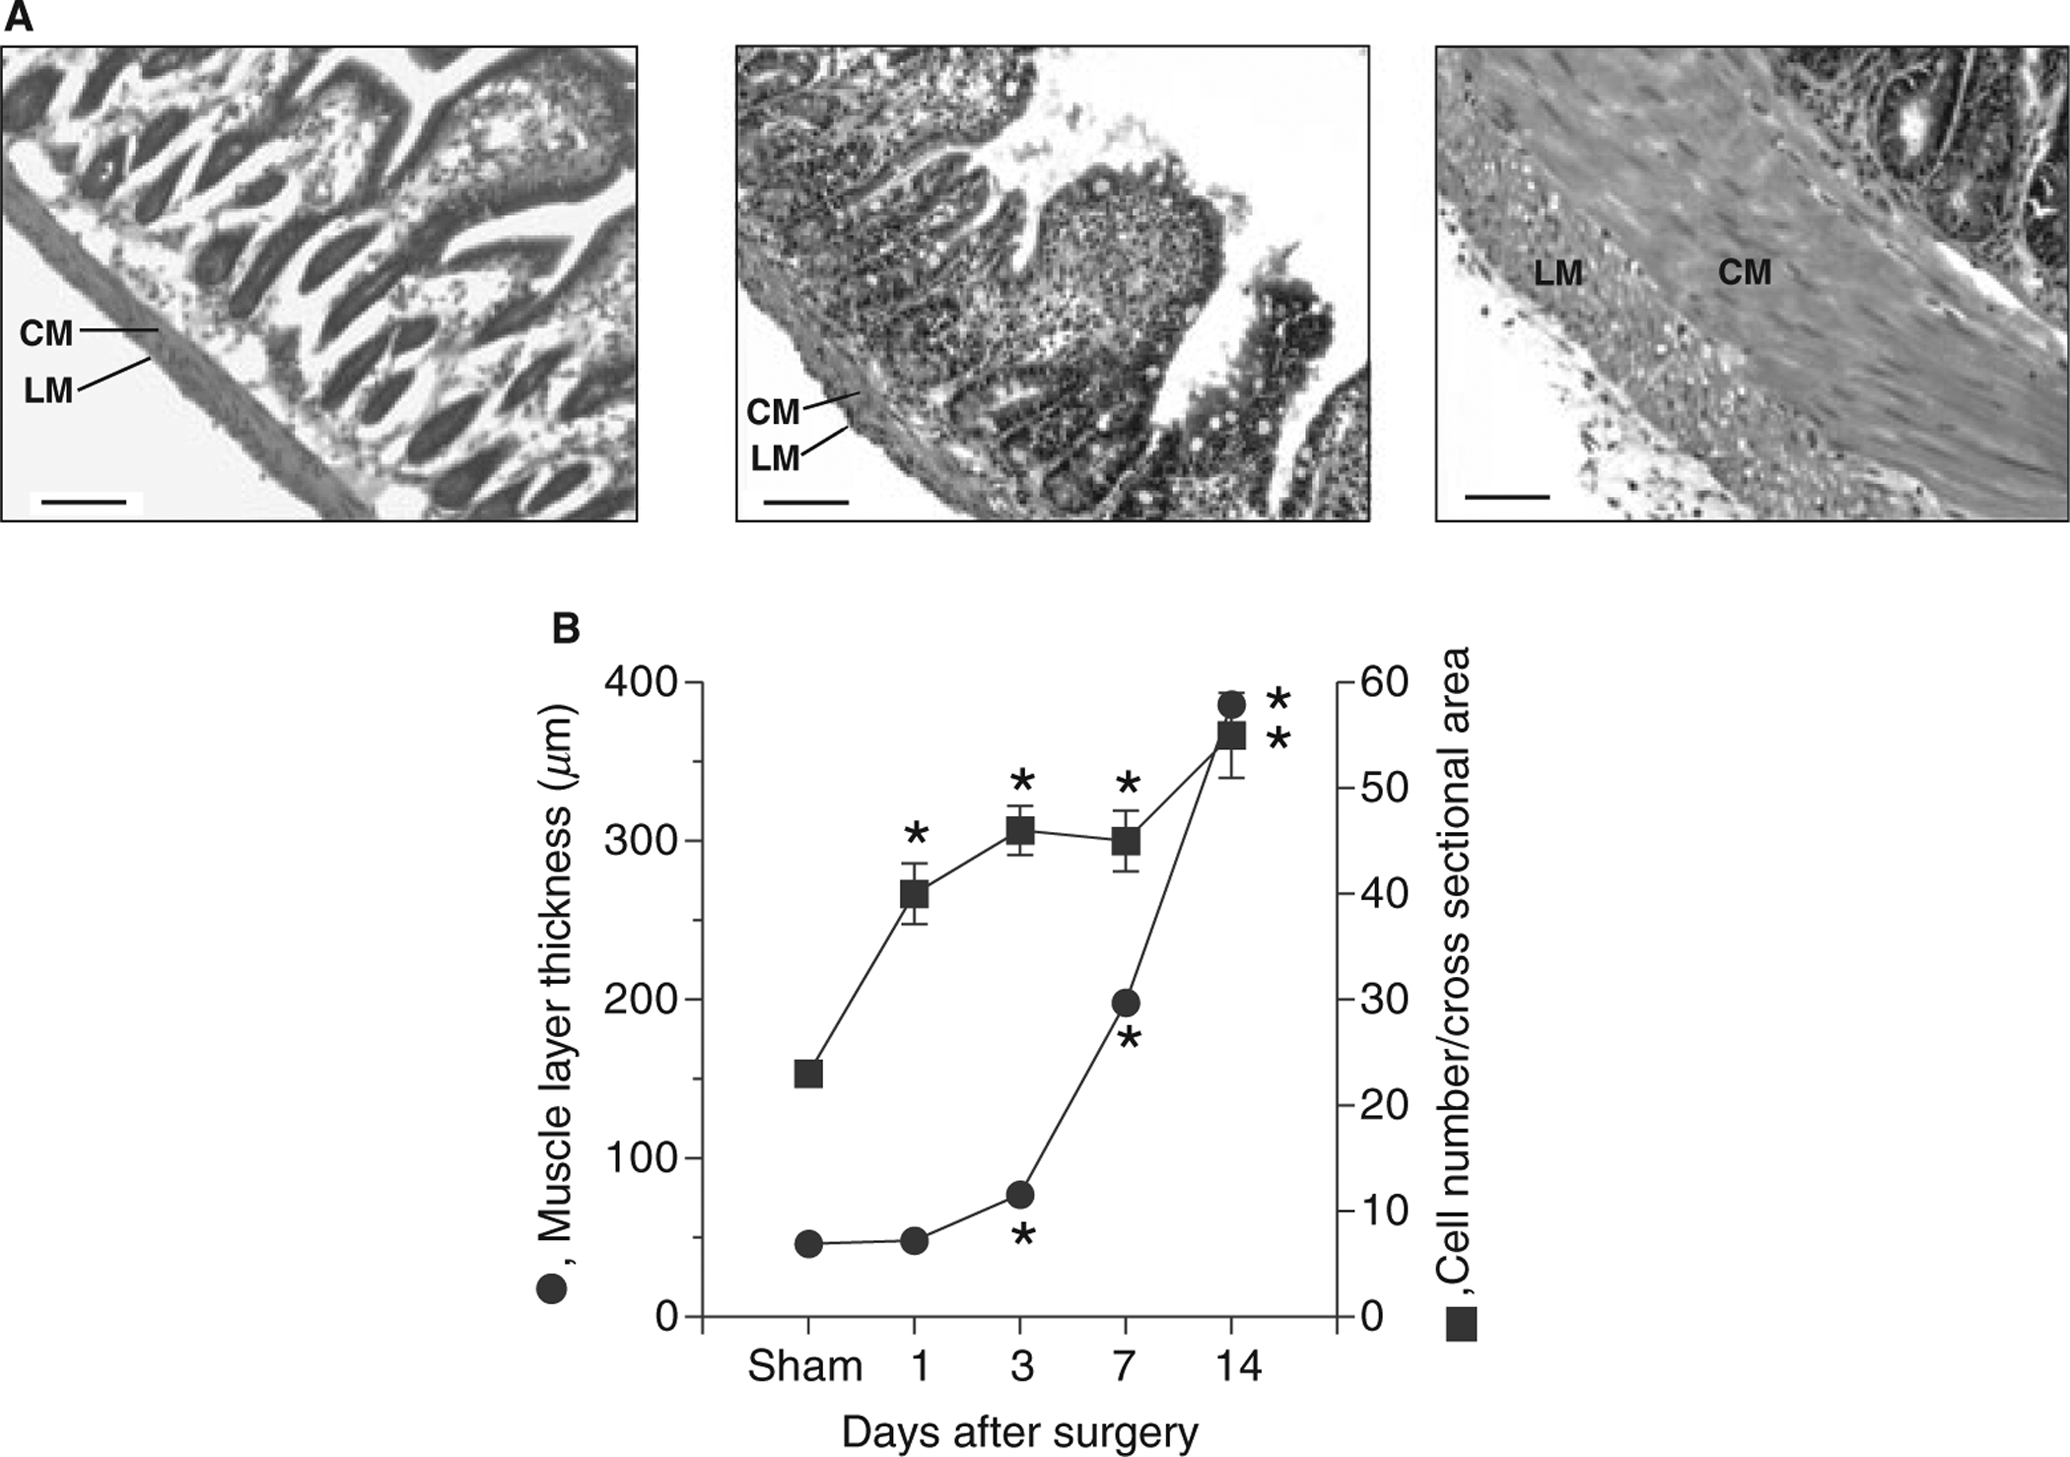
Morphological changes of smooth muscles following partial intestinal obstruction. (A) Representative haematoxylin and eosin-stained sections of sham-operated (left panel), 3 days (middle panel), and 14 days post-obstruction small intestine (right panel) (scale bar: 100 μm) (n = 5). Sections were obtained from sham-operated animals 7 days after sham surgery. No differences were noted in the muscle layers from sham-operated animals 1, 3, 7 and 14 days after sham-surgery (data not shown). CM, circular muscle layer; LM, longitudinal muscle layer; (B) Changes in circular muscle layer thickness and smooth muscle cell number following partial intestinal obstruction (data obtained from four different points from five sham-operated and five small intestine partial-obstruction animals). The number of smooth muscle cells was evaluated by counting the number of nuclei in a 100 μm cross-section of the circular muscle layer (mean ± SE, *P < 0.05 compared with sham).
Smooth muscle-marker gene expression
The phenotypic changes underlying the morphological changes were addressed by measuring the transcript and protein levels of three smooth muscle-marker genes, smooth muscle MHC, α-actin and γ-actin. Fig. 2A–C show that the mRNA levels of these genes were significantly decreased below non-operated control levels 6 h after obstruction. This down-regulation is likely partly due to surgical manipulation, as a similar degree of down-regulation occurred in sham-operated controls. At 1 day post-obstruction, the mRNA levels of these smooth muscle-specific genes further decreased to 20–30% of the non-operated control levels (Fig. 2A–C), while the mRNA levels in the sham-operated controls did not decrease further, suggesting that the further decrease in transcript levels occurred in response to intestinal obstruction. The mRNA levels in sham-operated and obstructed smooth muscles recovered to non-operated control levels within 7 days. Fourteen days post-obstruction, the mRNA levels of smooth muscle MHC, α-actin and γ-actin were increased to 150–200% of the sham-operated controls. Fig. 2D shows that smooth muscle MHC, α-actin and γ-actin protein expression followed a similar pattern. The protein levels decreased at 1 day post-obstruction, but at 14 days post-obstruction, the protein levels of smooth muscle MHC, α-actin and γ-actin were increased relative to sham-operated controls.
Figure 2.
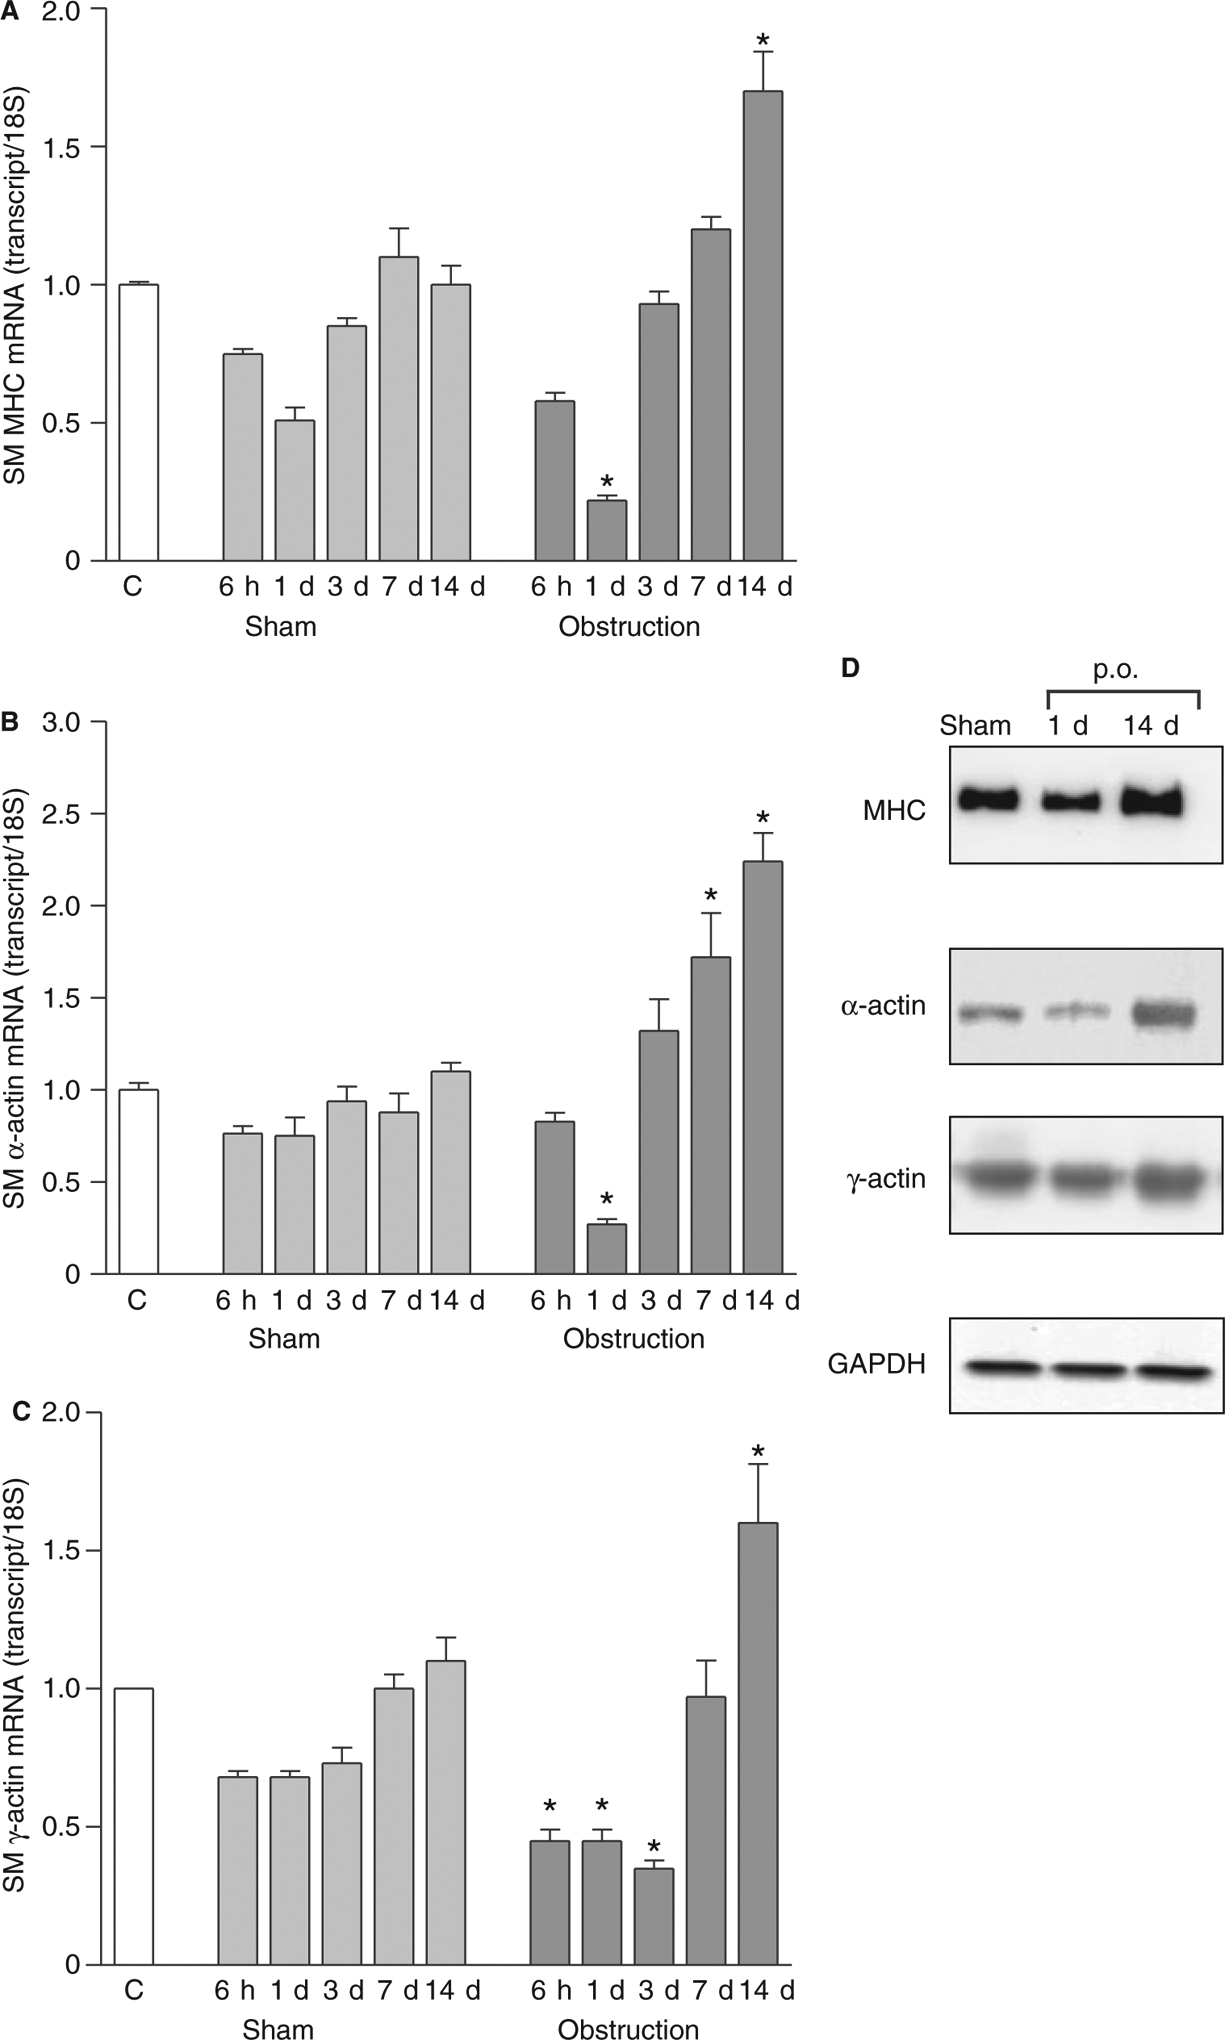
Expression of smooth muscle contractile proteins following intestinal obstruction. Real-time RT-PCR analysis of (A) smooth muscle MHC, (B) α-actin and (C) γ-actin expression (n = 3 animals per time point, mean ± SE, *P < 0.05 vs corresponding sham-operated values). C, non-operated controls; (D) Representative Western blots of smooth muscle MHC (1 μg of cytosolic protein/lane), α-actin and γ-actin (10 μg of cytosolic protein/lane). p.o., partial obstruction.
Role of SRF in smooth muscle-phenotypic modulation
As SRF regulates smooth muscle MHC, α-actin and γ-actin gene transcription, SRF mRNA levels were measured with real-time RT-PCR. Fig. 3A shows that SRF mRNA levels decreased in the first 6 h after obstruction to about 40% of the non-operated control levels. Part of this down-regulation is probably due to surgical manipulation, as a similar degree of down-regulation occurred in sham-operated animals at 6 h after surgery (Fig. 3A). However, at 1 day post-obstruction, the SRF mRNA levels remained at 30–40% of non-operated controls, while the SRF mRNA levels in the sham-operated animals were increasing, suggesting that the further decrease in SRF transcript levels occurred in response to intestinal obstruction. By 3 days, SRF mRNA levels in the obstructed smooth muscles recovered to non-operated and sham-operated control levels, and remained at these levels up to 14 days after obstruction. Fig. 3B shows that SRF protein expression followed a similar pattern. At 1 day post-obstruction, SRF protein levels in the nuclear fraction were decreased relative to non-operated controls. By 14 days post-obstruction, SRF protein levels in obstructed smooth muscles were similar to non-operated levels. These data also show that SRF protein is localized to the nucleus in both non-operated control and obstructed smooth muscles. Similarly, immunofluorescence microscopy shows a nuclear distribution of SRF in both non-operated control and obstructed small intestine smooth muscles (Fig. 3C).
Figure 3.
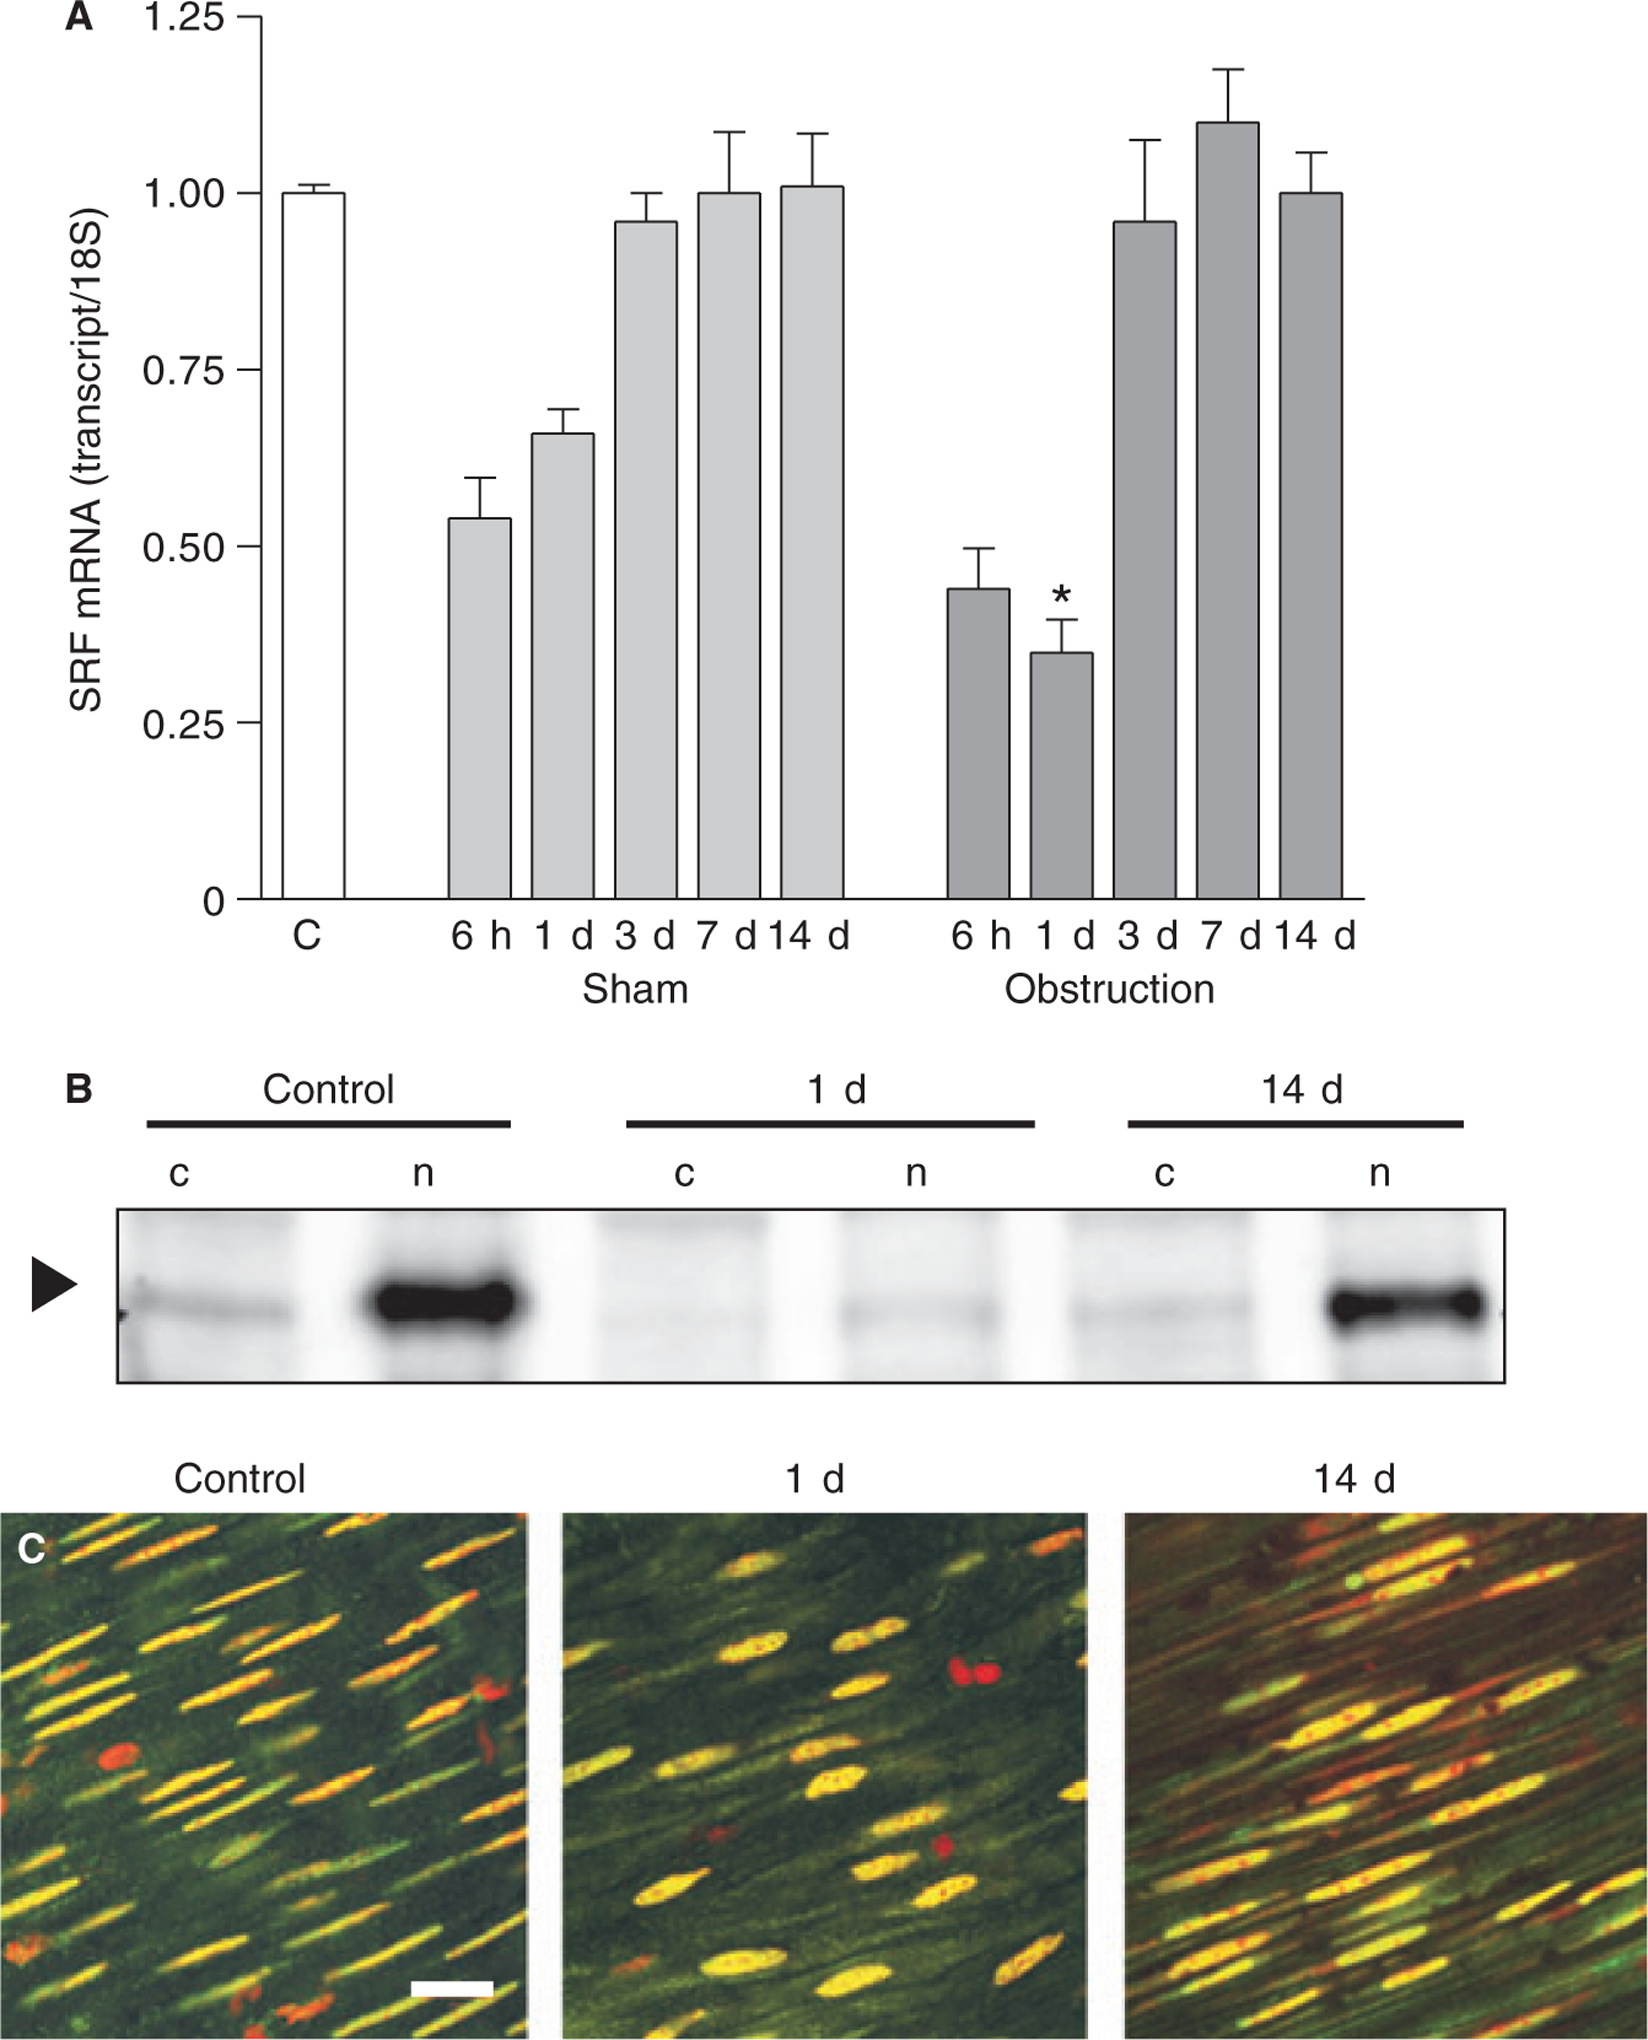
SRF expression following intestinal obstruction. (A) SRF mRNA levels were analysed by real-time RT-PCR (n = 3 animals per time point, mean ± SE, *P < 0.05 compared with corresponding sham-operated time point). (B) Representative SRF Western blots. SRF is primarily localized to the nucleus (arrowhead). 50 μg of cytosolic (c) or nuclear (n) protein samples were loaded into each lane. (C) Whole-mount anti-SRF immuno-fluorescence of non-operated (left panel), 1 day (middle panel), and 14-day (right panel) obstructed small intestine smooth muscles (scale bar: 100 μm).
Fourteen days after small intestine partial obstruction, the mRNA levels of smooth muscle MHC, α-actin and γ-actin were increased to 150–200% of the non-operated and sham-operated controls (Fig. 2). As these genes contain CArG boxes within their promoters, SRF binding to smooth muscle MHC and α-actin promoters was analysed by ChIP assay using anti-SRF antibodies. Fig. 4A, B shows that SRF binding to smooth muscle MHC and α-actin promoters decreased relative to sham-operated controls in the first 24 h, returned to non-operated and sham-operated control levels in about 7 days, and increased above non-operated and sham-operated control levels by 14 days. These data demonstrate that SRF binding to these promoters correlates with the changes in genes expression of these smooth muscle markers.
Figure 4.
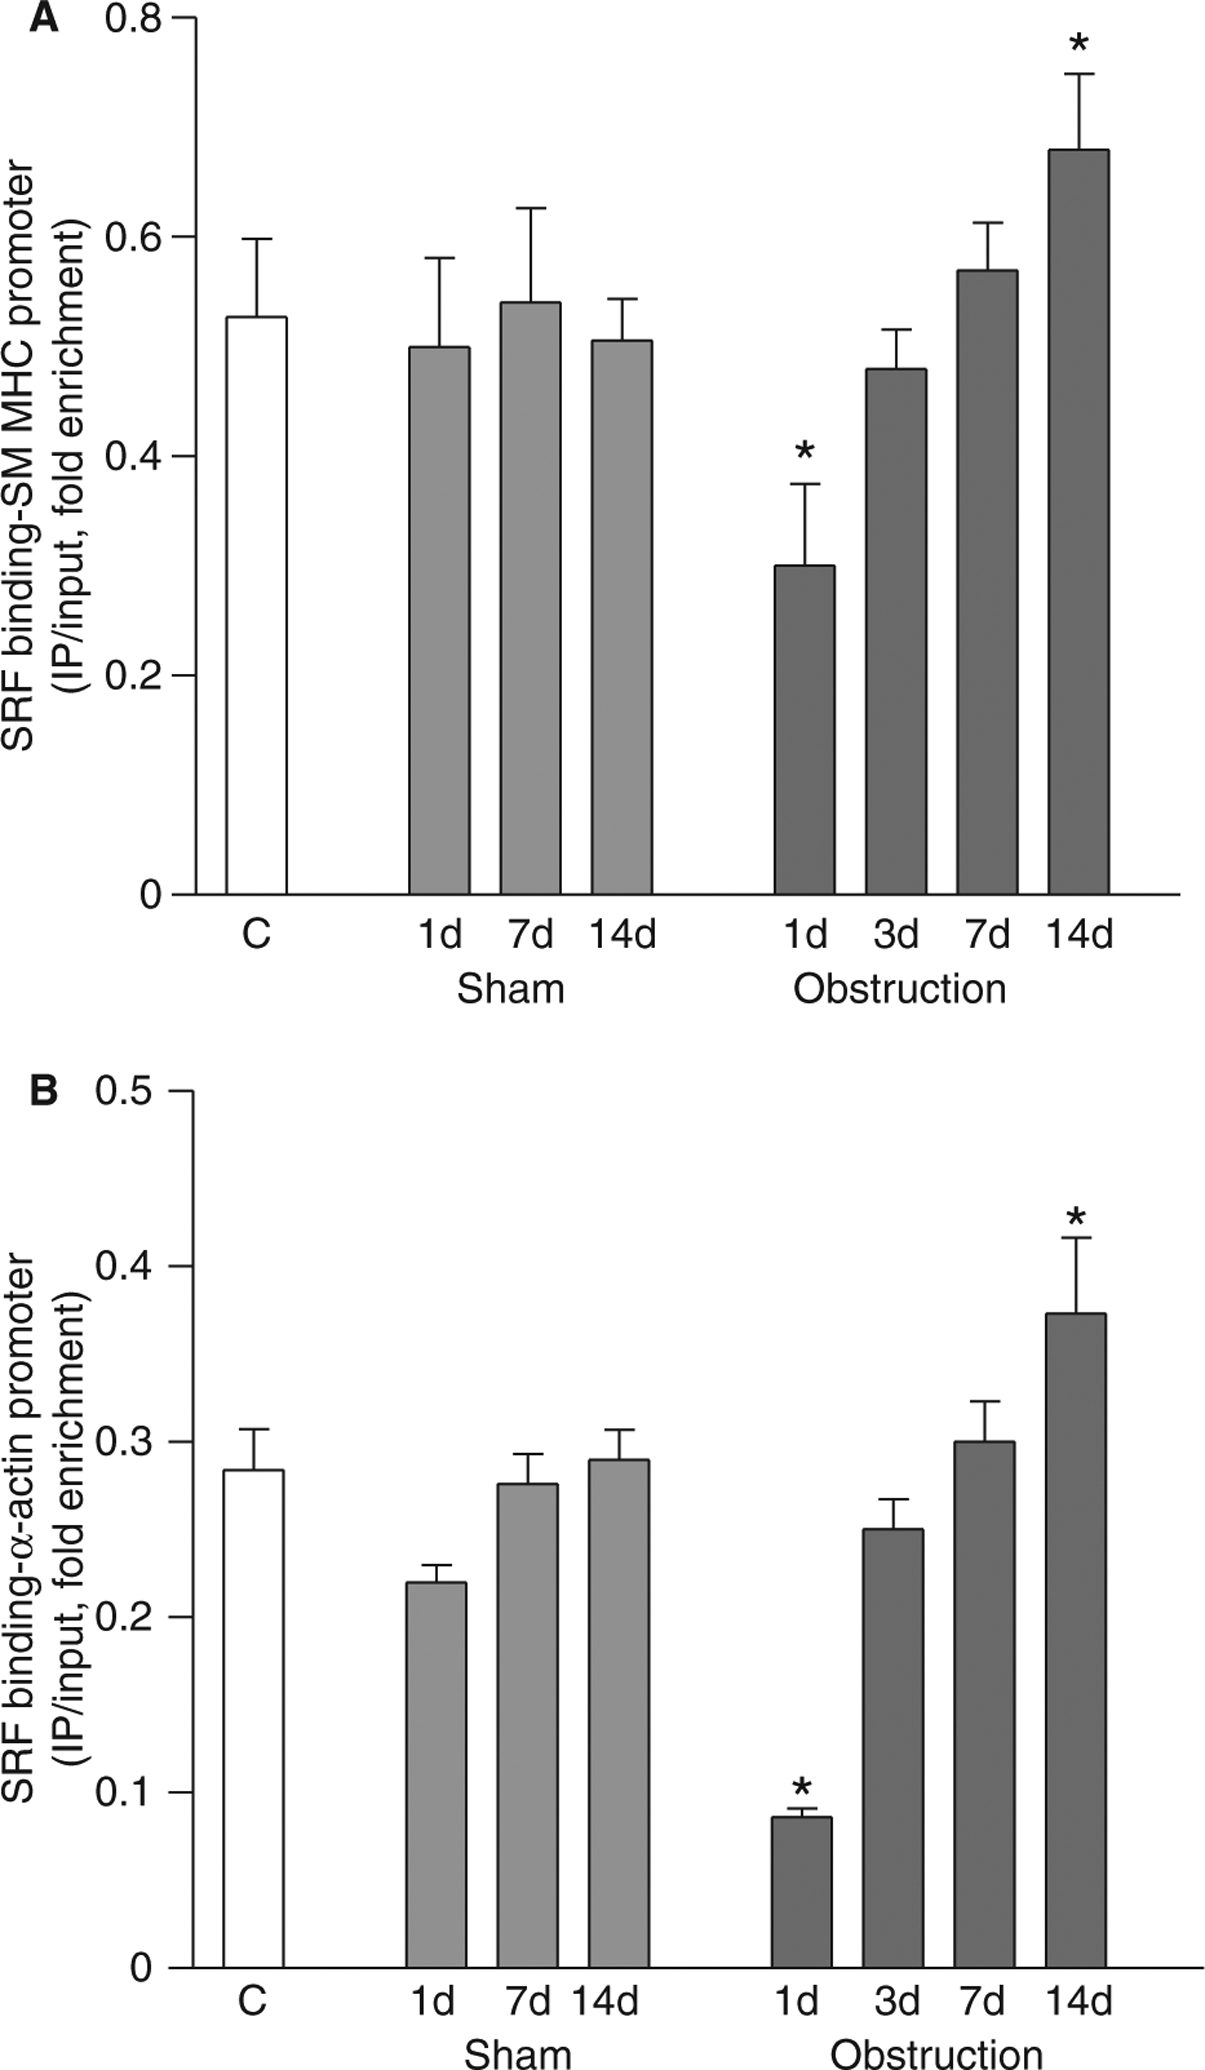
SRF binding to smooth muscle MHC and α-actin promoters decreases during the cell proliferation phase and increases during the cell hypertrophy phase. ChIP was carried out with anti-SRF antibodies, and the promoter regions of smooth muscle (A) MHC and (B) α-actin were amplified and quantitated by real-time PCR (n = 3, mean ± SE, *P < 0.05 compared to corresponding sham-operated time points).
Role of Elk-1 in small intestine smooth muscle phenotypic modulation
Elk-1 competes with myocardin for SRF binding and suppresses SRF-dependent transcription of smooth muscle-specific genes.10 To explore Elk-1 regulation of smooth muscle MHC and α-actin gene transcription following intestinal obstruction, the interactions of Elk-1 and SRF with the promoter regions of these two genes was examined. Re-ChIP assays with sequential anti-SRF and anti-Elk-1 immunoprecititations were performed. Fig. 5A, B shows that Elk-1 association with SRF-bound smooth muscle MHC and α-actin promoters increased in the first 24 h after intestinal obstruction, and then returned to sham-operated control levels thereafter. Elk-1 mRNA and protein expression in small intestine smooth muscles were also examined. Fig. 5C, D shows that Elk-1 mRNA and protein levels remained similar to sham-operated controls following intestinal obstruction. As phosphorylated Elk-1 binds to the ETS site and interacts with SRF,17,18 the effect of the Elk-1 phosphorylation inhibitor U-0126 on smooth muscle MHC and α-actin gene transcription was examined. Fig. 5E shows that U-0126 reversed the down-regulation of smooth muscle MHC and α-actin expression that occurs during the proliferative phase, suggesting that increased Elk-1 binding to SRF contributes to the smooth muscle MHC and α-actin down-regulation.
Figure 5.
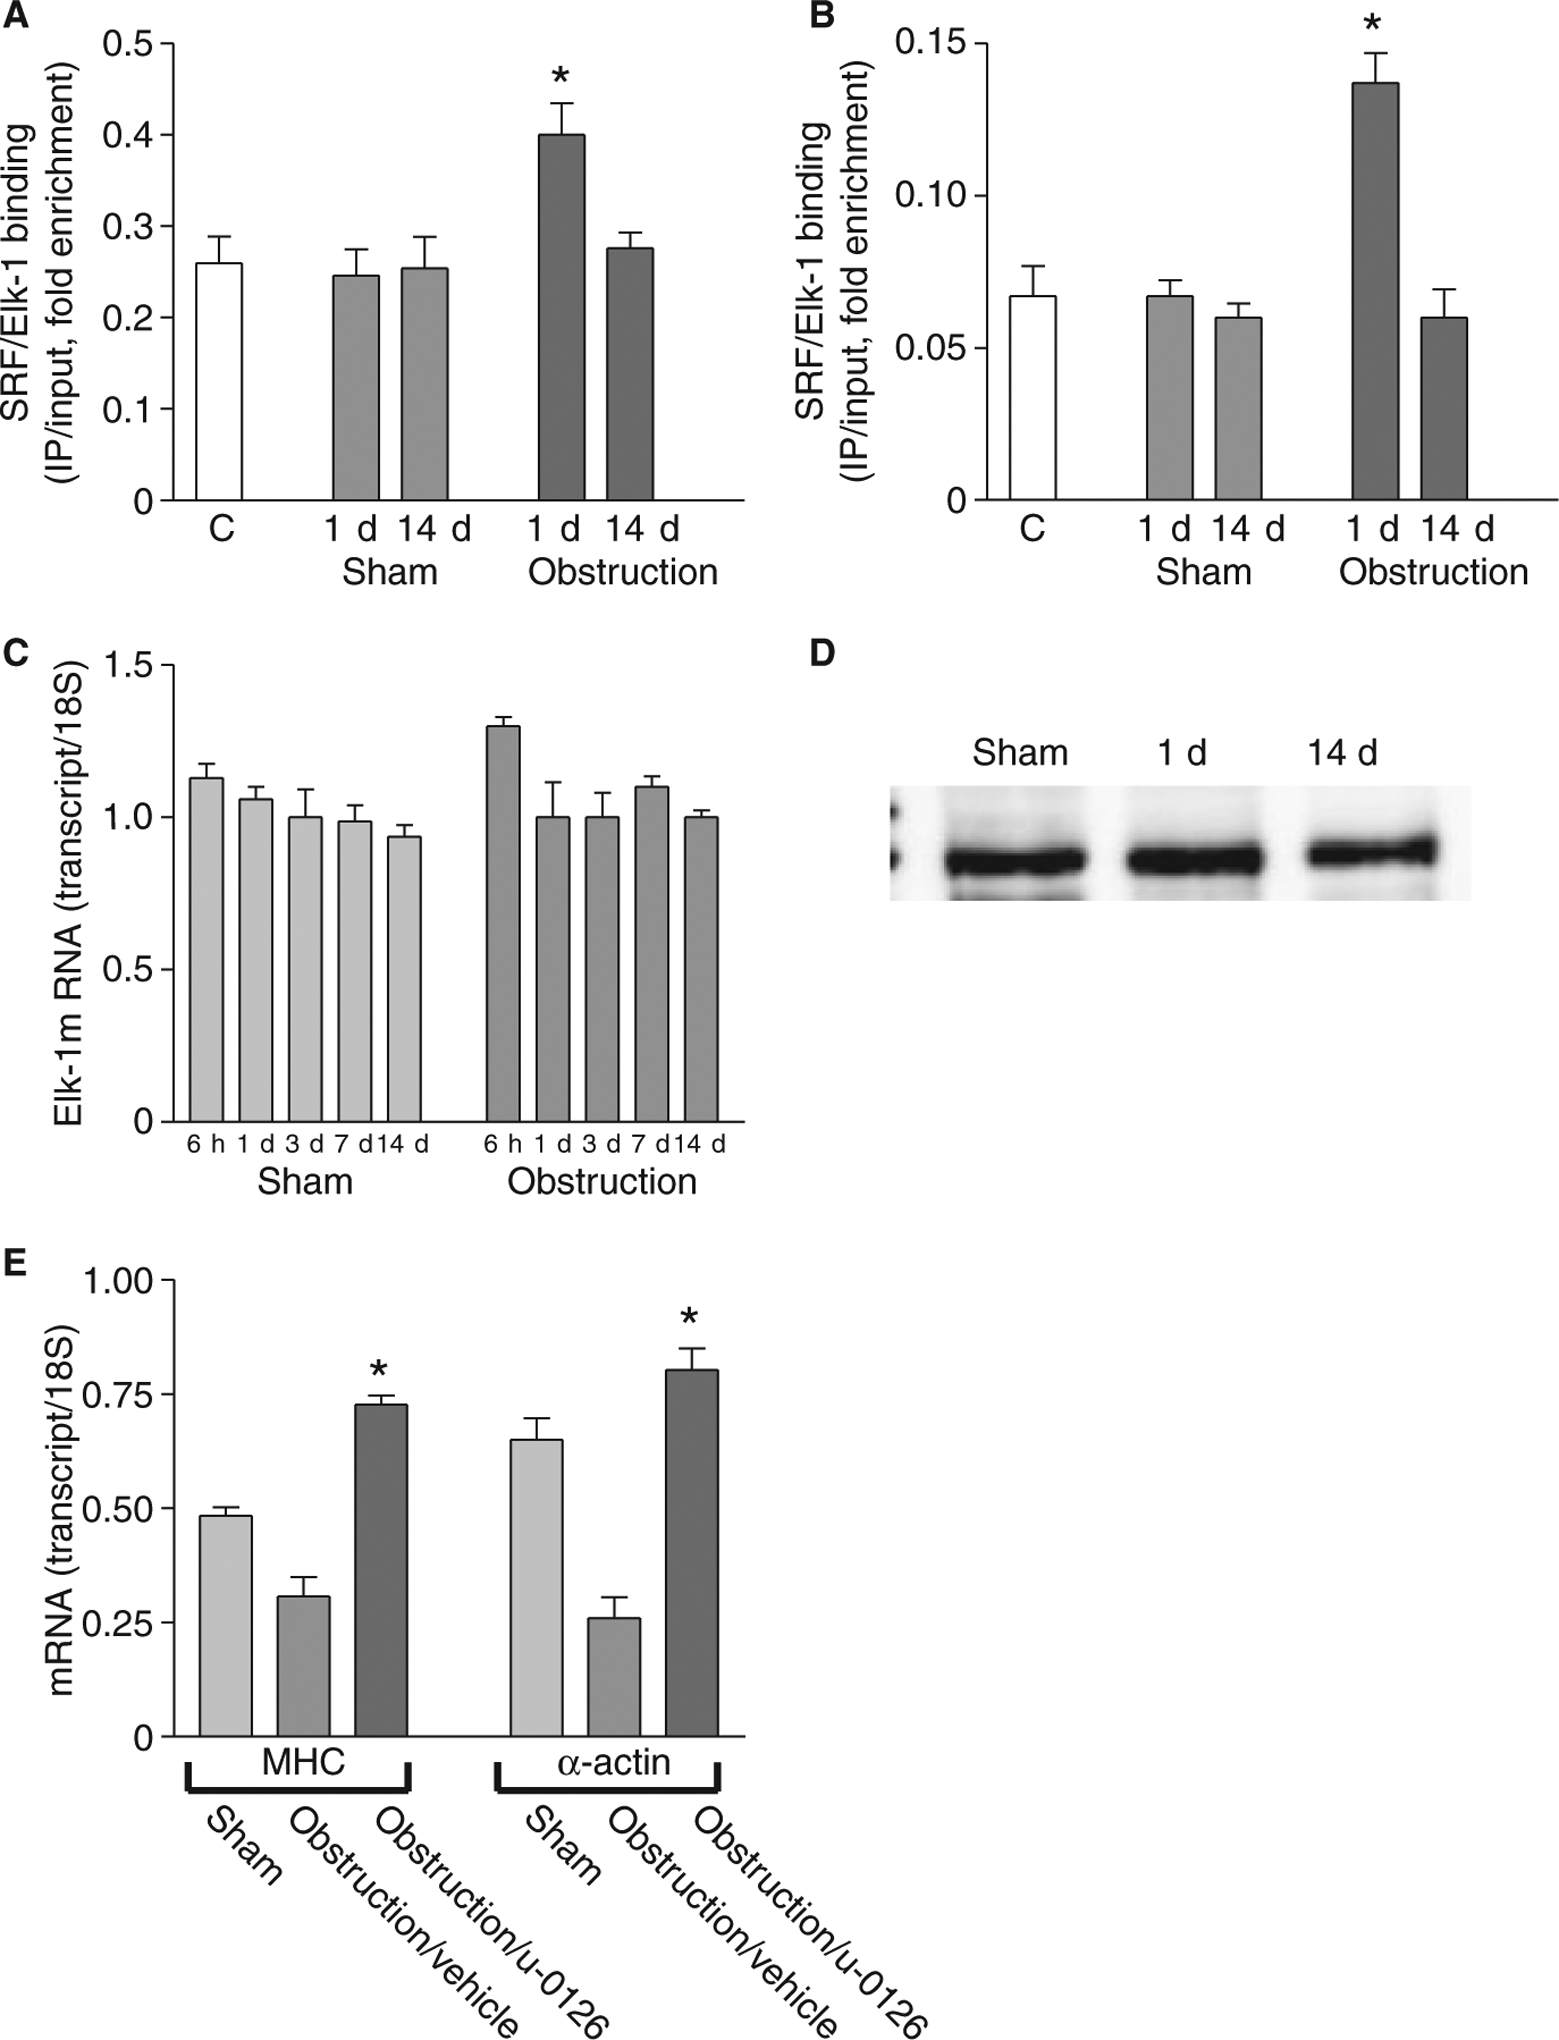
Elk-1 binding to SRF-bound MHC and α-actin promoters increases during the cell proliferation phase. ChIP was carried out with anti-SRF antibodies, Re-ChIP was carried out with anti-Elk-1 antibodies, and the promoter regions of smooth muscle (A) MHC and (B) α-actin were amplified and quantitated by real-time PCR (n = 3, mean ± SE, *P < 0.05 compared to corresponding sham-operated time point). (C) Real-time RT-PCR and (D) Western blot analysis (25 μg protein/lane) show no significant change in Elk-1 expression following intestinal obstruction. (E) Real-time RT-PCR shows that U-0126 reverses the down-regulation of smooth muscle MHC and α-actin expression at 1 day post-obstruction (n = 3, mean ± SE, *P < 0.05 compared with obstruction/vehicle).
Myocardin, KLF4 and KLF5 expression
Myocardin binds to SRF and regulates SRF-dependent transcription of smooth-muscle contractile protein genes.10 Myocardin expression was examined in obstructed small intestines. Decreased expression in the cell proliferation phase and increased expression in the cell hypertrophy phase relative to sham-operated controls were evident by real-time RT-PCR (Fig. 6A), suggesting that myocardin expression levels may regulate both proliferative and hypertrophic phenotypic switching via its interaction with SRF. KLF4 and KLF5 activity is associated with the proliferative smooth muscle phenotype.19 KLF4 and KLF5 expression transiently increased in both obstructed and sham-operated controls, indicating the transient increase in KLF4 and KLF5 expression is induced by the surgical manipulation. In contrast, KLF4 and KLF5 expression in the cell hypertrophy phase was significantly lower than sham-operated control levels (Fig. 6B and C).
Figure 6.
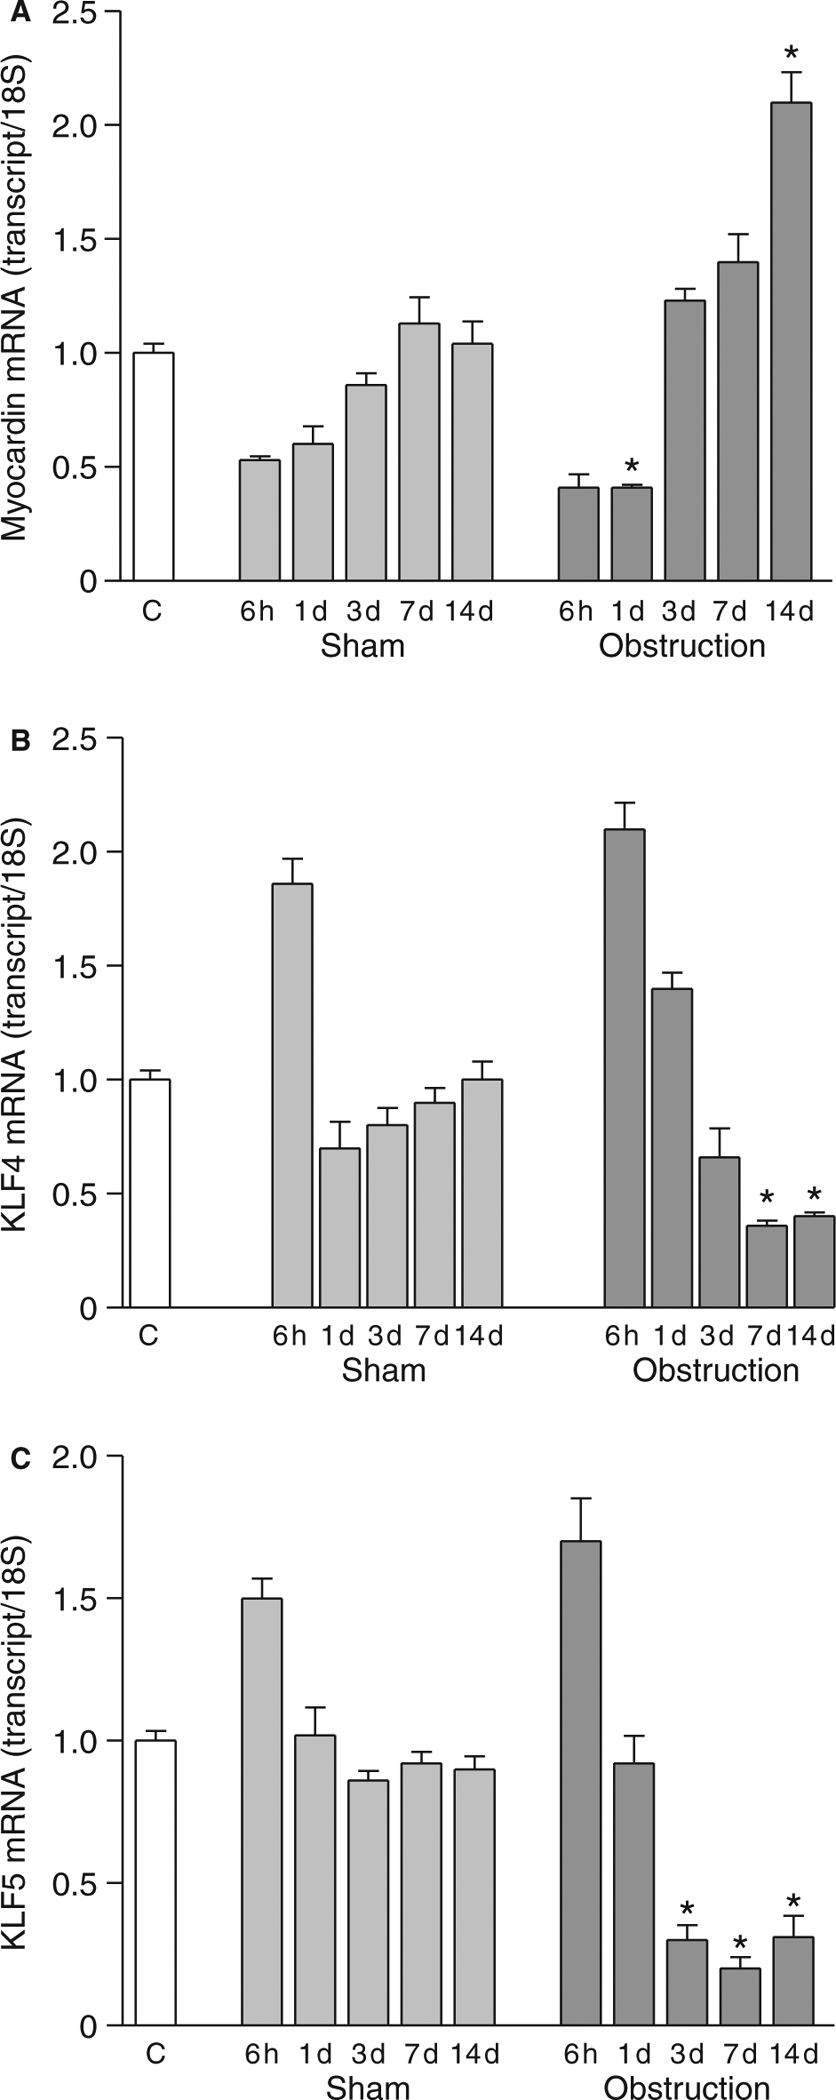
Myocardin, KLF4 and KLF5 expression following intestinal obstruction. Real-time RT-PCR analysis of (A) myocardin, (B) KLF4 and (C) KLF5 expression (n = 3, mean ± SE, *P < 0.05 compared with corresponding sham-operated time points).
c-fos expression after intestinal obstruction
Expression of the immediate early growth-response gene c-fos is increased by SRF and Elk-1 binding to the c-fos promoter CArG box.9 As shown in Fig. 1, mechanical obstruction induced smooth muscle cell proliferation, real-time RT-PCR was carried out to examine c-fos mRNA expression. Fig. 7A shows that c-fos mRNA levels were transiently increased at 6 h and 1 day after obstruction relative to sham-operated controls, in contrast to the decreased expression of smooth muscle-specific genes. ChIP and Re-ChIP assays revealed that this increase in c-fos expression 1 day after partial obstruction of the small intestine was associated with increased SRF binding to the c-fos promoter (Fig. 7B) and an increased interaction between Elk-1 and SRF (Fig. 7C). Furthermore, subcutaneous injection of the Elk-1 phosphorylation inhibitor U-0126 immediately after the partial-obstruction surgery significantly attenuated the up-regulation of c-fos expression (Fig. 7D). These results suggest that Elk-1 phosphorylation is a key factor for SRF-dependent c-fos transcription and smooth muscle cell proliferation.
Figure 7.
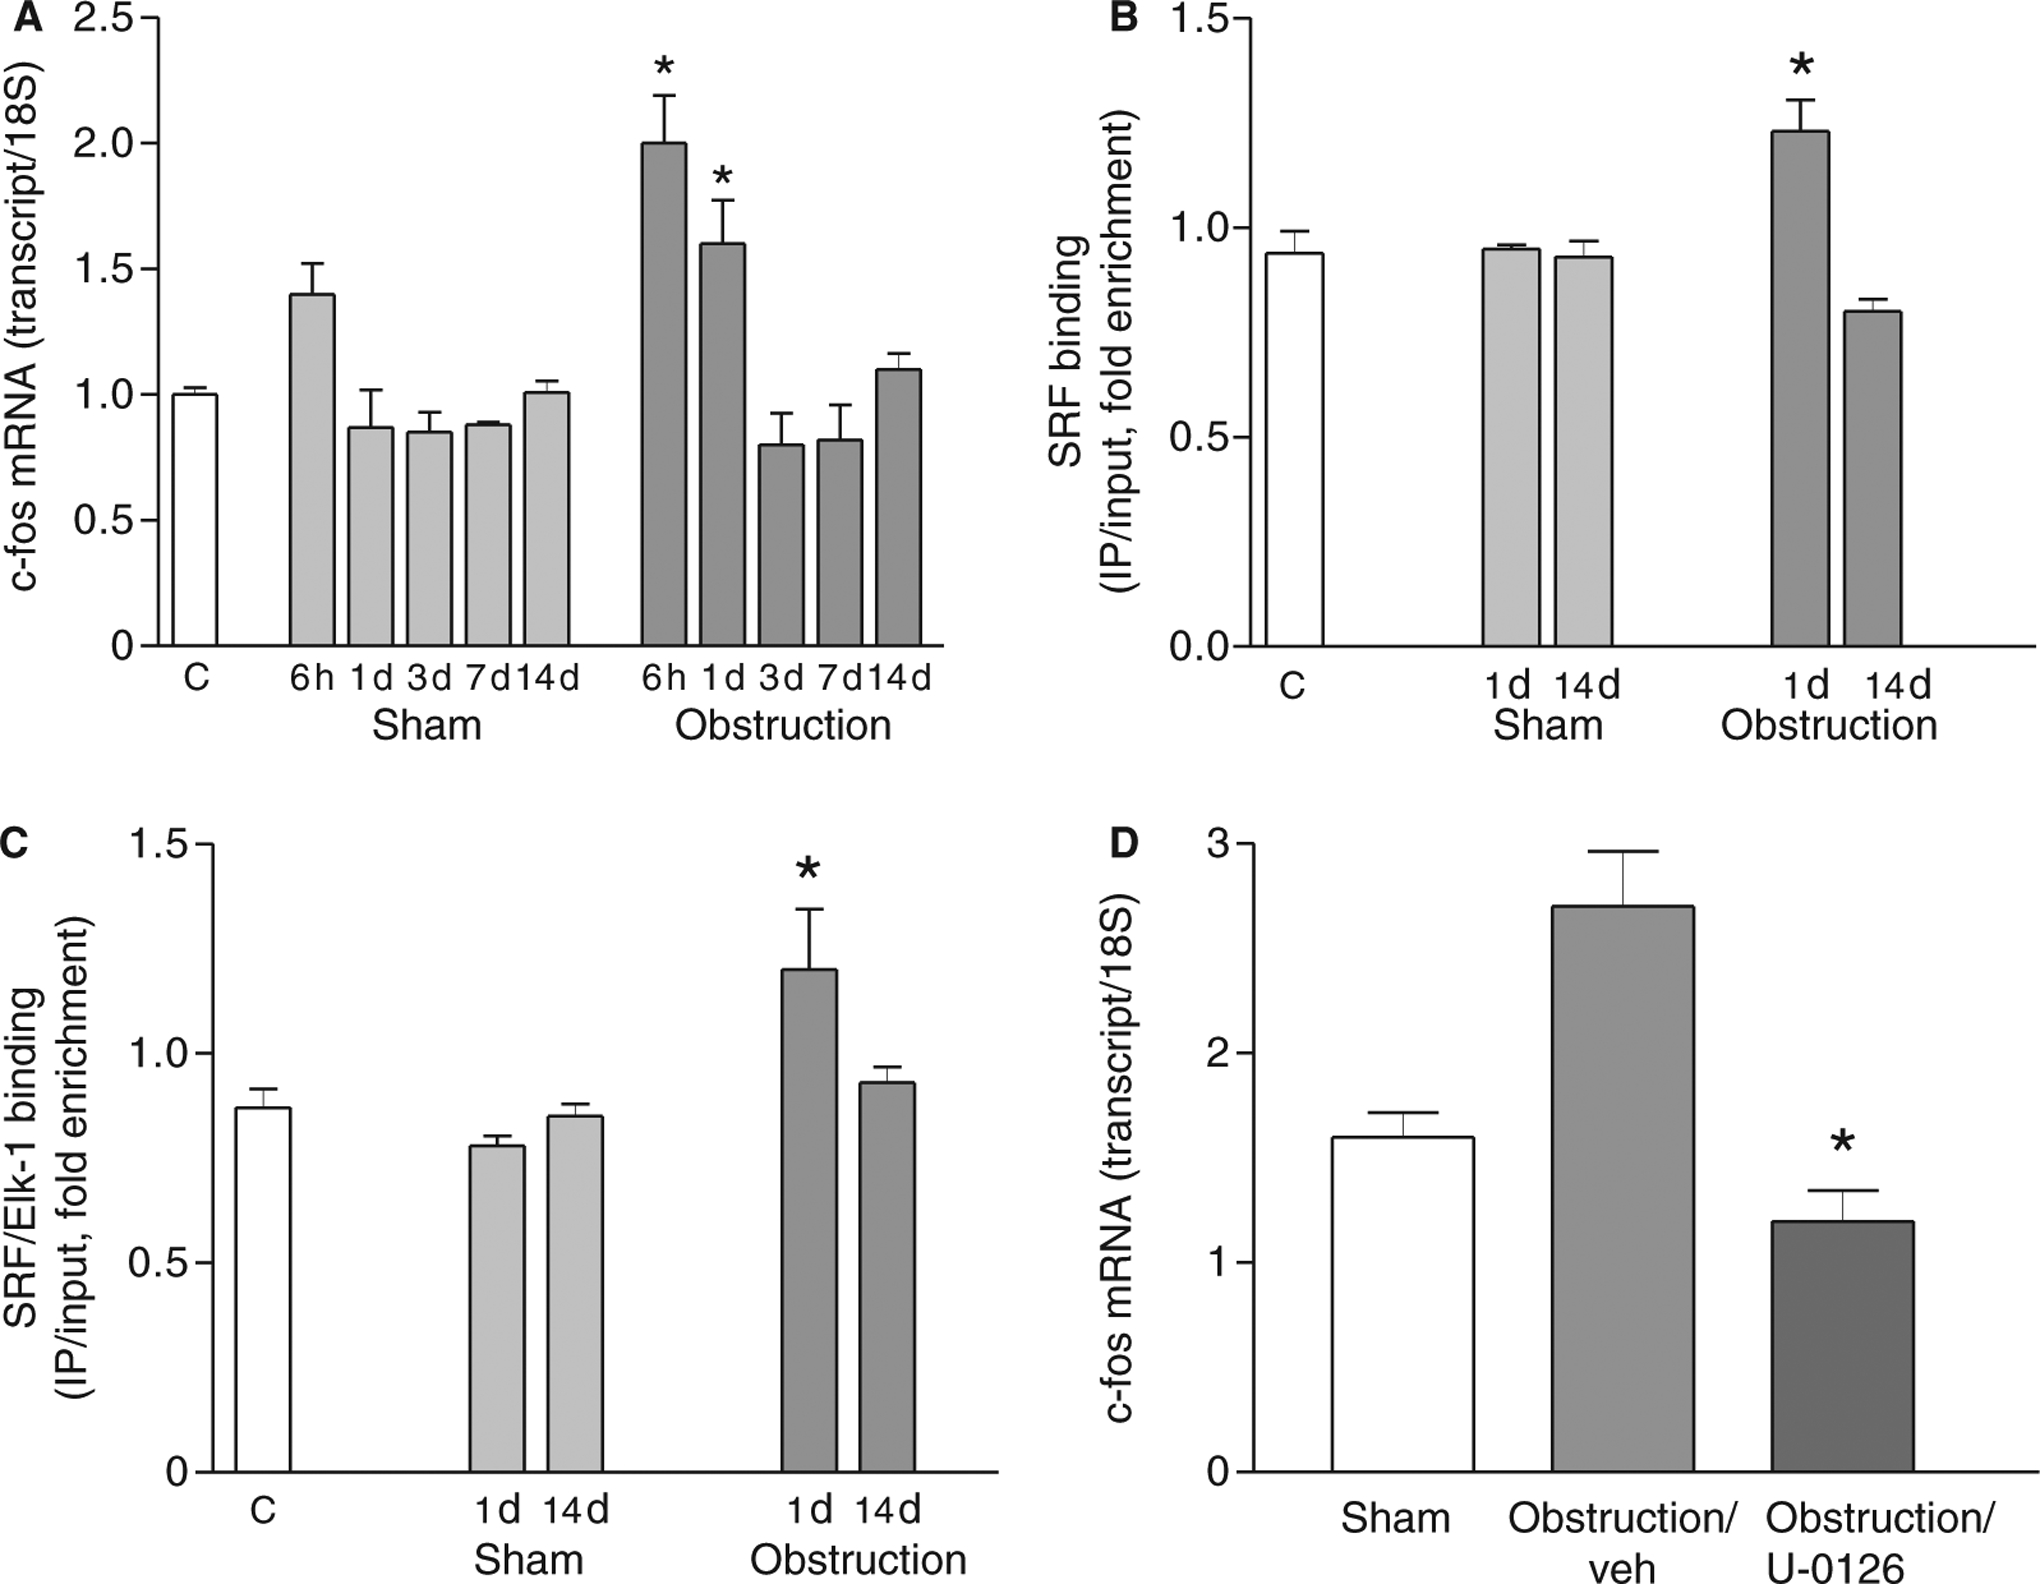
Increased SRF/Elk-1 binding to the c-fos promoter mediates an increase in c-fos expression during the cell proliferation phase. (A) Real-time RT-PCR analysis of c-fos expression (n = 3, mean ± SE, *P < 0.05 compared with corresponding sham-operated time points). (B) ChIP was carried out with anti-SRF antibodies, and the promoter region of c-fos was amplified and quantitated by real-time PCR (n = 3, mean ± SE, *P < 0.05 compared with corresponding sham-operated time points). (C) ChIP was carried out with anti-SRF antibodies, Re-ChIP carried out with anti-Elk-1 antibodies, and the promoter region of c-fos amplified and quantitated by real-time PCR (n = 3, mean ± SE, *P < 0.05 compared with corresponding sham-operated time points). (D) Real-time RT-PCR shows that U-0126 attenuates the up-regulation of c-fos at 6 h post-obstruction (n = 3, mean ± SE, * P < 0.05 compared with obstruction/vehicle).
DISCUSSION
Thickening of the tunica muscularis in the gastrointestinal segment oral to obstruction is a characteristic adaptation of the digestive tract in response to increased functional demands.6 The greatest increase in wall thickness occurs close to the obstruction, and results from both smooth muscle cell hyperplasia and hypertrophy.4 However, the mechanisms regulating the hyperplastic and hypertrophic responses of intestine smooth muscles to lumenal obstruction remain unclear. Our morphological findings indicate that within the smooth muscle layers 10 mm oral to the occlusion ring, smooth muscle cell proliferation primarily occurred during the first 3 days after obstruction, while hypertrophy occurred later. We hypothesized that this phenotypic switching was being driven by transcriptional regulation of proliferative and contractile genes. To address this issue, we examined the expression of smooth muscle MHC, α-actin and γ-actin as phenotypic indicators, by RT-PCR and Western blotting. It should be noted that the Western blotting and ChIP/Re-ChIP results were obtained from 50-mm long segments of smooth muscle, while the morphological and RT-PCR results were obtained from 10-mm long segments of smooth muscle. Other groups have found that the thickness and cell number decreases with increasing distance orally from the occlusion ring, suggesting that the processes of hyperplasia/hypertrophy are not uniform over the entire length of ileum.4 Technical issues prevented us from carrying out the Western blotting, and ChIP/Re-ChIP analyses with 10-mm segments of smooth muscle strips. For Western blot analyses and ChIP assays, the amount of homogenate protein recovered was inadequate. The numbers of mice we would have had to use to obtain sufficient material was projected to be quite large, based on our preliminary Bradford assay analyses. Thus we felt that using the first 50-mm segment was a necessary compromise to allow us to obtain sufficient homogenate protein, but still somewhat correlate with the morphological changes occurring in the smooth muscles oral to the occlusion ring. We did find that smooth muscle MHC, α-actin and γ-actin protein expression correlated with their mRNA expression: both were down-regulated in the first 3 days, recovered to non-operated control levels by about 7 days, and then became up-regulated by 14 days after obstruction. These data suggest that a population of smooth muscle cells switched to a proliferative phenotype during the first 3 days after obstruction. Between 3 and 7 days, the cell number stopped increasing, suggesting that a switch back to a differentiated phenotype occurs. Between 7 and 14 days after obstruction, the thickness of the muscle layer increased, suggesting a switch to a hypertrophic phenotype. These findings suggest that the altered phenotypic composition of small intestine smooth muscle cells plays a role in the altered contractile mechanics and dysmotility of obstructed intestine.
The SRF/CArG box plays a pivotal role in the regulation of smooth muscle-specific gene transcription in vascular smooth muscle.8,9 The close correlation found in this study between smooth muscle MHC, α-actin, and γ-actin expression and SRF binding to smooth muscle MHC and α-actin promoter regions, suggest that SRF/CArG plays an important role in phenotypic switching of intestinal smooth muscles following mechanical obstruction. Several mechanisms of regulating SRF/CArG interactions have been reported, including SRF expression levels,20 SRF alternative splicing,21 SRF interactions with other factors,10–12,22 and chromatin remodelling,23 but the primary mechanism remains unclear. The importance of SRF expression levels for the regulation of phenotypic switching is still not clear. With respect to the proliferative phenotype, Chen et al.24 reported that neointimal SRF protein levels did not change after vascular injury, while Hendrix et al.,25 observed an increase in SRF mRNA levels after vascular injury. A recent study using cultured vascular smooth muscle cells showed that SRF depletion by RNAi suppressed smooth muscle α-actin expression and resulted in increased proliferation.26 Similarly, in our study, SRF expression and binding to smooth muscle MHC and α-actin promoters decreased during the proliferative phase following intestinal obstruction. To date, there are few studies examining SRF expression in smooth muscle hypertrophic or hyper-contractile phenotypes. Chow et al. described increases in smooth muscle MHC, α-actin, and SM22α-expression in the hyper-contractile phenotype of Alzheimer’s cerebral vascular smooth muscle, along with an increase in SRF expression,27 We found that SRF expression levels did not significantly increase during the hypertrophy phase following intestinal obstruction. However, SRF binding to smooth muscle MHC and α-actin promoters did significantly increase as the expression of smooth muscle MHC, α-actin and γ-actin increased during the hypertrophy phase. These findings suggest that increased SRF binding to smooth muscle-specific gene promoters is important for the development of the hypertrophic phenotype. However, we cannot exclude the possibility that the overall SRF levels might reflect an up-regulation of SRF in hypertrophic cells and a down-regulation in proliferative cells, as a slight increase in smooth muscle cell number was still observed at 14 days post-obstruction. In addition, although it has been reported that SRF nuclear translocation plays a role in airway myocyte phenotypic switching,28 we found SRF to be constitutively localized to the nuclei of small intestine smooth muscle cells.
Myocardin is the co-activator of SRF-dependent transcription of multiple smooth- and cardiac muscle-specific genes24,29 Decreased myocardin expression is associated with smooth muscle cell proliferation, while increased expression is associated with differentiation.11,25,27,28 We found that myocardin expression decreased during the proliferative phase and increased during the hypertrophic phase in obstructed small intestine smooth muscles. These changing levels of myocardin expression corresponded to the changing expression levels of smooth muscle MHC, α-actin and γ-actin, suggesting that, during the response of intestine smooth muscles to obstruction, both proliferative and hypertrophic phenotypic switching may be regulated by myocardin expression levels, which influence its interaction with SRF. However, because of a lack of suitable myocardin antibodies, we could not analyse the interaction between myocardin and SRF by Co-IP, ChIP or Re-ChIP.
Elk-1 binding to the ETS site facilitates ternary complex formation between Elk-1 and SRF, competing with myocardin for a common SRF docking site and suppressing transcription of smooth muscle contractile genes.10,17 In our study, Re-ChIP assays revealed a transient increase in Elk-1 binding to SRF-bound smooth muscle MHC and α-actin promoters during the proliferative phase. As Elk-1 activity is increased by ERK-dependent phosphorylation, we examined the effect of U-0126, a pharmacological inhibitor of the upstream ERK-activating kinases MEK1 and MEK218 on smooth muscle MHC and α-actin message levels. U-0126 reversed the down-regulation of these genes during the proliferative phase following partial obstruction of the small intestine. These results suggest that phosphorylated Elk-1 further decreases SRF-dependent smooth muscle MHC and α-actin transcription via an increased interaction with SRF. These findings suggest that in addition to the down-regulation of myocardin and SRF expression, small intestine smooth muscle contractile protein expression is also inhibited during the proliferative phase by increased Elk-1 activity. Because Elk-1 phosphorylation is ERK-dependent, the phenotypic switching to the proliferative phase may be mediated via the MAP-kinase pathway. In addition to muscle wall thickening, the small intestine distends oral to the mechanical obstruction.4 Interestingly, previous reports have implicated stretch-dependent MAP-kinase activation in smooth muscles, suggesting a possible mechanism by which obstruction-induced remodelling may be initiated in intestinal smooth muscles.30
KLF4 and KLF5 are Kruppel-like transcription factor family members which are associated with smooth muscle cell proliferation.11,19,31–33 KLF4 and KLF5 repress the expression of multiple smooth muscle-specific genes via a combination of effects including inhibition of SRF binding to intact chromatin, suppression of myocardin expression, and suppression of myocardin-induced gene activation.8 In our study, we found that KLF4 and KLF5 mRNA levels increased during the cell proliferation phase after obstruction, but also increased in small intestine smooth muscles from sham-operated controls, indicating that the surgical manipulation induced KLF4 and KLF5 up-regulation. However, the decreased KLF4 and KLF5 expression during the hypertrophic phase implies that KLF4 and KLF5 play a role in the switching of small intestine smooth muscles to the hypertrophic phenotypic in response to mechanical obstruction. However, whether KLF4 and KLF5 exert their influence through SRF/CArG-dependent transcription requires further investigation.
In addition to regulating the expression of smooth muscle contractile proteins, the expression of immediate early growth-response genes such as c-fos is also SRF/CArG dependent.9 Consistent with the increase in smooth muscle cell number, c-fos mRNA levels increased during the proliferation phase after obstruction. ChIP and Re-ChIP assays revealed that the increase in c-fos expression was associated with increased SRF binding to the c-fos promoter, and increased Elk-1 binding to SRF. Furthermore, inhibition of Elk-1 phosphorylation attenuated the up-regulation of c-fos expression. These results suggest that the interaction between phosphorylated Elk-1 and SRF may be a key factor for SRF-dependent c-fos transcription and smooth-muscle cell proliferation. However, as mentioned above, SRF expression decreased during the smooth-muscle cell proliferative phase. The reason for these conflicting results is unclear. One possible explanation is that increased Elk-1 binding to c-fos promoter-bound SRF offsets decreased SRF expression. Interestingly, SRF depletion by RNAi induces vascular smooth-muscle cell proliferation.26 This effect was attributed to the release of the suppressive effect of SRF on c-jun expression, providing another possible mechanism by which decreased SRF expression could lead to smooth-muscle proliferation. However, our results should be interpreted with caution because, unlike a cell culture system, our in vivo model of small intestine smooth muscle phenotypic switching involves a heterogeneous system containing visceral smooth muscle cells and non-smooth muscle cells. We cannot exclude the possibility that c-fos over-expression is due to a subset of smooth muscles that overexpress SRF, or from non-smooth muscle cells, as early growth-responsive genes are ubiquitously expressed, unlike the restricted expression of smooth muscle-specific genes.
In summary, our findings suggest that smooth muscle switching between differentiated, proliferative and hypertrophic phenotypes plays an important role in the development of small bowel dysmotility induced by partial bowel obstruction. Understanding the molecular mechanisms underlying smooth muscle cell phenotypic switching in response to mechanical obstruction will aid in understanding the mechanistic basis for the loss of functional efficiency that is characteristic of the bowel obstruction.3,5,6 SRF/CArG-dependent transcription of smooth muscle specific genes may play a pivotal role in intestinal smooth muscle phenotypic switching, which may be regulated by SRF expression levels, and the interactions between SRF, myocardin, Elk-1 and/or other related factors. However, further work is needed to clarify the mechanisms which regulate the phenotypic switching of small intestine smooth muscle cells by these transcription factors in response to bowel obstruction.
ACKNOWLEDGMENTS
This study was supported by National Institutes of Health grants P20 RR-18751 (BAP, KMS) and PO1 DK41315 (KMS).
Abbreviations:
- CArG
CC(A/T)6GG
- ChIP
chromatin immunoprecipitation
- DART-PCR
data analysis for real-time PCR
- MHC
myosin heavy chain
- SRF
serum response factor
REFERENCES
- 1.Chitkara DK, Di LC. From the bench to the ‘crib’-side: implications of scientific advances to paediatric neurogastroenterology and motility. Neurogastroenterol Motil 2006; 18: 251–62. [DOI] [PubMed] [Google Scholar]
- 2.Jones MP, Wessinger S. Small intestinal motility. Curr Opin Gastroenterol 2006; 22: 111–6. [DOI] [PubMed] [Google Scholar]
- 3.Gabella G Hypertrophy of visceral smooth muscle. Anat Embryol (Berl) 1990; 182: 409–24. [DOI] [PubMed] [Google Scholar]
- 4.Chang IY, Glasgow NJ, Takayama I, Horiguchi K, Sanders KM, Ward SM. Loss of interstitial cells of Cajal and development of electrical dysfunction in murine small bowel obstruction. J Physiol 2001; 536: 555–68. [DOI] [PMC free article] [PubMed] [Google Scholar]
- 5.Storkholm JH, Zhao J, Villadsen GE, Hager H, Jensen SL, Gregersen H. Biomechanical remodeling of the chronically obstructed Guinea pig small intestine. Dig Dis Sci 2007; 52: 336–46. [DOI] [PubMed] [Google Scholar]
- 6.Bertoni S, Gabella G, Ghizzardi P et al. Motor responses of rat hypertrophic intestine following chronic obstruction. Neurogastroenterol Motil 2004; 16: 365–74. [DOI] [PubMed] [Google Scholar]
- 7.Owens GK, Kumar MS, Wamhoff BR. Molecular regulation of vascular smooth muscle cell differentiation in development and disease. Physiol Rev 2004; 84: 767–801. [DOI] [PubMed] [Google Scholar]
- 8.Kawai-Kowase K, Owens GK. Multiple repressor pathways contribute to phenotypic switching of vascular smooth muscle cells. Am J Physiol Cell Physiol 2007; 292: C59–69. [DOI] [PubMed] [Google Scholar]
- 9.Miano JM. Serum response factor: toggling between disparate programs of gene expression. J Mol Cell Cardiol 2003; 35: 577–93. [DOI] [PubMed] [Google Scholar]
- 10.Wang Z, Wang DZ, Hockemeyer D, McAnally J, Nordheim A, Olson EN. Myocardin and ternary complex factors compete for SRF to control smooth muscle gene expression. Nature 2004; 428: 185–9. [DOI] [PubMed] [Google Scholar]
- 11.Liu Y, Sinha S, McDonald OG, Shang Y, Hoofnagle MH, Owens GK. Kruppel-like factor 4 abrogates myocardin-induced activation of smooth muscle gene expression. J Biol Chem 2005; 280: 9719–27. [DOI] [PubMed] [Google Scholar]
- 12.Liu ZP, Wang Z, Yanagisawa H, Olson EN. Phenotypic modulation of smooth muscle cells through interaction of Foxo4 and myocardin. Dev Cell 2005; 9: 261–70. [DOI] [PubMed] [Google Scholar]
- 13.Bertoni S, Gabella G. Hypertrophy of mucosa and serosa in the obstructed intestine of rats. J Anat 2001; 199: 725–34. [DOI] [PMC free article] [PubMed] [Google Scholar]
- 14.Kim M, Cho SY, Han IS, Koh SD, Perrino BA. CaM kinase II and phospholamban contribute to caffeine-induced relaxation of murine gastric fundus smooth muscle. Am J Physiol Cell Physiol 2005; 288: C1202–10. [DOI] [PubMed] [Google Scholar]
- 15.Peirson SN, Butler JN, Foster RG. Experimental validation of novel and conventional approaches to quantitative real-time PCR data analysis. Nucleic Acids Res 2003; 31: e73. [DOI] [PMC free article] [PubMed] [Google Scholar]
- 16.Wang X, Seed B. A PCR primer bank for quantitative gene expression analysis. Nucleic Acids Res 2003; 31: e154. [DOI] [PMC free article] [PubMed] [Google Scholar]
- 17.Buchwalter G, Gross C, Wasylyk B. Ets ternary complex transcription factors. Gene 2004; 324: 1–14. [DOI] [PubMed] [Google Scholar]
- 18.Favata MF, Horiuchi KY, Manos EJ et al. Identification of a novel inhibitor of mitogen-activated protein kinase kinase. J Biol Chem 1998; 273: 18623–32. [DOI] [PubMed] [Google Scholar]
- 19.Black AR, Black JD, zizkhan-Clifford J. Sp1 and kruppel-like factor family of transcription factors in cell growth regulation and cancer. J Cell Physiol 2001; 188: 143–60. [DOI] [PubMed] [Google Scholar]
- 20.Hirschi KK, Lai L, Belaguli NS, Dean DA, Schwartz RJ, Zimmer WE. Transforming growth factor-beta induction of smooth muscle cell phenotpye requires transcriptional and post-transcriptional control of serum response factor. J Biol Chem 2002; 277: 6287–95. [DOI] [PMC free article] [PubMed] [Google Scholar]
- 21.Kemp PR, Metcalfe JC. Four isoforms of serum response factor that increase or inhibit smooth-muscle-specific promoter activity. Biochem J 2000; 3: 445–51. [PMC free article] [PubMed] [Google Scholar]
- 22.Yin F, Herring BP. GATA-6 can act as a positive or negative regulator of smooth muscle-specific gene expression. J Biol Chem 2005; 280: 4745–52. [DOI] [PubMed] [Google Scholar]
- 23.Manabe I, Owens GK. Recruitment of serum response factor and hyperacetylation of histones at smooth muscle-specific regulatory regions during differentiation of a novel P19-derived in vitro smooth muscle differentiation system. Circ Res 2001; 88: 1127–34. [DOI] [PubMed] [Google Scholar]
- 24.Chen J, Kitchen CM, Streb JW, Miano JM. Myocardin: a component of a molecular switch for smooth muscle differentiation. J Mol Cell Cardiol 2002; 34: 1345–56. [DOI] [PubMed] [Google Scholar]
- 25.Hendrix JA, Wamhoff BR, McDonald OG, Sinha S, Yoshida T, Owens GK. 5′ CArG degeneracy in smooth muscle alpha-actin is required for injury-induced gene suppression in vivo. J Clin Invest 2005; 115: 418–27. [DOI] [PMC free article] [PubMed] [Google Scholar]
- 26.Kaplan-Albuquerque N, Van PV, Weiser-Evans MC, Nemenoff RA. Depletion of serum response factor by RNA interference mimics the mitogenic effects of platelet derived growth factor-BB in vascular smooth muscle cells. Circ Res 2005; 97: 427–33. [DOI] [PubMed] [Google Scholar]
- 27.Chow N, Bell RD, Deane R et al. Serum response factor and myocardin mediate arterial hypercontractility and cerebral blood flow dysregulation in Alzheimer’s phenotype. Proc Natl Acad Sci U S A 2007; 104: 823–8. [DOI] [PMC free article] [PubMed] [Google Scholar]
- 28.Camoretti-Mercado B, Liu HW, Halayko AJ et al. Physiological control of smooth muscle-specific gene expression through regulated nuclear translocation of serum response factor. J Biol Chem 2000; 275: 30387–93. [DOI] [PubMed] [Google Scholar]
- 29.Pipes GC, Creemers EE, Olson EN. The myocardin family of transcriptional coactivators: versatile regulators of cell growth, migration, and myogenesis. Genes Dev 2006; 20: 1545–56. [DOI] [PubMed] [Google Scholar]
- 30.Oldenhof AD, Shynlova OP, Liu M, Langille BL, Lye SJ. Mitogen-activated protein kinases mediate stretch-induced c-fos mRNA expression in myometrial smooth muscle cells. Am J Physiol Cell Physiol 2002; 283: C1530–9. [DOI] [PubMed] [Google Scholar]
- 31.Bieker JJ. Kruppel-like factors: three fingers in many pies. J Biol Chem 2001; 276: 34355–8. [DOI] [PubMed] [Google Scholar]
- 32.McDonald OG, Wamhoff BR, Hoofnagle MH, Owens GK. Control of SRF binding to CArG box chromatin regulates smooth muscle gene expression in vivo. J Clin Invest 2006; 116: 36–48. [DOI] [PMC free article] [PubMed] [Google Scholar]
- 33.Fujiu K, Manabe I, Ishihara A et al. Synthetic retinoid Am80 suppresses smooth muscle phenotypic modulation and in-stent neointima formation by inhibiting KLF5. Circ Res 2005; 97: 1132–41. [DOI] [PubMed] [Google Scholar]