

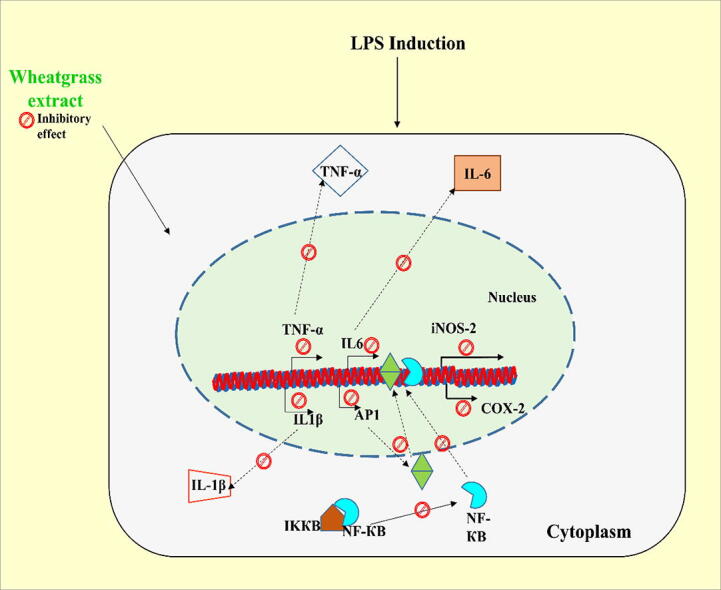
Graphical abstract
Keywords: Wheatgrass, Lipopolysaccharide, RAW 264.7 cells, Anti-inflammatory effect, iNOS-2, COX-2
Highlights
-
•
Wheatgrass extract inhibits production of nitric oxide and reactive oxygen species.
-
•
Wheatgrass extract inhibits production of pro-inflammatory and inflammatory markers.
-
•
Molecular docking suggests inhibition of COX-2 by major metabolites of wheatgrass.
Abstract
Inflammation is a multifaceted set of cellular communications generated against foreign infection, toxic influence or autoimmune injury. The present study investigates the anti-inflammatory effect of wheatgrass extract against the harmful impact of lipopolysaccharide (LPS) in macrophage cells, i.e., RAW 264.7 cells. Our results indicate that 5- and 7- days old wheatgrass extracts inhibit the LPS-stimulated production of nitric oxide. Moreover, wheatgrass extract significantly downregulates the mRNA expression of LPS-stimulated various pro-inflammatory markers, tumor necrosis factor-α, interleukin-6, interleukin-1β, AP-1 and also iNOS-2 and COX-2. Our flow cytometry analyses confirmed that wheatgrass extract prevents the generation of reactive oxygen species in LPS-stimulated RAW 264.7 cells, thus arresting oxidative stress in cells. The immunoblot analyses also confirmed a significant reduction in the expression of inflammatory proteins, namely, iNOS-2 and COX-2, in wheatgrass extract-treated cells, compared to LPS-stimulated condition. The NF-κB transactivation assay further confirmed the inhibitory effect of wheatgrass extracts on the LPS-stimulated expression of NF-κB. Molecular docking based studies showed the plausible binding of two significant wheatgrass constituents, i.e., apigenin and myo-inositol with COX-2 protein, with binding energies of −10.59 kcal/mol and −7.88 kcal/mol, respectively. Based on the above results, wheatgrass may be considered as a potential therapeutic candidate for preventing inflammation.
1. Introduction
Inflammation is a physio-pathological condition involving nitric oxide synthase (NOS) regulating a central role. NOS exists in three isomeric forms, neuronal NOS (nNOS, NOS1), endothelial NOS (eNOS, NOS3) (both expressed constitutively) and inducible NOS (iNOS, NOS2) (expressed in both physiological and pathophysiological conditions) (Förstermann and Sessa, 2012). In the presence of inflammatory stimuli, various cells associated with innate immune response, such as macrophages, hepatocytes, astrocytes, keratinocytes, produce iNOS enzyme in considerably high amounts. NOS enzyme is responsible for catalytic conversion of amino acid L-arginine into L-citrulline and nitric oxide (NO) as gaseous radical. NO is an essential chemical compound, which plays a critical role in many inflammation steps (Sharma et al., 2007, Murakami and Ohigashi, 2007). The increase in NO production leads to the onset and development of various diseased conditions like sepsis, colitis, psoriasis, arthritis, multiple sclerosis, type I diabetes and cancer (Clancy et al., 1998, Tripathi et al., 2020, Gantner et al., 2020, Fukumura et al., 2006, Cheng et al., 2014).
In our body, inflammation and immune response generate cell–cell communication mediated by various cytokines. Macrophages and monocytes are major producers of cytokines, namely, Tumor necrosis factor-α (TNF-α), interleukin (IL)-1 and IL-6 and others, which play a prominent role in developing inflammatory state in our body (Dallegri and Ottonello, 2002). The outer membrane of gram-negative bacteria contains lipopolysaccharide (LPS) as its principal component. LPS generates inflammatory stimuli in macrophages through activation of the canonical NF-κB pathway (Zhang and Sun, 2015). NF-κB acts as a transcription factor and leads to enhanced expression of pro-inflammatory mediators like interferon (IFN-γ), IL-6, IL-1β, TNF-α and inflammatory proteins like iNOS-2 and cyclooxygenase COX-2 (An et al., 2006, Liu et al., 2017). COX-2 is a constitutively expressed protein, which imparts a significant role as another key mediator in inflammation. COX-2 reportedly converts arachidonic acid to prostaglandin (PG), dilating blood vessels and enhancing microvascular permeability (Sato et al., 2020, Nakanishi and Rosenberg, 2013). Activator protein-1 (AP-1) is another prominent transcription factor involved in generating inflammatory responses (Raivich and Behrens, 2006, Renoux et al., 2020) and its active phosphorylated form has been reported to support the enhanced expression of inflammatory cytokines (Kawai and Akira, 2007).
Wheat (Triticum L.) is considered among the ‘top three’ cereal crops (Shewry, 2009). The young grass of the common wheat plant is considered as wheatgrass. Wheatgrass is a rich source of various flavonoids, particularly apigenin, with anti-oxidant and anti-carcinogenic potentials (Funakoshi-Tago et al., 2011, Patel et al., 2007). Vitamin-C (ascorbic acid) and vitamin-E are other major nutrients present in fresh wheatgrass juice and have been reported to possess anti-oxidant and anti-cancer properties (Gore et al., 2017, Shakya et al., 2018, Suhail et al., 2012). The current forms of wheatgrass consumption include fresh juice, frozen juice, tablets, and powders, with compositions varying according to their production processes and growing conditions (Avisar et al., 2020). The wheatgrass juice contains 70% of chlorophyll among its total constituents. The structure of chlorophyll resembles human blood hemoglobin, and its potential to increase hemoglobin level in blood makes wheatgrass juice popularly known as “green blood”. Chlorophyll and its metallo-chlorophyll derivatives have also been reported to possess anti-oxidant properties, while its metal-free counterparts do not impart significant anti-oxidant properties (Ferruzzi et al., 2002). The dietary derivatives of chlorophyll especially chlorophyll a and b, and their active constituent phytol have been reported to show anti-inflammatory, anti-mutagenic and mutagen trapping properties (Ferruzzi et al., 2002, Carvalho et al., 2020, Ferruzzi and Blakeslee, 2007).
Based on this information, it was critical to determine the potential of wheatgrass extract as an anti-inflammatory agent. This study investigates the medicinal potential of wheatgrass extract in inhibiting NO and its synthase (NOS) production and different cytokines generated in LPS-stimulated RAW 264.7 macrophages.
2. Material and methods
2.1. Plant material and extraction
The wheatgrass used in the study was grown in the herbal garden at the Indian Institute of Technology Roorkee, Roorkee, Uttarakhand, India. For this procedure, similar size single cultivar (Sharbati variety) wheat grains were selected and sowed in pots with soil-rite. The ambient amount of water was provided regularly. The radicle emergence generally occurs after 2 to 3 days of sowing (Virdi et al., 2020). The emergence of embryonic shoot from seed was considered as day 1 for wheatgrass germination. Successively, the seedlings were grown and harvested after the completion of day 5 and day 7. The non-germinated seeds were discarded and not included as part of the study. The harvested stem part, considered as wheatgrass, was washed in distilled water for a brief period of 2 to 3 min to remove dirt particles and appropriately shade dried for 30 min to remove water traces using absorbent paper (Al-Awaida et al., 2020). Then the wheatgrass was ground to a fine powder in liquid nitrogen.
Methanol was used as a solvent to prepare the wheatgrass extract. Briefly, the finely crushed wheatgrass was extracted with methanol (1:4, w/v) thrice. The extract supernatant was evaporated under vacuum at room temperature to dryness as dark green mass using a vacuum concentrator (Eppendorf Concentrator Plus™, Hamburg, Germany). All the samples were stored at −80 °C until used. Dimethyl sulfoxide DMSO (Cat. No. TC185, Himedia, Mumbai, India) was used to reconstitute the dried extracts. The prepared solution was filtered using a 0.2 µm filter (Axiva Sichem Biotech, Haryana, India) before use in cell culture analyses and employed at a 0.1% v/v ratio during the investigation. The day 5 and day 7 wheatgrass extracts were henceforth designated as W5 and W7, respectively.
2.2. Phytochemical evaluation
The major phenolic acids and flavonoids present in the wheatgrass were analyzed by high-performance liquid chromatography (HPLC). For this, freshly harvested wheatgrass (~1 g) was crushed in liquid nitrogen and then macerated with 4 ml of methanol followed by the addition of 40 µl of 1 N HCl. The mixture was then kept in a shaking incubator overnight (~12 h) at room temperature (~27 °C). Thereafter, the mixture was centrifuged at 14,000×g for 15 min, and the supernatant was collected. The collected supernatant was immediately analyzed by HPLC for the separation and quantification of major phenolics and flavonoids. The HPLC analyses were carried out on a Waters HPLC system consisting of a 1525 binary pump and 2998 photodiode array (PDA) detector (Waters, Milford, MA, USA). The PDA detector was set at 198–700 nm for recording chromatograms. Chromatographic separation was performed on C18 reversed-phase column Sunfire (250 × 4.6 mm, 5.0 µm) from Waters (Milford, MA, USA). The gradient mobile phase, consisting of acetonitrile and acidified water (0.08% trifluoroacetic acid), was used to separate analytes at a flow rate of 0.7 ml/min. The sample injection volume was 20 µl. Data acquisition and analyses were performed by Empower 3 Software from Waters (Milford, MA, USA). The gradient elution was performed by varying the proportion of solvent B to solvent A. The gradient elution was changed from 5% to 10% B for a duration of 27 min, from 10 to 40% B in 75 min, after that it was ran in a linear fashion for 5 min from 75 to 80 min followed by increasing from 40 to 100% B in 82 min. After this it was ran in a linear fashion for 6 min from 82 to 89 min. After that, it decreased to 10% in 90 min, and finally, it drops from 10% to 5% in 97 min. The entire HPLC chromatograms were monitored at 280 nm. The metabolites were identified by matching their retention time and UV spectrum with those of authentic standards.
2.3. Cell culture
RAW 264.7 (murine macrophage) cell line was purchased from National Center for Cell Sciences, Pune, India. Dulbecco’s Modified Eagle Medium (DMEM) high glucose (Cat. No. AT-007, Himedia, Mumbai, India) supplemented with 10% fetal bovine serum (Cat. No. 11573397) and 1% antibiotic–antimycotic solution (Cat. No. 15240062) (both from GIBCO, Life Technologies Corporation, Grand Island, NY, USA) was used to culture the cells. An incubator held at 37 °C and supplied with 5% CO2 was used to maintain the cells.
2.4. Cell viability assay
The cytotoxic evaluation of W5 and W7 on RAW 264.7 cells was assessed by MTT [3-(4,5-dimethylthiazol-2-yl)-2,5-diphenyl tetrazolium bromide] assay. Briefly, 5,000 cells were seeded in each well of 96 wells plate with 200 µl of media to form a monolayer. Then each well was supplemented with different concentrations of W5 and W7 (50, 100 and 200 µg/ml) in the presence of LPS (1 µg/ml in DMSO) (LPS, Cat. No. O127: B8, Sigma, St. Louis, MO, USA). The DMSO treated cells (0.1% v/v) were considered as control. Only LPS treated cells (1 µg/ml) were considered as disease control in this study. After 24 h, every well was supplemented with 20 µl of MTT dye (5 mg/ml in PBS) (Cat. No. TC191, Himedia, Mumbai, India), and the cells were incubated for another 4 h in an incubator. The media in each well was then replaced with an equivalent volume of DMSO to dissolve the formazan crystals. The absorbance was finally evaluated using a microplate plate-reader (FLUOstar Omega, BMG Labtech, Germany) to determine the cell viability. The cell viability was determined using the following formula
2.5. Nitrite measurement
RAW 264.7 cells were cultured at 1X10⁶ cells/well in a 6-well plate. The cells were then treated with or without LPS (1 µg/ml) along with different concentrations of W5 and W7 (100 and 200 µg/ml) for 12 h. The nitrite levels in the culture media under different conditions were determined spectrophotometrically using Griess reagent (Cat. No. 35657, SRL Pvt. Ltd., Mumbai, India). Briefly, 100 µl of cell culture media was added to 100 µl of Griess reagent. The mixture was appropriately mixed and further incubated for 10 min in dark conditions at room temperature. Absorbance was then measured at 540 nm using a plate-reader (FLUOstar Omega, BMG Labtech, Germany). The sodium nitrite standard curve was used to determine the concentration of nitrite in media for different treatment conditions.
2.6. Measurement of intracellular reactive oxygen species (ROS) production
The intracellular ROS level in RAW 274.7 cells in the absence and presence of LPS (1 µg/ml) with different concentrations of W5 and W7 extracts were measured using 2, 7-dichloro dihydro fluorescein diacetate (DCFDA) dye (Cat. No. D6883, Sigma, St. Louis, MO, USA). Briefly, 5 × 10⁶ cells were treated under similar conditions as mentioned previously for 12 h. The cells treated with H2O2 (1 µM) for 30 min were considered positive control for the analysis. After treatment, gentle washing of cells with PBS was performed, and then the cells were incubated with DCFDA (10 µM) for 10 min. The cells were then re-washed and harvested in PBS for ROS measurement by flow cytometry using FACS Calibur flow cytometer (BD Biosciences, San Jose, CA, USA). The data was collected using CELL Quest software (BD Biosciences, San Jose, CA, USA). The measurement was performed with the excitation and emission wavelengths at 488 nm and 525 nm, respectively.
2.7. RNA isolation and polymerase chain reaction (PCR) analysis
RAW 264.7 cells were cultured at 1 × 10⁶ cells/well in a 6-well plate under similar conditions described previously, for 12 h. After that, the total RNA was isolated using RNA XPress reagent (Himedia, Mumbai, India) according to the manufacturer’s instructions. For the PCR analyses, 2 µg of RNA from each treatment was first reverse-transcribed to cDNA. The PCR conditions and primer sequences of analyzed genes are mentioned in Table 1. The PCR products were then separated on a 2% agarose gel and visualized using a gel documentation system (BioRad, Waltham, CA, USA). The band intensities were analyzed using ImageJ 1.52a software (NIH, MD, USA) and normalized to β-actin.
Table 1.
List of primers used in semi-quantitative PCR.
| Gene | Forward Primer (5′–3′) | Reverse Primer (5′–3′) | Annealing Temp (°C) | Product Length (bp) |
|---|---|---|---|---|
| TNF-α (>NM_013693.3) | CCACGTCGTAGCAAACCACC | TACAACCCATCGGCTGGCAC | 61.3 | 126 |
| IL-6 (>NM_031168.2) | GTCCTTCCTACCCCAATTTCCA | TAACGCACTAGGTTTGCCGA | 58.6 | 154 |
| IL-1β (>NM_008361.4) | GCCACCTTTTGACAGTGATGAG | TGATACTGCCTGCCTGAAGC | 59.6 | 163 |
| AP-1 (>NM_010591.2) | TGAGTGACCGCGACTTTTCA | GCATCGTCGTAGAAGGTCGT | 58.3 | 305 |
| iNOS-2 (>NM_001313922.1) | AATGGCAACATCAGGTCGGCCATCACT | GCTGTGTGTCACAGAAGTCTCGAACTC | 65.8 | 454 |
| COX-2 (>NM_011198.4) | CATCCCCTTCCTGCGAAGTT | CATGGGAGTTGGGCAGTCAT | 59.3 | 178 |
| β-Actin (>NM_007393.5) | TCACCCACACTGTGCCCCATCTACGA | CAGCGGAACCGCTCATTGCCAATGG | 65 | 298 |
2.8. Western blot analysis
The cell lysates from similar treatment conditions for western blot analysis were prepared after harvesting cells in RIPA lysis buffer supplemented with 1X protease inhibitor cocktail both from Himedia (Mumbai, India). Total protein (40 µg) samples were analyzed on 8%-10% polyacrylamide gel (depending upon the size) followed by immunoblot analyses. The proteins were transferred onto the PVDF membrane using a semi-dry blot, and then the membranes were blocked using 3% bovine serum albumin (BSA) in TBST buffer (20 mM Tris-Cl, pH 7.5, 150 mM sodium chloride, 0.05% Tween-20) for 2 h. The membranes were then incubated overnight at 4 °C in TBST buffer supplemented with primary anti- NOS2 (Cat. No. ABP51974, Abbkine Scientific Co., Ltd., Wuhan China), COX-2 (Cat. No. sc-376861) and β-actin (Cat. No. sc-47778) (Santa Cruz Biotechnology, Dallas, TX, USA) (1:1000) antibodies. The blots were then washed twice with TBST buffer and then incubated at room temperature for another 4 h with horseradish peroxidase (HRP) conjugated anti-rabbit secondary antibody (Cat No. sc-2357) (1:10,000) (Santa Cruz Biotechnology Inc., TX, USA). The color was then developed in dark using the ECL reagent (Cat. No. 1705060, Bio-Rad Laboratories, Waltham, CA, USA). β-Actin was used as an internal control.
2.9. Luciferase assay for NF-κB transcriptional activity analysis
The anti-inflammatory activity of W5 and W7 extracts were further analyzed by NF-κB promoter transactivation assay using luciferase reporter gene. For this assay, RAW 264.7 cells were co-transfected with a p-NF-κB-Luc reporter, containing mammalian NF-κB response element in its promoter region, and β-gal plasmids (both procured from Promega Corporation, Madison, WI, USA), where the latter was used as an internal control. The transient transfection was performed at 3:1 ratio of both plasmids using Ultra293 transfection reagent following the manufacturer’s protocol (Cat. No. MB506, GeneDireX Inc., Taoyuan, Taiwan). After 24 h of transfection, the cells were treated with different concentrations of W5 and W7 extracts in the presence of LPS for another 12 h. Only DMSO treated transfected cells were considered as vehicle control. On completion of the treatment, the cells were lysed with lysis buffer. Luciferin was used as a substrate to measure the luminescence using a microplate reader (FLUOstar Omega, BMG Labtech, Germany). Each experiment was repeated three times. The values of luciferase activities were normalized to β–gal activity. The luciferase activity in W5 and W7 treated cells was expressed as unit fold induction in luciferase activity compared to the vehicle-treated control group.
2.10. Molecular docking study
To further investigate the possible interaction of COX-2 with the major constituents of wheatgrass extract (apigenin and myo-inositol), molecular docking based computational studies were performed. The COX-2 (PBD ID: 3NT1, Resolution 1.7 Å) (Duggan et al., 2010) was used for docking studies involving Autodock 4.2 from ADT tools (Morris et al., 2009). The ligands (apigenin and myo-inositol) and the macromolecule (COX-2) were prepared using Autodock tools from MGL labs. The grid maps were designed using 60 × 60 × 60 grid points with 0.375 Å spacing in x, y and z directions centered at the active site of COX-2, and all other parameters were used as default. One hundred docked structures, i.e., 100 runs, were generated using the Lamarckian Genetic Algorithm. The docking analyses were performed by converting the docked conformations into pdbqt format. The best predicted binding poses were determined based on cluster analysis and binding affinities. Chimera tool was used for visualization and figure generations (Pettersen et al., 2004). The 2D interaction diagrams were generated using LigPlot plus tool (Laskowski and Swindells, 2011).
2.11. Statistical analysis
All the data are represented as the mean ± SEM of three independent observations. p values were determined using the Bonferroni post-hoc test, and its values if < 0.05 were considered statistically significant.
3. Results
3.1. Phytochemical characterization of wheatgrass extract
The wheatgrass was harvested after day 5 and day 7 post-emergence of the shoot (Fig. 1). The HPLC analyses of wheatgrass identified three phenolic acids and flavonoids each from both 5- and 7-day post-emergence samples (W5 and W7) (Fig. S1). The chlorogenic acid, caffeic acid, syringic acid were identified as major phenolic acids, whereas apigenin, apegenin-7-O-glucoside, and luteolin were detected as major flavonoids in the wheatgrass samples. Interestingly, the amount of phenolic acids and flavonoids were found be marginally higher in 7-day post germinated samples as compared to 5-day post germinated samples (Table 2).
Fig. 1.

Wheatgrass as grown in the herbal garden. The wheat grains were sowed in pots and maintained at ambient conditions (A). The wheatgrass was harvested after day 5 (B) and day 7 (C).
Table 2.
Major phenolic acids and flavonoid profile determined by HPLC in wheatgrass extracts.
| S. No. | Metabolite name | Concentration (µg/g fresh mass) |
|
|---|---|---|---|
| W5 | W7 | ||
| Phenolic acids | |||
| 1. | Cholorogenic acid | 32.88 ± 0.55 | 37.32 ± 0.38 |
| 2. | Caffeic acid | 3.95 ± 0.06 | 4.90 ± 0.18 |
| 3. | Syringic acid | 46.71 ± 1.39 | 85.78 ± 0.51 |
| Flavonoids | |||
| 4. | Apigenin | 41.65 ± 1.60 | 78.19 ± 1.81 |
| 5. | Apigenin-7-O-glucoside | 400.68 ± 1.47 | 633.21 ± 5.43 |
| 6. | Luteolin | 226.88 ± 2.43 | 336.20 ± 8.24 |
Data are mean ± SEM of three independent experiments. W5, day 5 wheatgrass methanol extract; W7, day 7 wheatgrass methanol extract.
3.2. Effect of wheatgrass extract on the viability of RAW 264.7 cells
The effect of day 5 and day 7 wheatgrass extracts (W5 and W7) was analyzed on RAW 264.7 cells after 12 h of treatment by MTT assay based upon previously reported studies. Both the extracts (W5 and W7) were found to be non-toxic to cells at the mentioned range of conditions and concentrations used in this study since there were no significant changes in cell viability even at the highest concentration (200 µg/ml) tested (Fig. 2). The microscopic analyses also confirmed no morphological changes in the cellular morphology (data not shown). Accordingly, all further analyses were performed using 100 and 200 µg/ml concentrations of both W5 and W7.
Fig. 2.

Effect of wheatgrass extracts on RAW 264.7 cell viability. The cells were treated with methanol extracts of W5 (A) and W7 (B) in the presence of 1 µg/ml LPS for 12 h. MTT assay was performed to assess the cell viability. All results are represented as mean ± SEM of three independent experiments. W5, 5-day old wheatgrass methanol extract; W7, 7-day old wheatgrass methanol extract; LPS, lipopolysaccharide; n.s. not significant.
3.3. Effect of wheatgrass extract on LPS-stimulated NO production in RAW 264.7 cells
The preventive influence of W5 and W7 extracts on the production of NO in LPS-stimulated RAW 264.7 cell line was investigated by the Griess reagent method for nitrite estimation. As shown in Fig. 3, RAW 264.7 cells with only LPS treated condition demonstrated a significantly increased level of NO (60 µM) in the culture media after 12 h of incubation as compared to vehicle treated condition (p < 0.05). In the presence of W5, the enhanced level of NO production in the culture media of LPS treated cells dropped to 42 and 18 µM at 100 and 200 µM concentrations of W5 treatment, respectively (Fig. 3A) (p < 0.05). A similar treatment condition of RAW 264.7 cells with W7 extract led to the inhibition of NO production in the culture media to 38 and 20 µM at 100, and 200 µM concentrations of W7 respectively, which was again almost 3-fold reduction as compared to only LPS treated condition (Fig. 3B) (p < 0.05).
Fig. 3.

Effect of wheatgrass extracts on the production of nitric oxide (NO) as an inflammatory mediator in RAW 264.7 cells. The cells were treated with wheatgrass methanol extracts W5 (A) and W7 (B) in the presence or absence of 1 µg/ml LPS for a period of 12 h. Griess reagent was used to measure the amount of NO as described. All results are represented as mean ± SEM of three independent experiments. * and # indicate p < 0.05 as compared to respective vehicle-treated control and only LPS-stimulated cells, respectively. W5, 5-day old wheatgrass methanol extract; W7, 7-day old wheatgrass methanol extract; LPS, lipopolysaccharide.
3.4. Effect of wheatgrass extract on LPS-stimulated intracellular ROS production in RAW 264.7 cells
RAW 264.7 cells, treated with LPS, led to a significant increase in the number of cells that were involved in the production of intracellular ROS (almost 80%) as compared to vehicle-treated condition (20%) (Fig. 4A) (p < 0.05). This was based on the fact that there was a significantly increased area of purple-colored region (indicative of ROS positive cells) in the former as compared to the latter in FACS analyses. It is to be noted here that the purple and orange colored regime in Fig. 4A indicates ROS enriched and ROS free cells, respectively. Different concentrations of wheatgrass extracts significantly attenuated the LPS-stimulated level of ROS producing cell count after 12 h of incubation. W5 effectively reduced the percentage of ROS producing cells to 18% at 200 µg/ml concentration, whereas W7 at similar treatment conditions reduced the population of ROS positive cells to 8% (Fig. 4B) (p < 0.05). The quantitative analyses of the cell count for ROS enriched cells under different treatment conditions are shown in Fig. 4B, thus indicating at least 4-fold reduction in the population of ROS positive cells and hence confirming anti-oxidative potential of these extracts (p < 0.05).
Fig. 4.

Effect of wheatgrass extracts on the prevention of LPS-stimulated ROS production in RAW 264.7 cells. (A) Representative FACS analysis of cells using DCFDA dye under different treatment conditions. An orange and purple zone represents unstained (ROS free) and stained (ROS enriched) cells, respectively. (B) The bar graph indicating the quantitative analysis of DCFDA stained cell count percentage determined by FACS analysis in (A). Results are representative of three independent experiments with mean ± SEM. * and # indicate p < 0.05 as compared to vehicle-treated control and only LPS-stimulated cells, respectively. W5, 5-day old wheatgrass methanol extract; W7, 7-day old wheatgrass methanol extract; LPS, lipopolysaccharide. (For interpretation of the references to color in this figure legend, the reader is referred to the web version of this article.)
3.5. Effect of wheatgrass extract on the transcription and translation of inflammatory markers and effectors
It has been well established that the expression of various cytokines such as IL-1β, AP-1, IL-6 and TNF-α play an essential role in the progression of inflammatory conditions involving over-expression of iNOS-2 and COX-2. Thus, the mRNA and protein expression analyses of these parameters were performed in the next phase of the study. According to semi-quantitative PCR and western blot analyses, it was found that LPS-stimulated the production of pro-inflammatory and inflammatory genes in macrophage cells both at the level of transcription (Fig. 5, Fig. 6) and translation (Fig. 7). Interestingly, both the wheatgrass extracts, W5 and W7, led to a reduction in the LPS-stimulated expression of all the genes in a dose-dependent manner. Transcriptional analyses of gene expression by semi quantitative-PCR analyses confirmed that LPS inducted RAW 264.7 cells generated around 1.7-, 1.4-, 2.0- and 1.8-fold increase in the expression patterns of TNF-α, IL-6, IL-1β and AP-1 genes after 12 h of incubation as compared to vehicle-treated control cells (Fig. 5, Fig. 6) (p < 0.05). While the treatment of LPS-stimulated RAW 264.7 cells with two different concentrations of W5 (100 and 200 µg/ml) significantly reduced the expression of pro-inflammatory indicators TNF-α (1.3- and 2.8- fold), IL-6 (1.2- and 2.6- fold), IL-1β (1.8- and 2.5- fold) and AP-1 (1.5- and 3.6- fold), respectively as compared to LPS-stimulated RAW 264.7 cells (Fig. 5) (p < 0.05). Similarly, W7 (100 and 200 µg/ml) prevented the LPS-stimulated overexpression of TNF- α (1.4- and 3.4- fold), IL-6 (1.2- and 2.5- fold), IL-1β (1.8- and 2.6- fold) and AP-1 (1.5- and 3.4- fold), respectively as compared to LPS-stimulated overexpression in RAW 264.7 cells (Fig. 6) (p < 0.05).
Fig. 5.

Effect of wheatgrass extract W5 on LPS-stimulated transcription of inflammatory markers in RAW 264.7 cells. Representative RT-PCR images indicating the transcription pattern of pro-inflammatory and inflammatory markers in response to different concentrations of W5 extract. The bar graph represents fold change in expressions as compared to respective vehicle-treated control groups. Results are representative of three independent experiments with mean ± SEM. * and # indicate p < 0.05 as compared to vehicle-treated control and LPS-stimulated cells, respectively. W5, 5-day old wheatgrass methanol extract; LPS or L, lipopolysaccharide.
Fig. 6.

Effect of wheatgrass extract W7 on LPS-stimulated transcription of inflammatory markers in RAW 264.7 cells. Representative RT-PCR images indicating the transcription pattern of pro-inflammatory and inflammatory markers in response to different concentrations of W7 extract. The bar graph represents fold change in expression as compared to respective vehicle-treated control groups. Results are representative of three independent experiments with mean ± SEM. * and # indicate p < 0.05 as compared to vehicle-treated control and LPS-stimulated cells, respectively. W7, 7-day old wheatgrass methanol extract; LPS or L, lipopolysaccharide.
Fig. 7.

Effect of wheatgrass extract on the expression of LPS-stimulated inflammatory proteins in RAW 264.7 cells. Representative protein expression patterns as determined by immunoblot analysis in RAW 264.7 cells treated with LPS and supplemented with wheatgrass methanol extract W5 (A) and W7 (B). The bar graphs below respective gel images indicate fold change in expression as compared to vehicle-treated control group. Results are the mean ± SEM of three independent experiments. * and # indicate p < 0.05 compared to vehicle-treated control and LPS-stimulated cells, respectively. W5, 5-day old wheatgrass methanol extract; W7, 7-day old wheatgrass methanol extract; LPS, lipopolysaccharide.
iNOS-2 and COX-2 mRNA expression under LPS induction in RAW 264.7 cells increased by about 2.2- and 2.5- fold, respectively (Fig. 5, Fig. 6). Interestingly, W5 (100 and 200 µg/ml) effectively controlled the LPS-stimulated over-expression of iNOS-2 (1.1- and 2.9- fold) and COX-2 (1.8- and 3.1- fold), respectively (Fig. 5). Similarly, W7 (100 and 200 µg/ml) also significantly reduced the LPS-stimulated expression of iNOS-2 (1.1- and 3.6- fold) and COX-2 (1.4- and 2.8- fold) in RAW 264.7cells (Fig. 6) (p < 0.05).
In the next phase, the expression patterns of iNOS-2 and COX-2 were analyzed at the protein level by immunoblot analysis. After 12 h of treatment condition, the expression of iNOS-2 and COX-2 was increased by about 3- fold in macrophage cells treated with LPS as compared to vehicle-treated control cells (Fig. 7A and B). As shown in Fig. 7A, the expression of iNOS-2 was found to be downregulated by about 1.1- and 2.5- fold, whereas the expression of COX-2 was decreased by about 1.3- and 2.0- fold in LPS-stimulated RAW 264.7 cells when treated with two different concentrations of W5 (100 and 200 µg/ml) respectively (p < 0.05). A similar trend of downregulation was also observed in response to two different concentrations of W7 (100 and 200 μg/ml) for iNOS-2 (1.5- and 5- fold) and COX-2 (1.6- and 6.1- fold) (p < 0.05) (Fig. 7B). Thus, taken together, it can be strongly upheld that both W5 and W7 significantly inhibited the development of inflammatory conditions under in vitro condition by downregulating the prominent inflammatory markers. Further, it is to be noted that this downregulation was both at the level of transcription as well as translation.
3.6. Effect of wheatgrass extract on LPS-stimulated NF-κB transcriptional activity in RAW 264.7 cells
The probable mechanism of LPS-stimulated over-expression and subsequent inhibition by wheatgrass on iNOS-2 and COX-2 transcription/ translation was next investigated by performing the NF-κB transactivation assay. For this analysis, RAW 264.7 cells were transfected with the NF-κB-responsive luciferase reporter construct (pNFκB-Luc). Then the cells were stimulated with LPS in the absence or presence of W5 and W7 of two different concentrations (100 and 200 µg/ml). The promoter activity was subsequently measured by performing luciferase assay. As shown in Fig. 8, both W5 (Fig. 8A) and W7 (Fig. 8B) exhibited significant dose-dependent inhibition of LPS-stimulated NF-κB promoter transactivation (p < 0.05). At concertation of 200 μg/ml of both W5 and W7, the LPS-stimulated NF-κB transactivation was inhibited by about 2.4-fold (p < 0.05).
Fig. 8.

Effect of wheatgrass extract on the transactivation of NF-κB promoter in LPS-stimulated RAW 264.7 cells. Raw 264.7 cells were transfected with pNFκB-Luc and β-gal plasmids and then exposed to 1 µg/ml of LPS in the presence or absence of W5 (A) and W7 (B) for 12 h followed by estimation of luciferase activities. Results are mean ± SEM of three independent experiments. * and # indicate p < 0.05 as compared to vehicle-treated control and LPS-stimulated cells, respectively. W5, 5-day old wheatgrass methanol extract; W7, 7-day old wheatgrass methanol extract; LPS, lipopolysaccharide.
3.7. Molecular docking analysis for the regulation of COX-2
In the next phase, the molecular docking was performed to predict the plausible binding modes of COX-2 with two major constituent metabolites from the wheatgrass extracts namely, apigenin and myo-inositol (Złotek et al., 2019, Ashok, 2011). It was found that COX-2 interacted with these ligands through polar and non-polar interactions. The predicted binding energies and binding constants of these ligands against COX-2 are presented in Table 3. The overall structure of COX-2 with these ligands docked in the active site pocket is shown in Fig. 9A.
Table 3.
Binding characteristics of COX-2 with apigenin and myo-inositol as determined by Autodock.
| S. No. | Ligand | Binding energy (kCal/mol) | Binding constant (µM) | Residues involved in hydrogen bonding | Residues involved through hydrophobic forces |
|---|---|---|---|---|---|
| 1. | Apigenin | −10.59 | 0.01741 | Arg120, Tyr355, Ser530 and Met522 | Tyr355, Tyr385, Trp387, Val523, Ala527, Leu531, Leu384, Val349 and Leu352 |
| 2. | Myo-inositol | −7.88 | 1.69 | Met522, Ser530 and Gly526 | Val349, Leu352, Val523, Leu384, Ala527, Phe381, Tyr385 and Trp387 |
Fig. 9.

Molecular docking analysis of COX-2. (A) Ribbon diagram showing the overall structure of COX-2 with docked ligands in the active site pocket. Ligands (apigenin in yellow and myo-inositol in dodger blue color) are shown as sticks. (B) Surface diagram of COX-2 with docked ligands in the active site pocket. Apigenin and myo-inositol are shown as sticks in yellow and dodger blue color, respectively. (For interpretation of the references to color in this figure legend, the reader is referred to the web version of this article.)
Among these two metabolites, apigenin showed about 97 × stronger binding affinities with COX-2 as compared to myo-inositol, based upon the binding constant values. The surface diagram of COX-2 with the docked ligands in the active site pocket is shown in Fig. 9B. Based upon the active site analysis of naproxen bound COX-2 complex crystal structure, it was observed that Tyr355, Arg120, Ser530 (catalytic), Tyr385 (catalytic), Val349, Ala527, Leu531 and Trp387 residues exert a crucial role in binding, and subsequently affecting the catalysis and inhibition of COX-2 (Duggan et al., 2010). We compared the apigenin bound docked COX-2 complex with naproxen bound crystal structure (PDB ID: 3NT1) and found that both the ligands were binding in almost similar fashions and interacting with the critical residues of the active site (Fig. 10C and D).
Fig. 10.

Binding studies of apigenin with COX-2. (A) Interactions of apigenin with COX-2. Interacting residues are shown as sticks and yellow color. Apigenin is shown in ball and stick representation and cyan color. Hydrogen bonds are shown as black dashed lines. (B) 2D interaction diagram of apigenin with COX-2. (C) The binding pose of naproxen bound crystal structure of COX-2. (D) The best-predicted pose of apigenin-docked COX-2 complex. Both ligands are shown in yellow color as sticks. Interacting residues were shown as sticks and cyan color. Hydrogen bonds are shown in black dashed lines. (For interpretation of the references to color in this figure legend, the reader is referred to the web version of this article.)
The key residues, which interacted with apigenin through hydrogen bonding, were Arg120, Tyr355, Ser530 and Met522. Apigenin chemically is represented as 5,7-Dihydroxy-2-(4-hydroxyphenyl)-4H-1-benzopyran-4-one. Tyr355 and Arg120 formed hydrogen bonds with –hydroxyl group (4-OH) of hydroxyphenyl ring, while Ser530 formed the hydrogen bond with -oxo group of benzopyrene ring. Other residues interacted using non-polar interactions involving Val349, Tyr348, Leu352, Tyr384, Trp387, Leu384, Gly526, Tyr355, Val523 and Ala527 (Fig. 10A and B).
We further analyzed the predicted binding poses of myo-inositol with COX-2 and found that it interacted with COX-2 in a deep hydrophobic channel of the active site, involving polar and non-polar interactions. Met522, Gly526, and Ser530 residues of COX-2 interacted with myo-inositol through hydrogen bonding (Fig. 11A and B). The residues that contributed through hydrophobic interactions were Val349, Leu352, Leu384, Ala527, Phe381, Tyr385 and Trp387. The predicted binding mode and 2D interaction diagrams are shown in Fig. 11A and B.
Fig. 11.

Binding study of myo-inositol with COX-2. (A) The predicted binding pose of myo-inositol with COX-2. Interacting residues are shown as sticks and yellow color. Myo-inositol is shown in cyan color as a ball and stick representation. Hydrogen bonds are shown as black dashed lines. (B) 2D interaction diagrams of myo-inositol with COX-2. (For interpretation of the references to color in this figure legend, the reader is referred to the web version of this article.)
4. Discussion
Wheat is widely produced and consumed globally and is the primary staple crop in most of the continents. Wheat is a rich source of carbohydrates and many vitamins (mianly vitamin C and E), choline, minerals, enzymes, indole, and various amino acids, which are considered to be beneficial for human health (Bar-Sela et al., 2015). The qualities of wheatgrass for the prevention of cancer and reducing the side effects associated with cancer treatments are attributed to its high chlorophyll content amounting to around 70% of the total phytoconstituents (Gore et al., 2017). The phytochemical evaluation of wheat extract confirmed that it is a reasonably rich source of both bioactive phenolic acids and flavonoids. The caffeic-, chlorogenic- and syringic acids have been reported to possess anti-inflammatory activities (Bisht et al., 2020, da Cunha et al., 2004, Bouhlali et al., 2020). Similarly, apigenin, its glucoside and luteolin have been reported to act as anti-inflammatory molecules (Funakoshi-Tago et al., 2011) Apigenin has also been reported to have a preventive role against diabetes, amnesia, cancer and Alzheimer’s disease (Salehi et al., 2019, Kasiri et al., 2018).
In the current study, the anti-inflammatory potential of wheatgrass was investigated in macrophage cells using RAW 264.7 cells as an in vitro model, commonly used for this purpose. Macrophages are precursor phagocytes derived from bone marrow. These cells act as secretory cells in our body’s immune system, releasing various cytokines, enzymes, growth factors and complement proteins, which regulate the host defense system, inflammatory system, and maintain homeostasis. Inflammation is considered as a response towards the development of immunity against infection and tissue injury and, thus, a step towards a healthy state (Dunster, 2016). Inflammation has been reported to be associated with various diseased conditions such as anemia, rheumatoid arthritis, type-2 diabetes, chronic kidney diseases, cancer, neurodegenerative diseases, atherosclerosis and inflammation-based aging (Guo et al., 2015;21:677–87., Manabe, 2011, Scrivo et al., 2011).
The induction of macrophages with LPS leads to the generation of redundant inflammatory mediators like NO and ROS, thus causing cytotoxicity. In the present study, methanol extract of day 5 (W5) and day 7 (W7) wheatgrass retained cell viability intact even at the highest dosage condition. Further, the cellular analysis showed that it stimulated the inhibition of NO production in LPS-stimulated macrophagic RAW 264.7 cells.
The nuclear transcription factor NF-κB and AP-1 also plays a substantial role in the progression of inflammatory conditions involving pro-inflammatory cytokines (Subedi et al., 2019). The induction of macrophage cells with LPS activates the AP-1 transcription factor, affecting phosphorylation of c-jun N-terminal kinase, which is affiliated with MAPK (Mitogen-Activated Protein Kinase) protein family, activating the JNK signaling pathway. The final outcome of activation of AP-1 leads to an increase in the expression of TNF-α. Our data showed that W5 and W7 significantly reduced the expression of cytokines and transcription factor AP-1, as confirmed by transcriptional analysis of selected genes. These findings are in accordance with the previous reports (Lee et al., 2017). The JNK signaling pathway also participates in the process of osteoblast proliferation, differentiation and apoptosis. The promoter region of osteoblast-inducing genes such as osteopontin, osteonectin, osteocalcin and collagenase-3 also have been reported to possess AP-1 binding sites (Pan et al., 2019). However, the probable inhibition of osteoclastogenesis in RAW 264.7 cells in the presence of W5 and W7 remains unexplored.
LPS-activated macrophages release pro-inflammatory cytokines like TNF-α, IL-6 and IL-1β (Laskin, 2009). The therapeutic strategy for the treatment of inflammation and related disorders promptly involves downregulated expression of these cytokines (Tanaka and Narazaki, 2012, Libby, 2017). It has been reported that IL-1β is also responsible for the generation of inflammation in microglial cells (Conti et al., 2020, Tao et al., 2020). The inhibition of cytokines in presence of wheatgrass extract points to the anti-inflammatory potential of its phytoconstituents. The expression of iNOS-2 and COX-2 remains upregulated both at transcription and translation levels in LPS-stimulated condition. The significant reduction in the level of both inflammatory proteins (iNOS-2 and COX-2) by wheatgrass extract validates their anti-inflammatory potential, as reported in various previous studies (Murakami and Ohigashi, 2007, Subedi et al., 2019, Moon et al., 2009, Shin et al., 2012).
The NF-κB pathway plays a significant role in regulating prime inflammatory proteins like iNOS-2 and COX-2 during inflammation conditions. NF-κB, in general, exists in the cytoplasm of cells being inactivated by IκBα binding to it. The LPS induction of macrophage cells triggers the degradation of IκBα, which in turn, activates NF-κB. The p65 subunit of NF-κB dissociates and translocates to the nucleus, leading to enhanced transcription of iNOS-2 and COX-2 genes (Linghu et al., 2020). In the present study, it has been shown that both W5 and W7 reduced the LPS-stimulated NF-κB promoter-luciferase activity in a dose-dependent manner. This finding confirms that wheatgrass extract (mainly day 5 and 7) prevents the nuclear translocation of p65 subunit of NF-κB and thus downregulating the expression of iNOS-2 and COX-2, as reported in previous studies (Ying et al., 2013).
Based on the current data, the anti-inflammatory properties of wheatgrass reported in this study could be attributed to its high content of anti-inflammatory components. Some of those significant components could be flavonoids, chlorophyll and superoxide dismutase, as reported earlier (Parit et al., 2018). It is to be noted that chlorophyll, which constitutes one of the major components of wheatgrass, has been reported to be responsible for treating various inflammation-related diseases, such as dengue, cholangiocarcinoma, allergic rhinitis and acne vulgaris (Avisar et al., 2020). Further, both high anti-oxidant constituents, as well as anti-oxidant effects of wheatgrass, has also been reported in various studies, including human subjects (Sukkar et al., 2008, Shyam et al., 2007).
Based upon the docking studies and comparison of different binding modes of these ligands against COX-2, it was found that apigenin and myo-inositol could act as a potential inhibitor of COX-2. Among these metabolites, apigenin might serve as a potent inhibitor of COX-2 based upon the docking scores. Also, the predicted binding pose of apigenin was found to be more suitable and comparable to the naproxen-bound crystal structure of COX-2 (PDB ID: 3NT1).
In conclusion, the current preliminary in vitro study demonstrates that wheatgrass alleviates inflammatory response by inhibiting the expression of iNOS-2 and COX-2. The inhibition of NF-κB and AP-1 expression correlates with the downregulation of both iNOS-2 and COX-2, as observed in this study. The prevention of LPS-stimulated ROS production also supports the anti-inflammatory potential of wheatgrass. Naturally, based on these data, it could be conceived that the consumption of wheatgrass extracts, especially day 5 and day 7 extracts provides health beneficial effects. Overall, these results validate the anti-inflammatory potential of wheatgrass under in vitro conditions and suggest that its intake may contribute to decreased inflammation and reduce oxidative stress stimulated by inflammation. However, further detailed studies based on in vivo practices are required to substantiate these findings and branding this as a nutraceutical. This current in vitro pre-clinical data as presented in this study provides a supporting base for such detailed analyses.
5. Declarations
Funding
This work is supported by a research fellowship (JRF/SRF) assistance for pursuing doctoral research to SB and PK from the Council of Scientific and Industrial Research, Government of India.
5.2. Author’s contributions
SB and PR designed the study. SB completed the experimental process, literature search and generation of figures. PK, VK, BW and SN provided their support for carrying out experiments. SB and PR wrote the manuscript while PK, VK, VDK and DS edited the manuscript. All authors have read and approved the final manuscript.
6. Ethics declarations
Consent for publication
Not applicable.
Ethics approval and consent to participate
Not applicable.
Declaration of Competing Interest
The authors declare that they have no known competing financial interests or personal relationships that could have appeared to influence the work reported in this paper.
Footnotes
Supplementary data to this article can be found online at https://doi.org/10.1016/j.crtox.2021.02.005.
Contributor Information
Somesh Banerjee, Email: sbanerjee1@bt.iitr.ac.in.
Parul Katiyar, Email: pkatiyar@bt.iitr.ac.in.
Vijay Kumar, Email: vijay.kumar@rcb.res.in.
Bhairavnath Waghmode, Email: bwaghmode@bt.iitr.ac.in.
Sandip Nathani, Email: snathani@bt.iitr.ac.in.
Vengadesan Krishnan, Email: kvengadesan@rcb.res.in.
Debabrata Sircar, Email: debabrata.sircar@bt.iitr.ac.in.
Partha Roy, Email: partha.roy@bt.iitr.ac.in.
Appendix A. Supplementary data
The following are the Supplementary data to this article:
References
- Al-Awaida W.J., Sharab A.S., Al-Ameer H.J., Ayoub N.Y. Effect of simulated microgravity on the antidiabetic properties of wheatgrass (Triticum aestivum) in streptozotocin-induced diabetic rats. npj Microgravity. 2020;6(6) doi: 10.1038/s41526-020-0096-x. [DOI] [PMC free article] [PubMed] [Google Scholar]
- An H.J., Jeong H.J., Um J.Y., Kim H.M., Hong S.H. Glechoma hederacea inhibits inflammatory mediator release in IFN-γ and LPS-stimulated mouse peritoneal macrophages. J. Ethnopharmacol. 2006;106:418–424. doi: 10.1016/j.jep.2006.01.024. [DOI] [PubMed] [Google Scholar]
- Ashok S.A. Phytochemical and pharmacological screening of wheatgrass juice (Triticum aestivum L.) Int. J. Pharm. Sci. Rev. Res. 2011;9:159–164. [Google Scholar]
- Avisar A., Cohen M., Katz R., Shentzer Kutiel T., Aharon A., Bar-Sela G. Wheatgrass juice administration and immune measures during adjuvant chemotherapy in colon cancer patients: preliminary results. Pharmaceuticals. 2020;13:129. doi: 10.3390/ph13060129. [DOI] [PMC free article] [PubMed] [Google Scholar]
- Bar-Sela G., Cohen M., Ben-Arye E., Epelbaum R. The medical use of wheatgrass: review of the gap between basic and clinical applications. Mini-Rev. Med. Chem. 2015;15:1002–1010. doi: 10.2174/138955751512150731112836. [DOI] [PubMed] [Google Scholar]
- Bisht A., Dickens M., Rutherfurd-Markwick K., Thota R., Mutukumira A.N., Singh H. Chlorogenic Acid potentiates the anti-inflammatory activity of curcumin in LPS-stimulated THP-1 cells. Nutrients. 2020;12:2706. doi: 10.3390/nu12092706. [DOI] [PMC free article] [PubMed] [Google Scholar]
- Bouhlali E., dine T., Hmidani A., Bourkhis B., Khouya T., Ramchoun M., Filali-Zegzouti Y. Phenolic profile and anti-inflammatory activity of four Moroccan date (Phoenix dactylifera L.) seed varieties. Heliyon. 2020;6:e03436. doi: 10.1016/j.heliyon.2020.e03436. [DOI] [PMC free article] [PubMed] [Google Scholar]
- Carvalho A.M.S., Heimfarth L., Pereira E.W.M., Oliveira F.S., Menezes I.R.A., Coutinho H.D.M. Phytol, a chlorophyll component, produces antihyperalgesic, anti-inflammatory, and antiarthritic effects: possible NFκB pathway involvement and reduced levels of the proinflammatory cytokines TNF-α and IL-6. J. Nat. Prod. 2020;83:1107–1117. doi: 10.1021/acs.jnatprod.9b01116. [DOI] [PubMed] [Google Scholar]
- Cheng H., Wang L., Mollica M., Re A.T., Wu S., Zuo L. Nitric oxide in cancer metastasis. Cancer Lett. 2014;353:1–7. doi: 10.1016/j.canlet.2014.07.014. [DOI] [PMC free article] [PubMed] [Google Scholar]
- Clancy R.M., Amin A.R., Abramson S.B. The role of nitric oxide in inflammation and immunity. Arthritis Rheum. 1998;41:1141–1151. doi: 10.1002/1529-0131(199807)41:7<1141::AID-ART2>3.0.CO;2-S. [DOI] [PubMed] [Google Scholar]
- Conti P., Lauritano D., Caraffa A., Gallenga C.E., Kritas S.K., Ronconi G. Microglia and mast cells generate proinflammatory cytokines in the brain and worsen inflammatory state: Suppressor effect of IL-37. Eur. J. Pharmacol. 2020;875 doi: 10.1016/j.ejphar.2020.173035. [DOI] [PubMed] [Google Scholar]
- da Cunha F.M., Duma D., Assreuy J., Buzzi F.C., Niero R., Campos M.M. Caffeic acid derivatives. In vitro and in vivo anti-inflammatory properties. Free Radic. Res. 2004;38:1241–1253. doi: 10.1080/10715760400016139. [DOI] [PubMed] [Google Scholar]
- Dallegri F., Ottonello L. Pharmacological implications in the switch from acute to chronic inflammation. Inflammopharmacology. 2002;10:159–171. doi: 10.1163/156856002321168187. [DOI] [Google Scholar]
- Duggan K.C., Walters M.J., Musee J., Harp J.M., Kiefer J.R., Oates J.A. Molecular basis for cyclooxygenase inhibition by the non-steroidal anti-inflammatory drug naproxen. J. Biol. Chem. 2010;285:34950–34959. doi: 10.1074/jbc.M110.162982. [DOI] [PMC free article] [PubMed] [Google Scholar]
- Dunster J.L. The macrophage and its role in inflammation and tissue repair: Mathematical and systems biology approaches. Wiley Interdiscip Rev. Syst. Biol. Med. 2016;8:87–99. doi: 10.1002/wsbm.1320. [DOI] [PubMed] [Google Scholar]
- Ferruzzi M.G., Blakeslee J. Digestion, absorption, and cancer preventative activity of dietary chlorophyll derivatives. Nutr. Res. 2007;27:1–12. doi: 10.1016/j.nutres.2006.12.003. [DOI] [Google Scholar]
- Ferruzzi M.G., Böhm V., Courtney P.D., Schwartz S.J. Antioxidant and antimutagenic activity of dietary chlorophyll derivatives determined by radical scavenging and bacterial reverse mutagenesis assays. J. Food Sci. 2002;67:2589–2595. doi: 10.1111/j.1365-2621.2002.tb08782.x. [DOI] [Google Scholar]
- Förstermann U., Sessa W.C. Nitric oxide synthases: Regulation and function. Eur. Heart J. 2012;33:829–837. doi: 10.1093/eurheartj/ehr304. [DOI] [PMC free article] [PubMed] [Google Scholar]
- Fukumura D., Kashiwagi S., Jain R.K. The role of nitric oxide in tumour progression. Nat. Rev. Cancer. 2006;6:521–534. doi: 10.1038/nrc1910. [DOI] [PubMed] [Google Scholar]
- Funakoshi-Tago M., Nakamura K., Tago K., Mashino T., Kasahara T. Anti-inflammatory activity of structurally related flavonoids, Apigenin, Luteolin and Fisetin. Int. Immunopharmacol. 2011;11:1150–1159. doi: 10.1016/j.intimp.2011.03.012. [DOI] [PubMed] [Google Scholar]
- Gantner B.N., LaFond K.M., Bonini M.G. Nitric oxide in cellular adaptation and disease. Redox. Biol. 2020;34 doi: 10.1016/j.redox.2020.101550. [DOI] [PMC free article] [PubMed] [Google Scholar]
- Gore R.D., Palaskar S.J., Bartake AR. Wheatgrass: Green blood can help to fight cancer. J. Clin. Diagn. Res. 2017;11(6):ZC40–ZC42. doi: 10.7860/JCDR/2017/26316.10057. [DOI] [PMC free article] [PubMed] [Google Scholar]
- Guo H., Callaway J.B., Ting J.P.-Y. Inflammasomes: mechanism of action, role in disease, and therapeutics. Nat. Med. 2015;21:677–687. doi: 10.1038/nm.3893. [DOI] [PMC free article] [PubMed] [Google Scholar]
- Kasiri N., Rahmati M., Ahmadi L., Eskandari N. The significant impact of apigenin on different aspects of autoimmune disease. Inflammopharmacology. 2018;26:1359–1373. doi: 10.1007/s10787-018-0531-8. [DOI] [PubMed] [Google Scholar]
- Kawai T., Akira S. Signaling to NF-κB by Toll-like receptors. Trends Mol. Med. 2007;13:460–469. doi: 10.1016/j.molmed.2007.09.002. [DOI] [PubMed] [Google Scholar]
- Laskin D.L. Macrophages and inflammatory mediators in chemical toxicity: A battle of forces. Chem. Res. Toxicol. 2009;22:1376–1385. doi: 10.1021/tx900086v. [DOI] [PMC free article] [PubMed] [Google Scholar]
- Laskowski R.A., Swindells M.B. LigPlot+: Multiple ligand-protein interaction diagrams for drug discovery. J. Chem. Inf. Model. 2011;51:2778–2786. doi: 10.1021/ci200227u. [DOI] [PubMed] [Google Scholar]
- Lee S.-B., Lee W.S., Shin J.-S., Jang D.S., Lee K.T. Xanthotoxin suppresses LPS-induced expression of iNOS, COX-2, TNF-α, and IL-6 via AP-1, NF-κB, and JAK-STAT inactivation in RAW 264.7 macrophages. Int. Immunopharmacol. 2017;49:21–29. doi: 10.1016/j.intimp.2017.05.021. [DOI] [PubMed] [Google Scholar]
- Libby P. Interleukin-1 beta as a target for atherosclerosis therapy: biological basis of CANTOS and beyond. J. Am. Coll. Cardiol. 2017;70:2278–2289. doi: 10.1016/j.jacc.2017.09.028. [DOI] [PMC free article] [PubMed] [Google Scholar]
- Linghu K.-G., Ma Q.S., Zhao G.D., Xiong W., Lin L., Zhang Q.-W. Leocarpinolide B attenuates LPS-induced inflammation on RAW264.7 macrophages by mediating NF-κB and Nrf2 pathways. Eur. J. Pharmacol. 2020;868:172854. doi: 10.1016/j.ejphar.2019.172854. [DOI] [PubMed] [Google Scholar]
- Liu T., Zhang L., Joo D., Sun S.-C. NF-κB signaling in inflammation. Signal Transduct. Target Ther. 2017;2:17023. doi: 10.1038/sigtrans.2017.23. [DOI] [PMC free article] [PubMed] [Google Scholar]
- Manabe I. Chronic inflammation links cardiovascular, metabolic and renal diseases. Circ. J. 2011;75:2739–2748. doi: 10.1253/circj.CJ-11-1184. [DOI] [PubMed] [Google Scholar]
- Moon D.O., Kim M.O., Kang S.H., Choi Y.H., Kim G.Y. Sulforaphane suppresses TNF-α-mediated activation of NF-κB and induces apoptosis through activation of reactive oxygen species-dependent caspase-3. Cancer Lett. 2009;274:132–142. doi: 10.1016/j.canlet.2008.09.013. [DOI] [PubMed] [Google Scholar]
- Morris G.M., Huey R., Lindstrom W., Sanner M.F., Belew R.K., Goodsell D.S. AutoDock4 and AutoDockTools4: Automated docking with selective receptor flexibility. J. Comput. Chem. 2009;30:2785–2791. doi: 10.1002/jcc.21256. [DOI] [PMC free article] [PubMed] [Google Scholar]
- Murakami A., Ohigashi H. Targeting NOX, INOS and COX-2 in inflammatory cells: Chemoprevention using food phytochemicals. Int. J. Cancer. 2007;121:2357–2363. doi: 10.1002/ijc.23161. [DOI] [PubMed] [Google Scholar]
- Nakanishi M., Rosenberg D.W. Multifaceted roles of PGE2 in inflammation and cancer. Semin. Immunopathol. 2013;35:123–137. doi: 10.1007/s00281-012-0342-8. [DOI] [PMC free article] [PubMed] [Google Scholar]
- Pan W., Yang L., Li J., Xue L., Wei W., Ding H. Traumatic occlusion aggravates bone loss during periodontitis and activates Hippo- YAP pathway. J. Clin. Periodontol. 2019;46:438–447. doi: 10.1111/jcpe.13065. [DOI] [PubMed] [Google Scholar]
- Parit S.B., Dawkar V.V., Tanpure R.S., Pai S.R., Chougale A.D. Nutritional quality and antioxidant activity of wheatgrass (Triticum aestivum) unwrap by proteome profiling and DPPH and FRAP assays. J. Food Sci. 2018;83:2127–2139. doi: 10.1111/1750-3841.14224. [DOI] [PubMed] [Google Scholar]
- Patel D., Shukla S., Gupta S. Apigenin and cancer chemoprevention: Progress, potential and promise (Review) Int. J. Oncol. 2007;30:233–245. doi: 10.3892/ijo.30.1.233. [DOI] [PubMed] [Google Scholar]
- Pettersen E.F., Goddard T.D., Huang C.C., Couch G.S., Greenblatt D.M., Meng E.C. UCSF Chimera – A visualization system for exploratory research and analysis. J. Comput. Chem. 2004;25:1605–1612. doi: 10.1002/jcc.20084. [DOI] [PubMed] [Google Scholar]
- Raivich G., Behrens A. Role of the AP-1 transcription factor c-Jun in developing, adult and injured brain. Prog. Neurobiol. 2006;78:347–363. doi: 10.1016/j.pneurobio.2006.03.006. [DOI] [PubMed] [Google Scholar]
- Renoux F., Stellato M., Haftmann C., Vogetseder A., Huang R., Subramaniam A. The AP1 transcription factor Fosl2 promotes systemic autoimmunity and inflammation by repressing Treg development. Cell. Rep. 2020;31 doi: 10.1016/j.celrep.2020.107826. [DOI] [PubMed] [Google Scholar]
- Salehi B., Venditti A., Sharifi-Rad M., Kręgiel D., Sharifi-Rad J., Durazzo A. The therapeutic potential of apigenin. Int. J. Mol. Sci. 2019;20:1305. doi: 10.3390/ijms20061305. [DOI] [PMC free article] [PubMed] [Google Scholar]
- Sato N., Yako Y., Maruyama T., Ishikawa S., Kuromiya K., Tokuoka S.M. The COX-2/PGE2 pathway suppresses apical elimination of RasV12-transformed cells from epithelia. Commun. Biol. 2020;3:132. doi: 10.1038/s42003-020-0847-y. [DOI] [PMC free article] [PubMed] [Google Scholar]
- Scrivo R., Vasile M., Bartosiewicz I., Valesini G. Inflammation as “common soil” of the multifactorial diseases. Autoimmun. Rev. 2011;10:369–374. doi: 10.1016/j.autrev.2010.12.006. [DOI] [PubMed] [Google Scholar]
- Shakya G., Balasubramanian S., Hoda M., Rajagopalan R. Inhibition of metastasis and angiogenesis in Hep-2 cells by wheatgrass extract – an in vitro and in silico approach. Toxicol. Mech. Methods. 2018;28:205–218. doi: 10.1080/15376516.2017.1388460. [DOI] [PubMed] [Google Scholar]
- Sharma J.N., Al-Omran A., Parvathy S.S. Role of nitric oxide in inflammatory diseases. Inflammopharmacology. 2007;15:252–259. doi: 10.1007/s10787-007-0013-x. [DOI] [PubMed] [Google Scholar]
- Shewry P.R. Wheat. J. Exp. Bot. 2009;60:1537–1553. doi: 10.1093/jxb/erp058. [DOI] [PubMed] [Google Scholar]
- Shin J.-S., Park S.-J., Ryu S., Kang H.B., Kim T.W., Choi J.-H. Potent anti-inflammatory effect of a novel furan-2,5-dione derivative, BPD, mediated by dual suppression of COX-2 activity and LPS-induced inflammatory gene expression via NF-κB inactivation. Br. J. Pharmacol. 2012;165:1926–1940. doi: 10.1111/j.1476-5381.2011.01670.x. [DOI] [PMC free article] [PubMed] [Google Scholar]
- Shyam R., Singh S.N., Vats P., Singh V.K., Bajaj R., Singh S.B. Wheat grass supplementation decreases oxidative stress in healthy subjects: A comparative study with Spirulina. J. Altern. Compl. Med. 2007;13:789–792. doi: 10.1089/acm.2007.7137. [DOI] [PubMed] [Google Scholar]
- Subedi L., Lee J.H., Yumnam S., Ji E., Kim S.Y. Anti-inflammatory effect of sulforaphane on LPS-activated microglia potentially through JNK/AP-1/NF-κB inhibition and Nrf2/HO-1 activation. Cells. 2019;8:194. doi: 10.3390/cells8020194. [DOI] [PMC free article] [PubMed] [Google Scholar]
- Suhail N., Bilal N., Khan H.Y., Hasan S., Sharma S., Khan F. Effect of vitamins C and e on antioxidant status of breast-cancer patients undergoing chemotherapy. J. Clin. Pharm. Ther. 2012;37:22–26. doi: 10.1111/j.1365-2710.2010.01237.x. [DOI] [PubMed] [Google Scholar]
- Sukkar S.G., Cella F., Rovera G.M., Nichelatti M., Ragni G., Chiavenna G. A multicentric prospective open trial on the quality of life and oxidative stress in patients affected by advanced head and neck cancer treated with a new benzoquinone-rich product derived from fermented wheat germ (Avemar) Med. J. Nutrit. Metab. 2008;1:37–42. doi: 10.3233/s12349-008-0008-4. [DOI] [Google Scholar]
- Tanaka T., Narazaki M. Therapeutic targeting of the Interleukin-6 receptor. Annu. Rev. Pharmacol. Toxicol. 2012;52:199–219. doi: 10.1146/annurev-pharmtox-010611-134715. [DOI] [PubMed] [Google Scholar]
- Tao F., Zhu J., Duan L., Wu J., Zhang J., Yao K. Anti-inflammatory effects of doxepin hydrochloride against LPS-induced C6-glioma cell inflammatory reaction by PI3K-mediated Akt signaling. J. Biochem. Mol. Toxicol. 2020;34 doi: 10.1002/jbt.22424. [DOI] [PubMed] [Google Scholar]
- Tripathi M.K., Kartawy M., Amal H. The role of nitric oxide in brain disorders: Autism spectrum disorder and other psychiatric, neurological, and neurodegenerative disorders. Redox. Biol. 2020;34 doi: 10.1016/j.redox.2020.101567. [DOI] [PMC free article] [PubMed] [Google Scholar]
- Virdi A.S., Singh N., Bains K.K., Kaur A. Effect of photoperiod and growth media on yield and antioxidant properties of wheatgrass juice of Indian wheat varieties. J. Food Sci. Technol. 2020 doi: 10.1007/s13197-020-04805-8. [DOI] [PMC free article] [PubMed] [Google Scholar]
- Ying X., Yu K., Chen X., Chen H., Hong J., Cheng S. Piperine inhibits LPS induced expression of inflammatory mediators in RAW 264. 7 cells. Cell. Immunol. 2013;285:49–54. doi: 10.1016/j.cellimm.2013.09.001. [DOI] [PubMed] [Google Scholar]
- Zhang H., Sun S.-C. NF-κB in inflammation and renal diseases. Cell Biosci. 2015;5:63. doi: 10.1186/s13578-015-0056-4. [DOI] [PMC free article] [PubMed] [Google Scholar]
- Złotek U., Szymanowska U., Jakubczyk A., Sikora M., Świeca M. Effect of arachidonic and jasmonic acid elicitation on the content of phenolic compounds and antioxidant and anti-inflammatory properties of wheatgrass (Triticum aestivum L.) Food Chem. 2019;288:256–261. doi: 10.1016/j.foodchem.2019.02.124. [DOI] [PubMed] [Google Scholar]
Associated Data
This section collects any data citations, data availability statements, or supplementary materials included in this article.