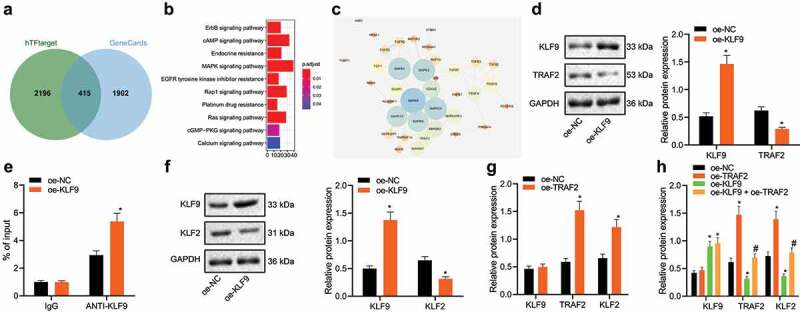
Figure 5.

KLF9 downregulates TRAF2 and KLF2 expression thereby affecting neuronal damage
A: Venn diagram summarizing the intersection of the KLF9 target gene predicted by the biological website hTFtarget and the neuronal damage-related genes in GeneCards. B: KEGG pathway enrichment analysis of 415 the identified candidate genes. The abscissa indicates number of genes and the ordinate indicates signalling pathway name. C: Interaction analysis network of 39 genes constructed by the STRING. The circles from large to small indicates the degree value of the gene, the circle colour from blue to orange indicates the degree from large to small, and the line in the middle of the circle indicates the interaction relationship between genes. D: KLF9 and TRAF2 expression detected by western blot analysis in oe-KLF9 treated neuronal cells. E: The binding of KLF9 to the TRAF2 promoter region as determined using a ChIP-qPCR approach. F: KLF2 expression detected by western blot analysis in oe-KLF9 treated neuronal cells. G: KLF9, TRAF2, and KLF2 expression determined by western blot analysis in oe-TRAF2 treated neuronal cells. H: KLF9, TRAF2, and KLF2 expression detected by western blot analysis in neuronal cells treated with oe-KLF9, oe-TRAF2 or both. *, p < 0.05, vs. oe-NC treated neuronal cells, #, p < 0.05, vs. oe-KLF9 treated neuronal cells. The measurement data were expressed as mean ± standard deviation. In panel D, E, F, and G, data were compared by unpaired t-test, and in panel H, data were compared by one-way ANOVA and Tukey’s post hoc test. The experiment was repeated three times independently.
