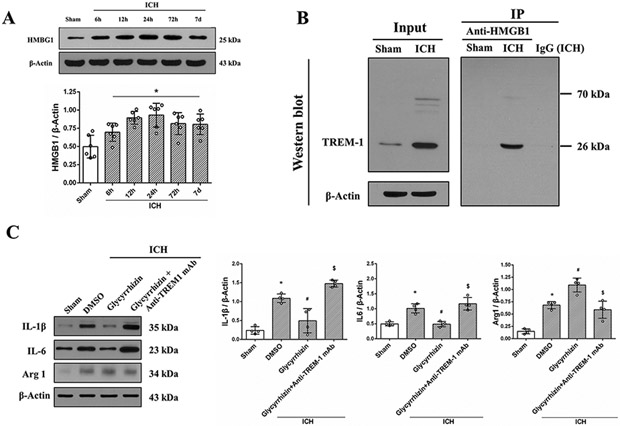
Fig. 6. HMBG1 interaction with TREM-1 modulated microglia polarization after ICH.
(A) Representative immunoblots and quantitative analysis of HMGB1 expression after ICH. The error bars represent mean±SD. *P<0.05 vs sham. N=6 per group. (B) Co-IP showed TREM-1 binding to endogenous HMBG1 was detected after ICH. (C) HMGB1 selective inhibitor, Glycyrrhizin promoted M2 microglia polarization at 24h after ICH and TREM-1 activator, anti-TREM-1 mAb reversed this effect. The error bars represent mean±SD. *P<0.05 vs sham, #P<0.05 vs ICH, $P<0.05 vs Glycyrrhizin. N=4 per group.

