

Abstract
Aims
To characterize the relationship between HbA1c variability and adverse health outcomes among US military veterans with Type 2 diabetes.
Methods
This retrospective cohort study used Veterans Affairs and Medicare claims for veterans with Type 2 diabetes taking metformin who initiated a second diabetes medication (n = 50 861). The main exposure of interest was HbA1c variability during a 3-year baseline period. HbA1c variability, categorized into quartiles, was defined as standard deviation, coefficient of variation and adjusted standard deviation, which accounted for the number and mean number of days between HbA1c tests. Cox proportional hazard models predicted mortality, hospitalization for ambulatory care-sensitive conditions, and myocardial infarction or stroke and were controlled for mean HbA1c levels and the direction of change in HbA1c levels during the baseline period.
Results
Over a mean 3.3 years of follow-up, all HbA1c variability measures significantly predicted each outcome. Using the adjusted standard deviation measure for HbA1c variability, the hazard ratios for the third and fourth quartile predicting mortality were 1.14 (95% CI 1.04, 1.25) and 1.42 (95% CI 1.28, 1.58), for myocardial infarction and stroke they were 1.25 (95% CI 1.10, 1.41) and 1.23 (95% CI 1.07, 1.42) and for ambulatory-care sensitive condition hospitalization they were 1.10 (95% CI 1.03, 1.18) and 1.11 (95% CI 1.03, 1.20). Higher baseline HbA1c levels independently predicted the likelihood of each outcome.
Conclusions
In veterans with Type 2 diabetes, greater HbA1c variability was associated with an increased risk of adverse long-term outcomes, independently of HbA1c levels and direction of change. Limiting HbA1c fluctuations over time may reduce complications.
Introduction
A substantial body of evidence shows a direct relationship between glucose control and microvascular complications (e.g. retinopathy, neuropathy and nephropathy). Higher levels of HbA1c carry greater risk of such complications, and lowering HbA1c prospectively reduces risk [1,2]. Diabetes also confers substantial cardiovascular disease (CVD) risk. While a relationship between higher HbA1c and CVD risk exists, there is no consensus that lowering HbA1c to levels < 69 mmol/mol (< 8.5%) reduces such risk. Indeed, in several major clinical trials of patients with Type 2 diabetes treated to HbA1c levels < 53 mmol/mol (< 7%) [1–3], there was not only no benefit with regard to CVD disease risk but there was evidence of increased mortality [1]. The variable relationship between glucose control and diabetes complications suggests that this relationship is complex and multifaceted.
An emerging concept is that glucose variability may contribute to both microvascular and macrovascular disease risk. Several lines of evidence show that increased glucose variability carries significant risk of short-term and long-term complications. Greater day-to-day glucose variability among hospitalized patients is associated with longer length of stay, infections and in-hospital mortality [4–6] as well as risk of asymptomatic hypoglycaemia [7,8]. Glucose variability from month to month may result in HbA1c variability. Increasing HbA1c variability is associated with retinopathy, nephropathy, cardiovascular events and possibly mortality [9–13], and may be an independent risk predictor when compared with HbA1c levels alone [9,12]. These important findings support the concept that diabetes management may be more complex than focusing only on HbA1c levels. Unfortunately, previous studies have been limited either by small sample sizes or unclear distinctions between baseline and outcome periods, raising concerns of confounding by indication.
To overcome several of these limitations, we conducted an observational study using nationwide data on military veterans diagnosed with Type 2 diabetes to assess the independent effect of baseline HbA1c variability on adverse health outcomes, controlling for mean baseline levels and the directional changes in HbA1c.
Patients and methods
Data sources
Patient-level national data from the Veterans Health Administration were used and supplemented with data from Medicare. The study was reviewed and approved by the institutional review board at the Veterans Affairs Boston Healthcare System.
Study population
Identifying patients who are at a similar point in disease progression improves comparability among patients and helps isolate the effect of HbA1c variability on health outcomes. Unfortunately, the administrative claims data used in the present study do not contain information on duration of diabetes. Nevertheless, we attempted to isolate patients who were at a similar stage in the progression of Type 2 diabetes. All prescription claims for metformin, sulphonylureas, thiazolidinediones and long-acting insulin between 2000 and 2009 were extracted from Veterans Health Administration pharmacy files. Patients were required to have an existing metformin prescription, followed by initiation of a second diabetes medication.
Patients entered the study 12 months after starting the second diabetes medication (index date) and the preceding 36 months was considered the baseline period. The addition of a new medication may introduce HbA1c variability so we included the first 12 months after that change in the calculations of baseline HbA1c variability. For example, if Patient A started a second diabetes medication on 1 January 2002, their baseline period was 1 January 2000 to 31 December 2002 (Fig. 1). HbA1c variability was measured during this baseline period. The individual entered the outcome period on 1 January 2003 and was followed up until 31 December 2010 because they did not experience any outcomes, resulting in 8 years of follow-up. If Patient B started their second diabetes medication on 1 July 2007, their baseline period was 1 July 2005 to 30 June 2008. This individual entered the outcome period on 1 July 2008, but died on 30 September 2009, with 1.25 years of follow-up.
FIGURE 1.
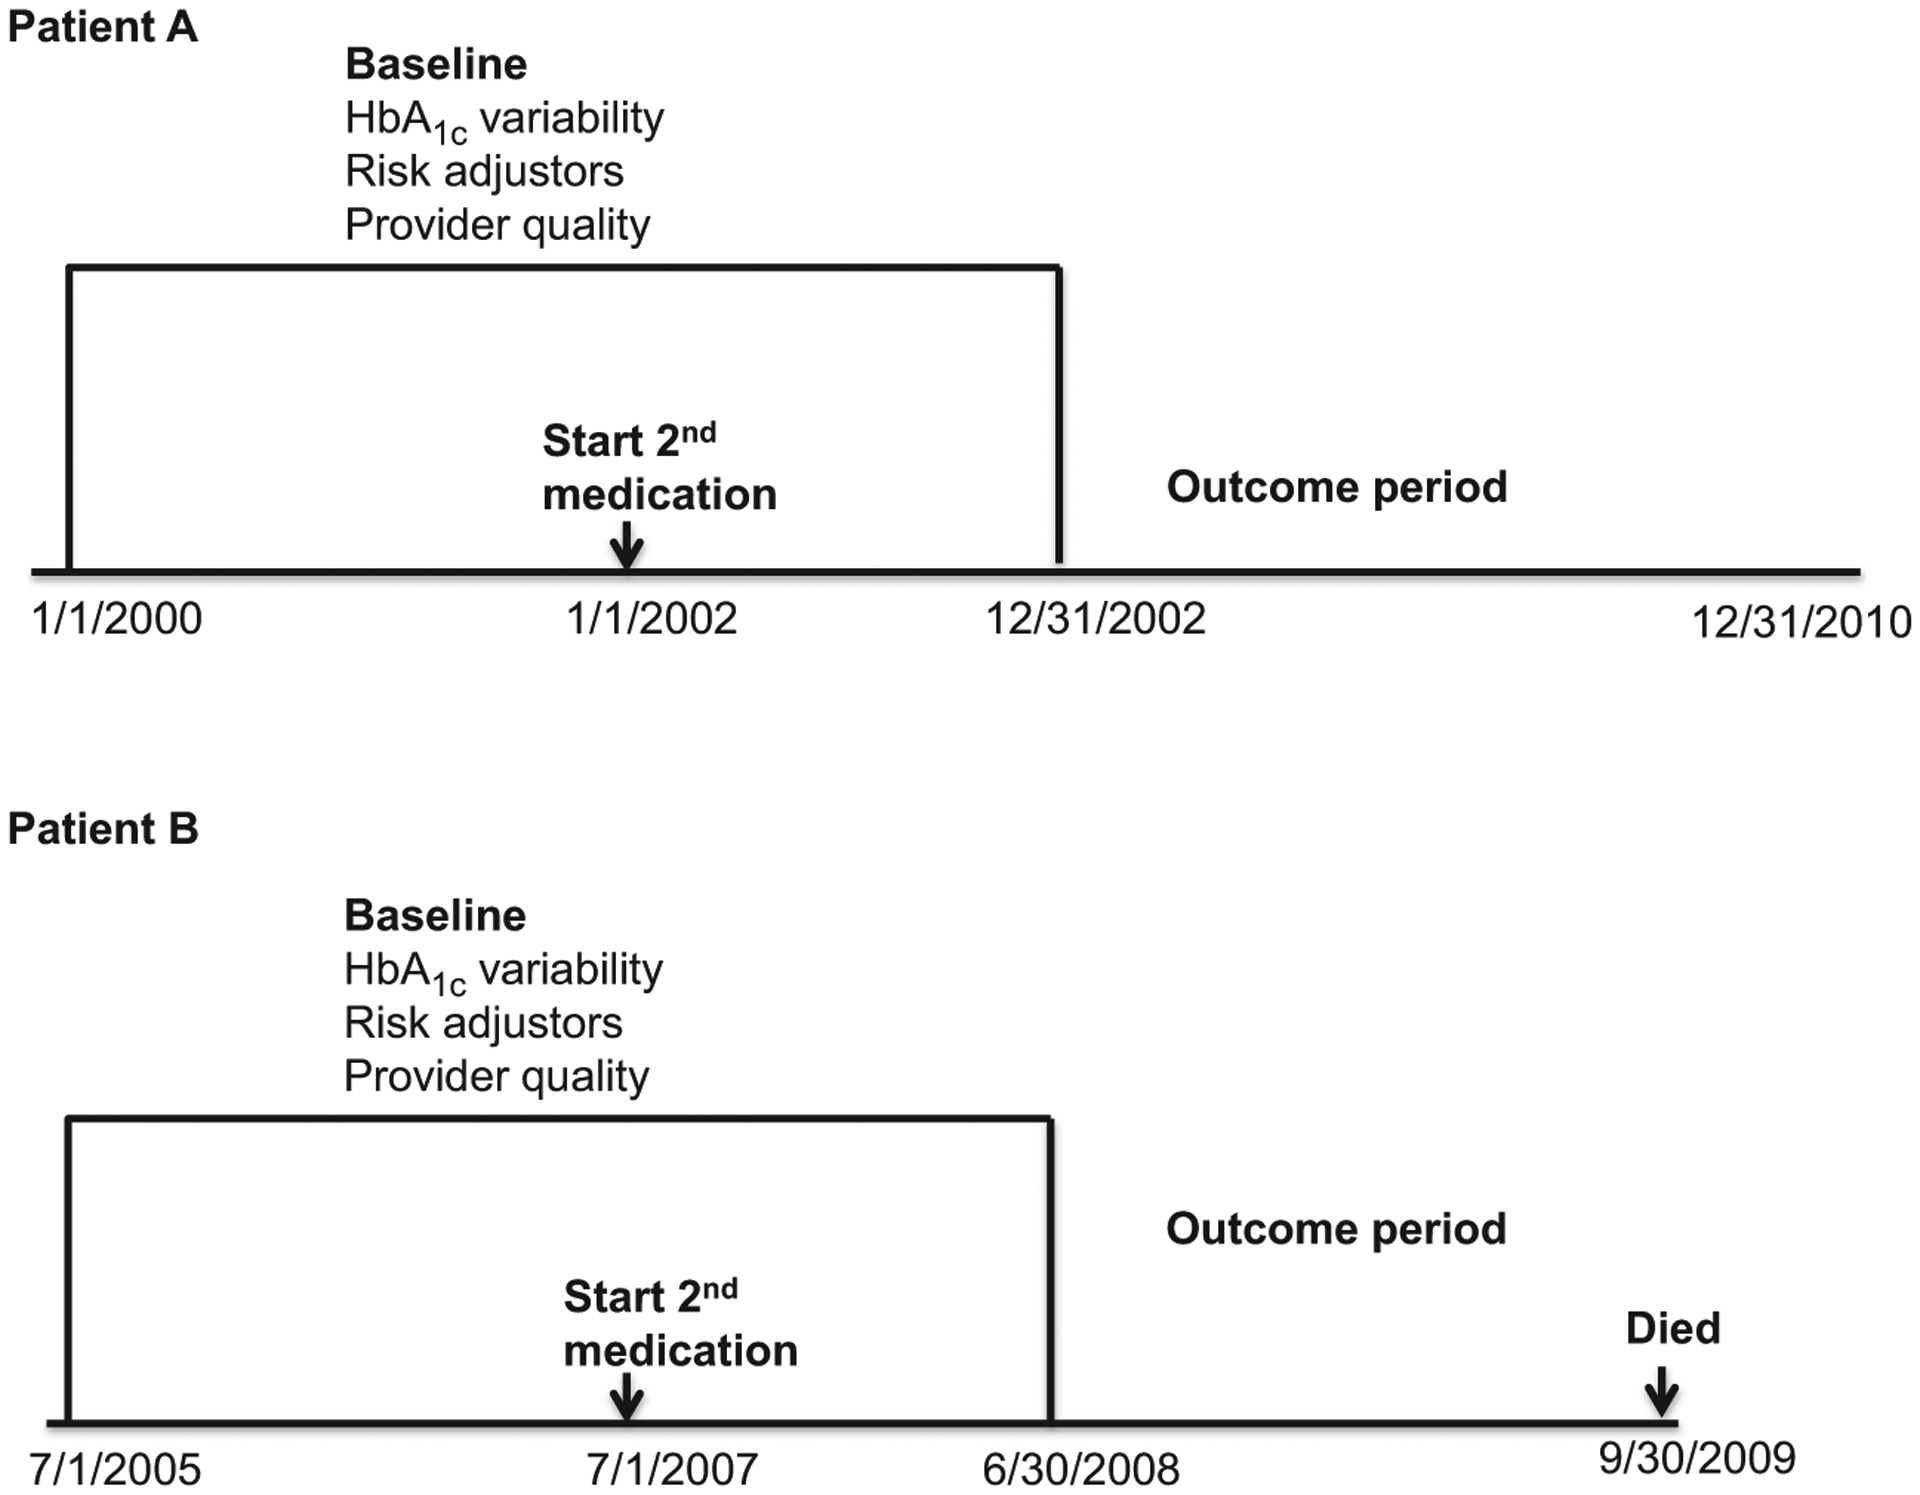
Examples of study design and timing.
Eligible individuals initiated their second diabetes medication between 2002 and 2008 (n = 301 940; Fig. 2), entered the study between 2003 and 2009 and were followed through to the end of 2010 or until they experienced any of the outcomes. We further limited the cohort to those dually enrolled in Medicare and Veterans Health Administration to ensure completeness in measures of risk adjustors and outcomes (n = 163 579), as Veterans Health Administration patients often use non-Veterans Health Administration facilities for hospital care [14]. Individuals were required to be prescribed metformin and have four or more HbA1c tests during the baseline period. After excluding those with missing data on relevant covariates, the final cohort included 50 861 patients.
FIGURE 2.
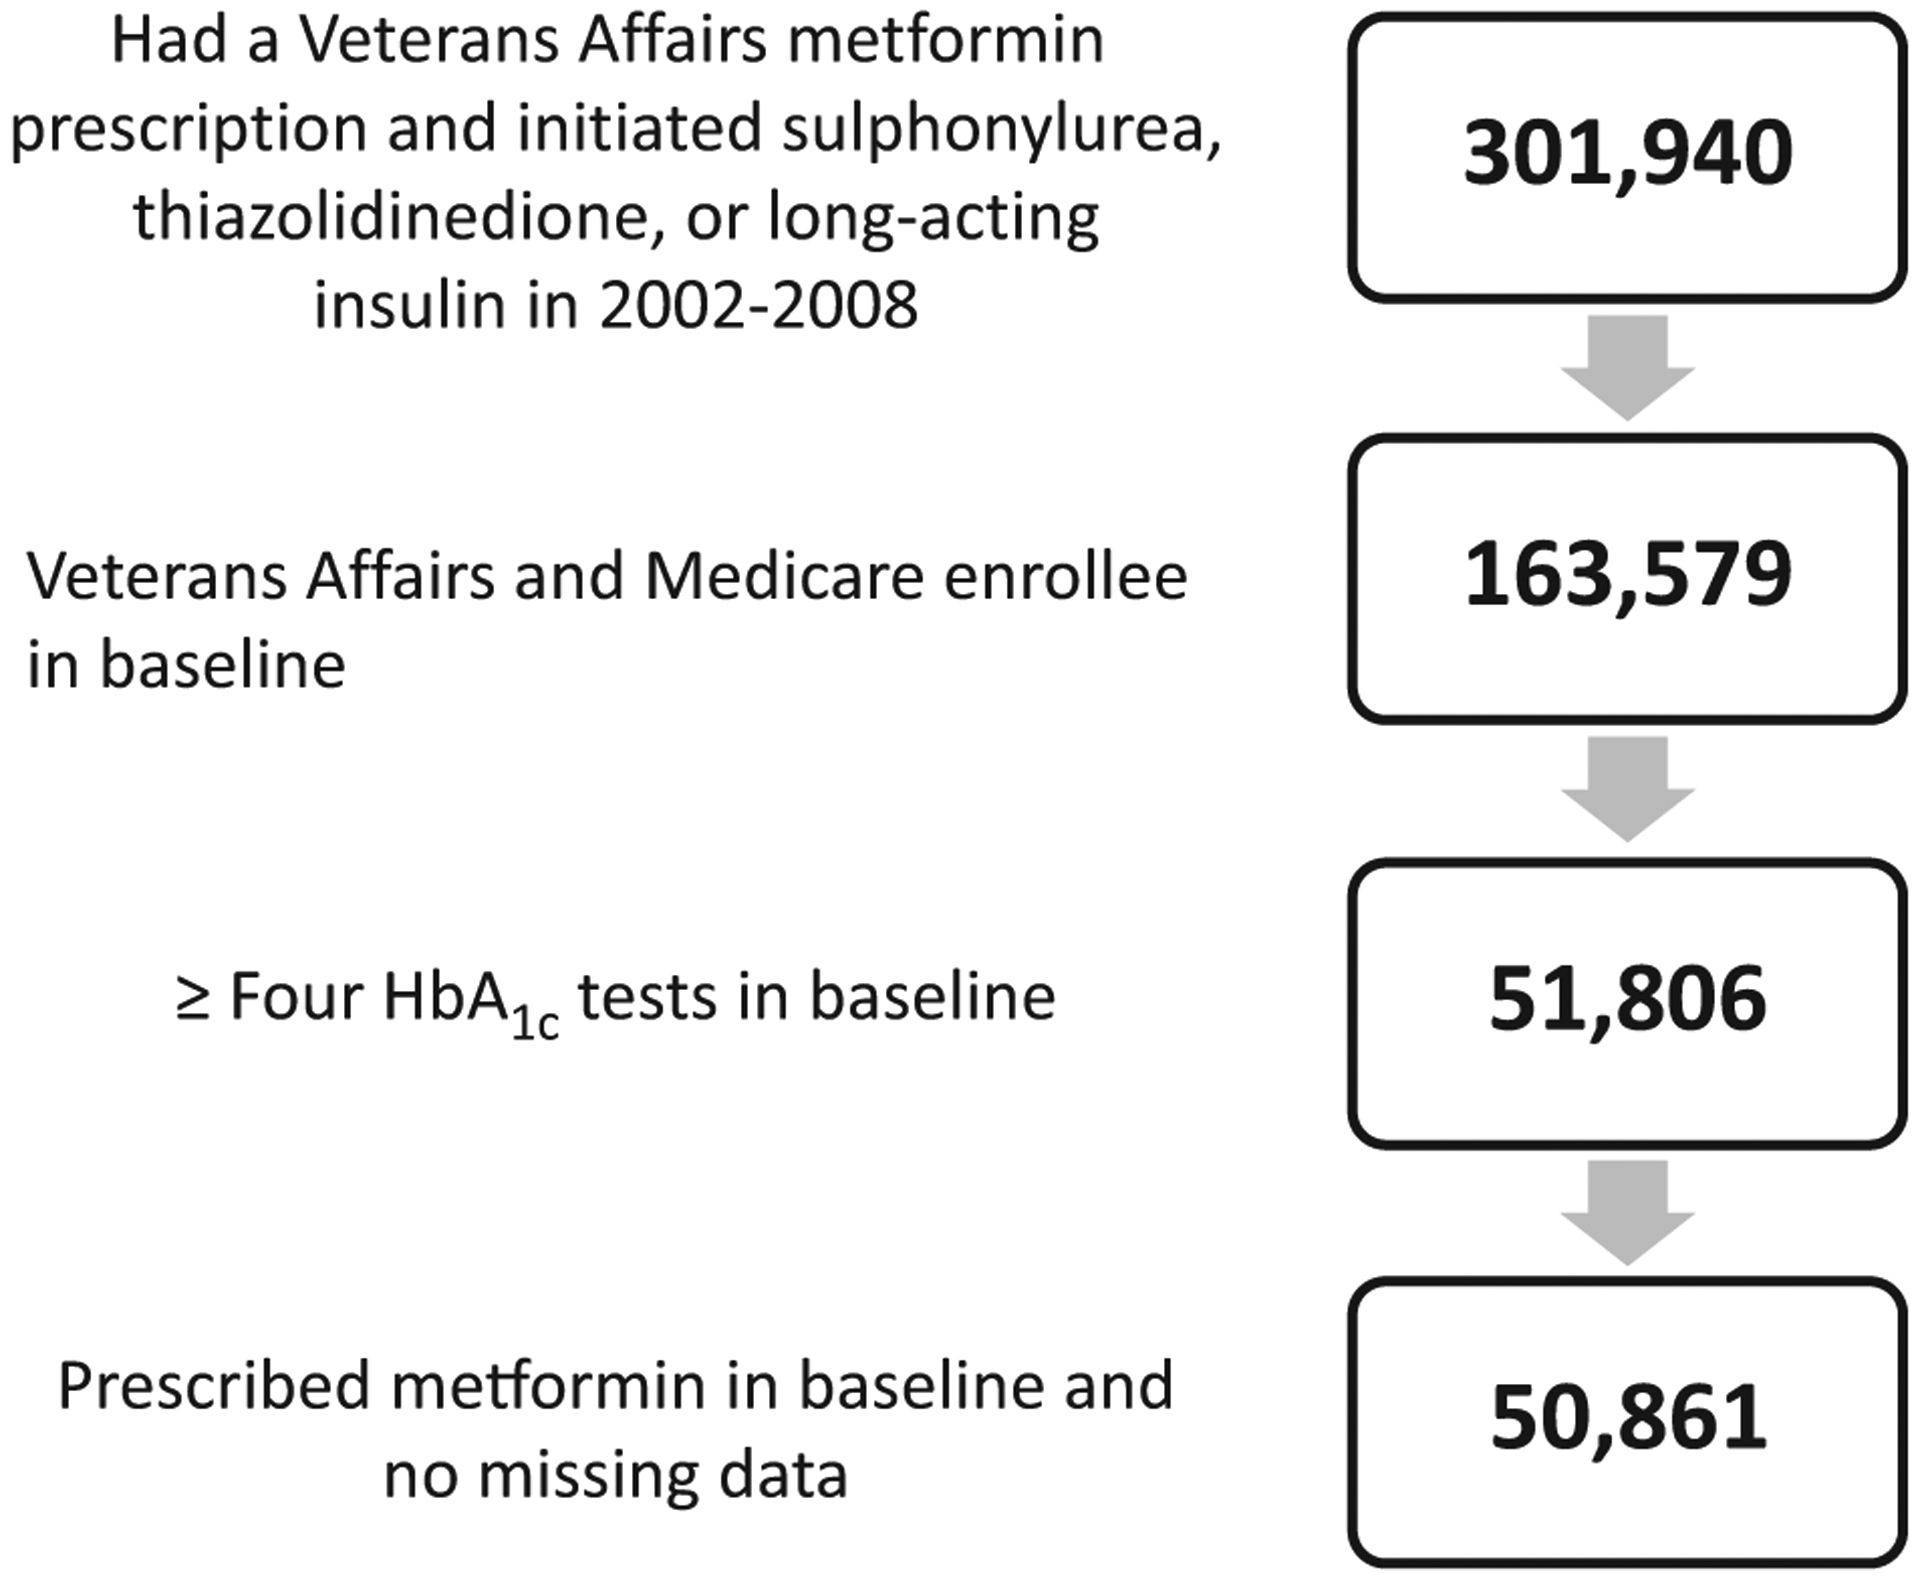
Sample selection.
aModels include baseline change in HbA1c slope, demographics, Elixhauser comorbidities, Young severity index, BMI, microalbumin, serum creatinine, blood pressure, LDL, starting a thiazolidinedione or insulin compared to sulphonylurea, provider quality controls, year fixed effects and Veterans Affairs Medical Center random effects.
HbA1c variability measure
Three different HbA1c variability measures were calculated for each individual during the baseline period. Each measure was categorized into quartiles. First, we measured standard deviation (sd). Since the number of HbA1c measurements can influence sd value (e.g. fewer measurements making the sd greater), we accounted for this in two subsequent measures [15,16]. We calculated the coefficient of variation [(HbA1c sd/ HbA1c mean)*100] and an sd value adjusted for the number of HbA1c measurements (#HbA1c) and the mean number of days between HbA1c measurements (MEAN HbA1c days) [16]. We used the following linear regression: log(sd)= log(#HbA1c)+ log(MEAN HbA1c days). Based on the coefficients and constant from this linear regression, we computed the following adjusted sd value:
Baseline HbA1c levels and directional changes
We wanted to determine if HbA1c variability had an independent effect on outcomes. Consequently, one key covariate of interest was the mean baseline HbA1c level, categorized as < 53 mmol (< 7%), ≥ 53 and < 64 mmol/mol (7–8%), ≥ 64 and < 75 mmol/mol (8–9%) and ≥ 75 mmol/mol (≥ 9%). Following previous research, we were also interested in the directional change in HbA1c, independent of variability and mean baseline HbA1c level [13]. Patients with the same mean baseline HbA1c may have different risks of adverse outcomes if HbA1c levels have a positive or a negative slope during the baseline period. We calculated the slope of HbA1c over time for each individual using linear regression. This slope was categorized into quartiles and included as a separate covariate.
Quality controls
Individual HbA1c variability may correlate with how patients with diabetes are managed at a given facility and result in biased estimates of the relationship with health outcomes; therefore, we controlled for facility-level quality of diabetes care. Three process quality variables were computed during the baseline period at the facility level. Measures were: percent of HbA1c levels ≥ 75 mmol/mol (≥ 9%); percent of blood pressure readings ≥ 140/90 mm Hg; and percent of LDL cholesterol levels > 100 mg/dL [17]. Each individual’s laboratory values were removed from their facility-level calculation.
Covariates
Additional control variables included age, sex, race, serum creatinine, urine microalbumin-creatinine ratio, blood pressure, LDL cholesterol, BMI (see Table S1 for categorizations) and type of second diabetes medication added (i.e. thiazolidinedione or insulin vs sulphonylurea). Indicator variables for calendar years that corresponded to the start of the outcome period were included because patients who entered the study later would be followed for shorter periods of time. Comorbidity measures included 29 indicator variables for physical and mental health conditions using the Elixhauser algorithm [18] and eight indicator variables for the components of the Young Diabetes Severity Index [19]. Indicator variables in the Young index measure microvascular and macrovascular complications [19]. All covariates were computed during the baseline period.
Outcomes
Outcomes included all-cause mortality, acute myocardial infarction (MI) or stroke, and hospital admission for any of 13 ambulatory care-sensitive conditions (ACSC) as defined by the Agency for Healthcare Research and Quality [20]. ACSC hospitalizations included diagnoses such as uncontrolled diabetes, short- and long-term diabetes complications, lower extremity amputation, angina, heart failure, pneumonia and others. The Veterans Affairs Vital Status File determines the date of death from Veterans Affairs, Medicare and Social Security Administration data and was used to determine all-cause mortality [21]. MI definitions and stroke definitions were based on previously published work [22,23]. The modelled outcome was the amount of time between the index date and the earliest date of any of the outcomes, with censoring at the end of the study period in 2010.
Statistical models
We used STATA version 10 to estimate the effects of HbA1c variability on the risks of outcomes using Cox proportional hazards models. The outcome equations related HbA1c variability and control variables to probabilities of death, ACSC hospitalization and stroke or MI. The Cox models assume that HbA1c variability affects outcome risk by a constant proportion over time. We tested this assumption using scaled Schoenfeld residuals from the all-cause mortality and hospitalization equations [24]. Finally, to control for facility quality differences we included a facility-level random effect.
Sensitivity tests
The study population consisted of individuals who started a second diabetes medication in the third year of their baseline period. Introducing a second medication may increase HbA1c variability by lowering HbA1c levels from a higher baseline, but may also reduce the HbA1c variability measure if it triggers an increased number of HbA1c tests. To test the robustness of our results, we also measured HbA1c variability during a 2-year baseline period, with the index date changed to when the individual started the second medication (Appendices S3–S5).
Results
The study population included 50 861 individuals with Type 2 diabetes who were older (mean age 66 years) and largely male and of whom 86% were white (Table 1). Five percent had a mean HbA1c ≥ 75 mmol/mol (≥ 9%) and 19–35% had prevalent retinopathy, nephropathy, neuropathy or peripheral vascular disease during the baseline period. Patients also had high rates of CVD risk factors, including 56% with obesity, 38% with mean LDL cholesterol ≥ 100 mg/dl and 57% with cardiovascular complications based on the Young Diabetes Severity Index. In the outcome period, 9% of patients died, 18% had an ACSC hospitalization and 5% experienced a stroke or MI.
Table 1.
Selected descriptive demographic, comorbidity and outcome statistics (n = 50 861)*
| Demographics | |
|---|---|
| Mean ± sd age, years | 65.64 ± 9.42† |
| Male, n (%) | 49 629 (98) |
| White, n (%) | 43 730 (86) |
| HbA1c measures | |
| Mean ± sd HbA1c variability measures, mmol/mol (%) | |
| sd | 0.81 ± 0.67 |
| Coefficient of variation | 10.78 ± 7.67 |
| Adjusted standard deviation | 1.29 ± 1.04 |
| Mean HbA1c levels, n (%) | |
| < 53 mmol/mol (< 7%) | 22 834 (45) |
| ≥ 53 mmol/mol (≥ 7%) and < 64 mmol/mol (< 8%) | 19 214 (38) |
| ≥ 64 mmol/mol (≥ 8%) and < 75 mmol/mol (< 9%) | 6031 (12) |
| ≥ 75 mmol/mol (≥ 9%) | 2782 (5) |
| Mean ± sd HbA1c overall trends, mmol/mol (%) | |
| Slope coefficient | −0.0005 ± 0.003 |
| Diabetes complications, n (%) | |
| Retinopathy‡ | 12 312 (24) |
| Nephropathy‡ | 9500 (19) |
| Neuropathy‡ | 17 749 (35) |
| Cerebrovascular‡ | 9568 (19) |
| Cardiovascular (some)‡ | 12 568 (25) |
| Cardiovascular (severe)‡ | 16 262 (32) |
| Peripheral vascular complications‡ | 10 566 (21) |
| Metabolic complications‡ | 792 (2) |
| Cardiovascular comorbidities, n (%) | |
| BMI defined as overweight | 16 080 (32) |
| BMI defined as obese | 28 372 (56) |
| High blood pressure | 17 933 (35) |
| Mean LDL > 100 mg/dl | 19 074 (38) |
| Congestive heart failure§ | 9045 (18) |
| Cardiac arrhythmias§ | 15 046 (30) |
| Valvular disease§ | 7287 (14) |
| Pulmonary circulatory disorder§ | 1430 (3) |
| Chronic pulmonary disease§ | 17 276 (34) |
| Outcomes, n (%) | |
| All-cause mortality | 4759 (9) |
| ACSC hospitalization | 9261 (18) |
| MI or stroke | 2676 (5) |
ACSC, ambulatory care-sensitive conditions; MI, myocardial infarction.
For complete descriptive statistics refer to Table S1.
Values are n (%) unless indicated otherwise.
Young severity index
Elixhauser comorbidity
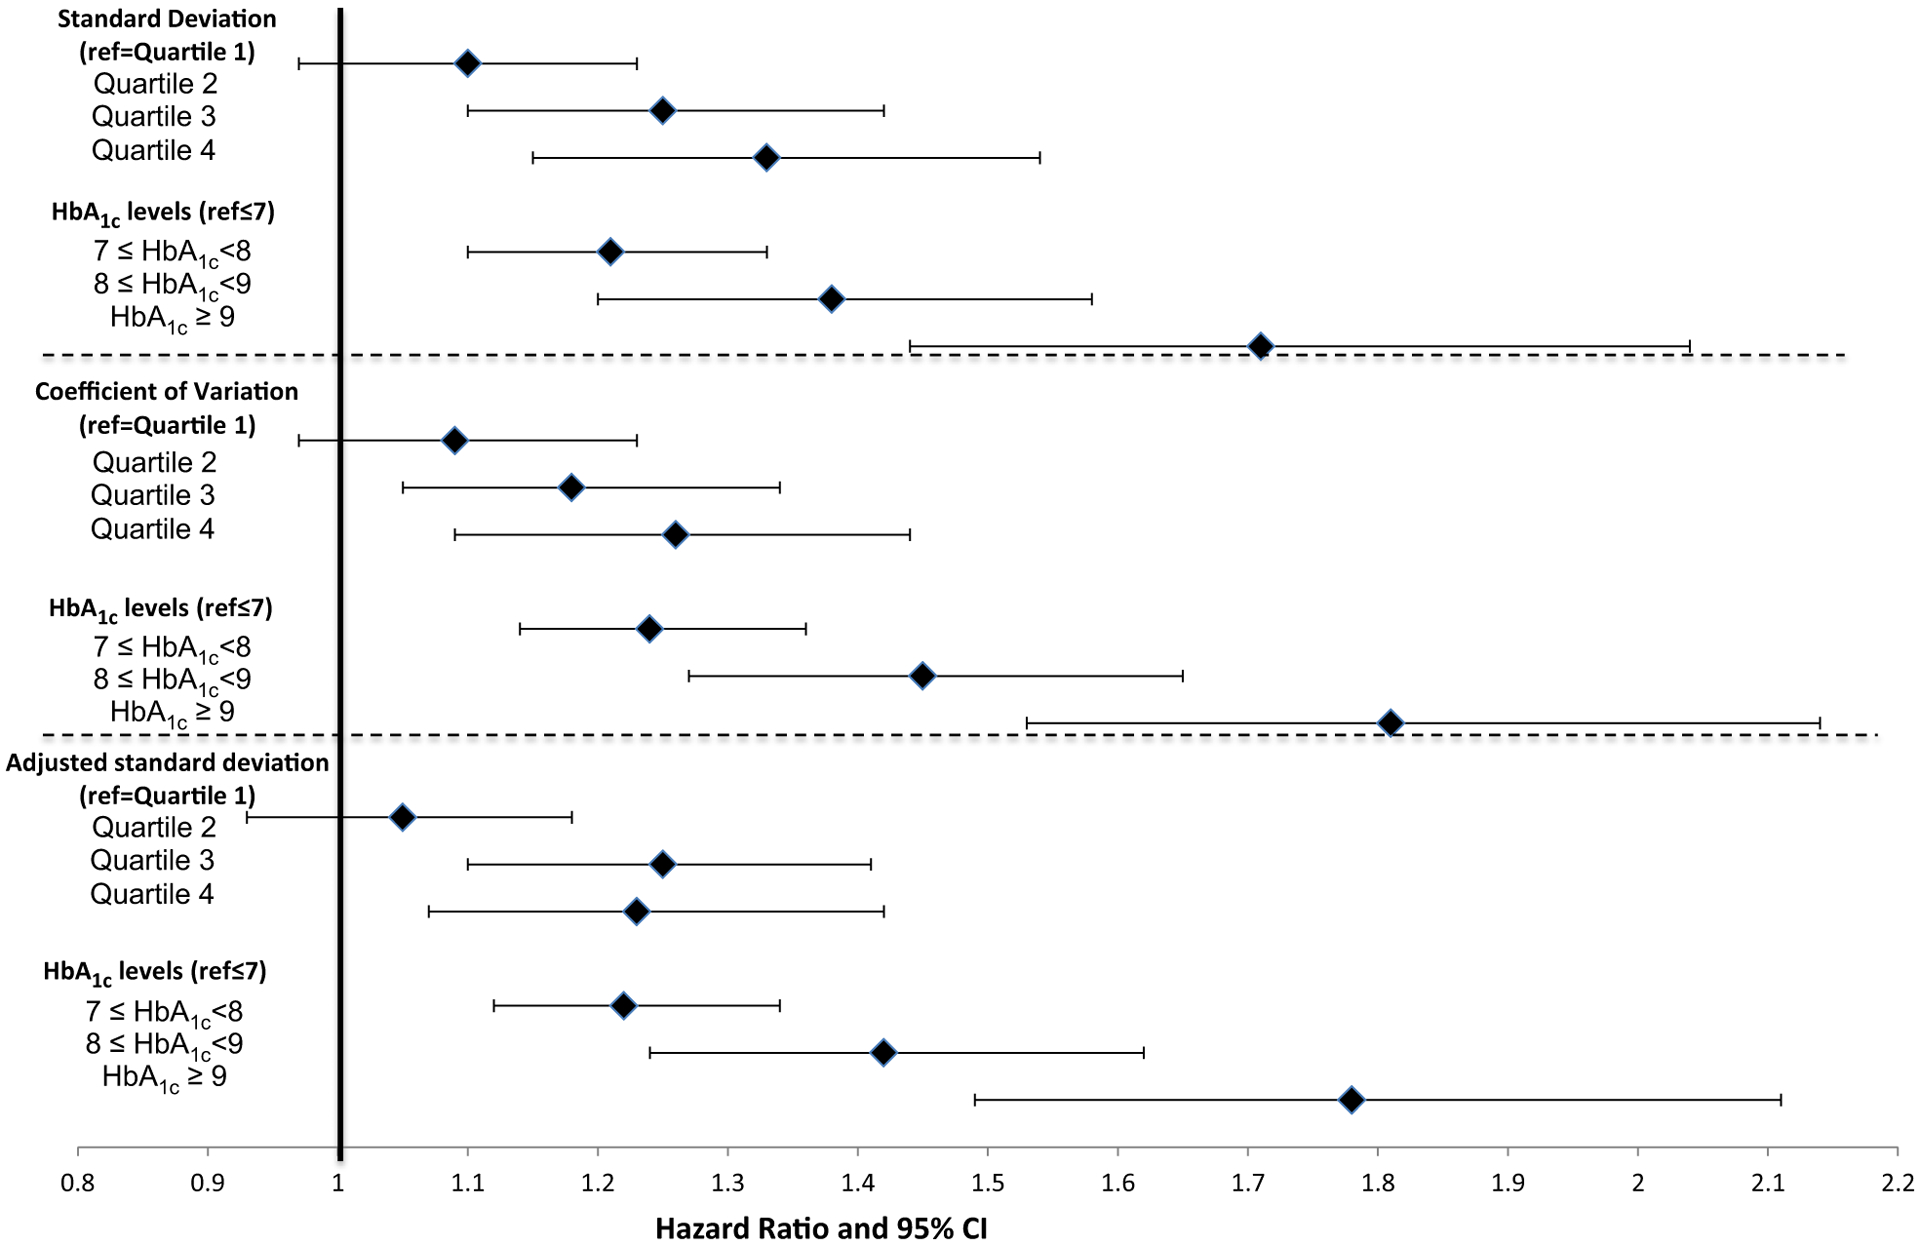
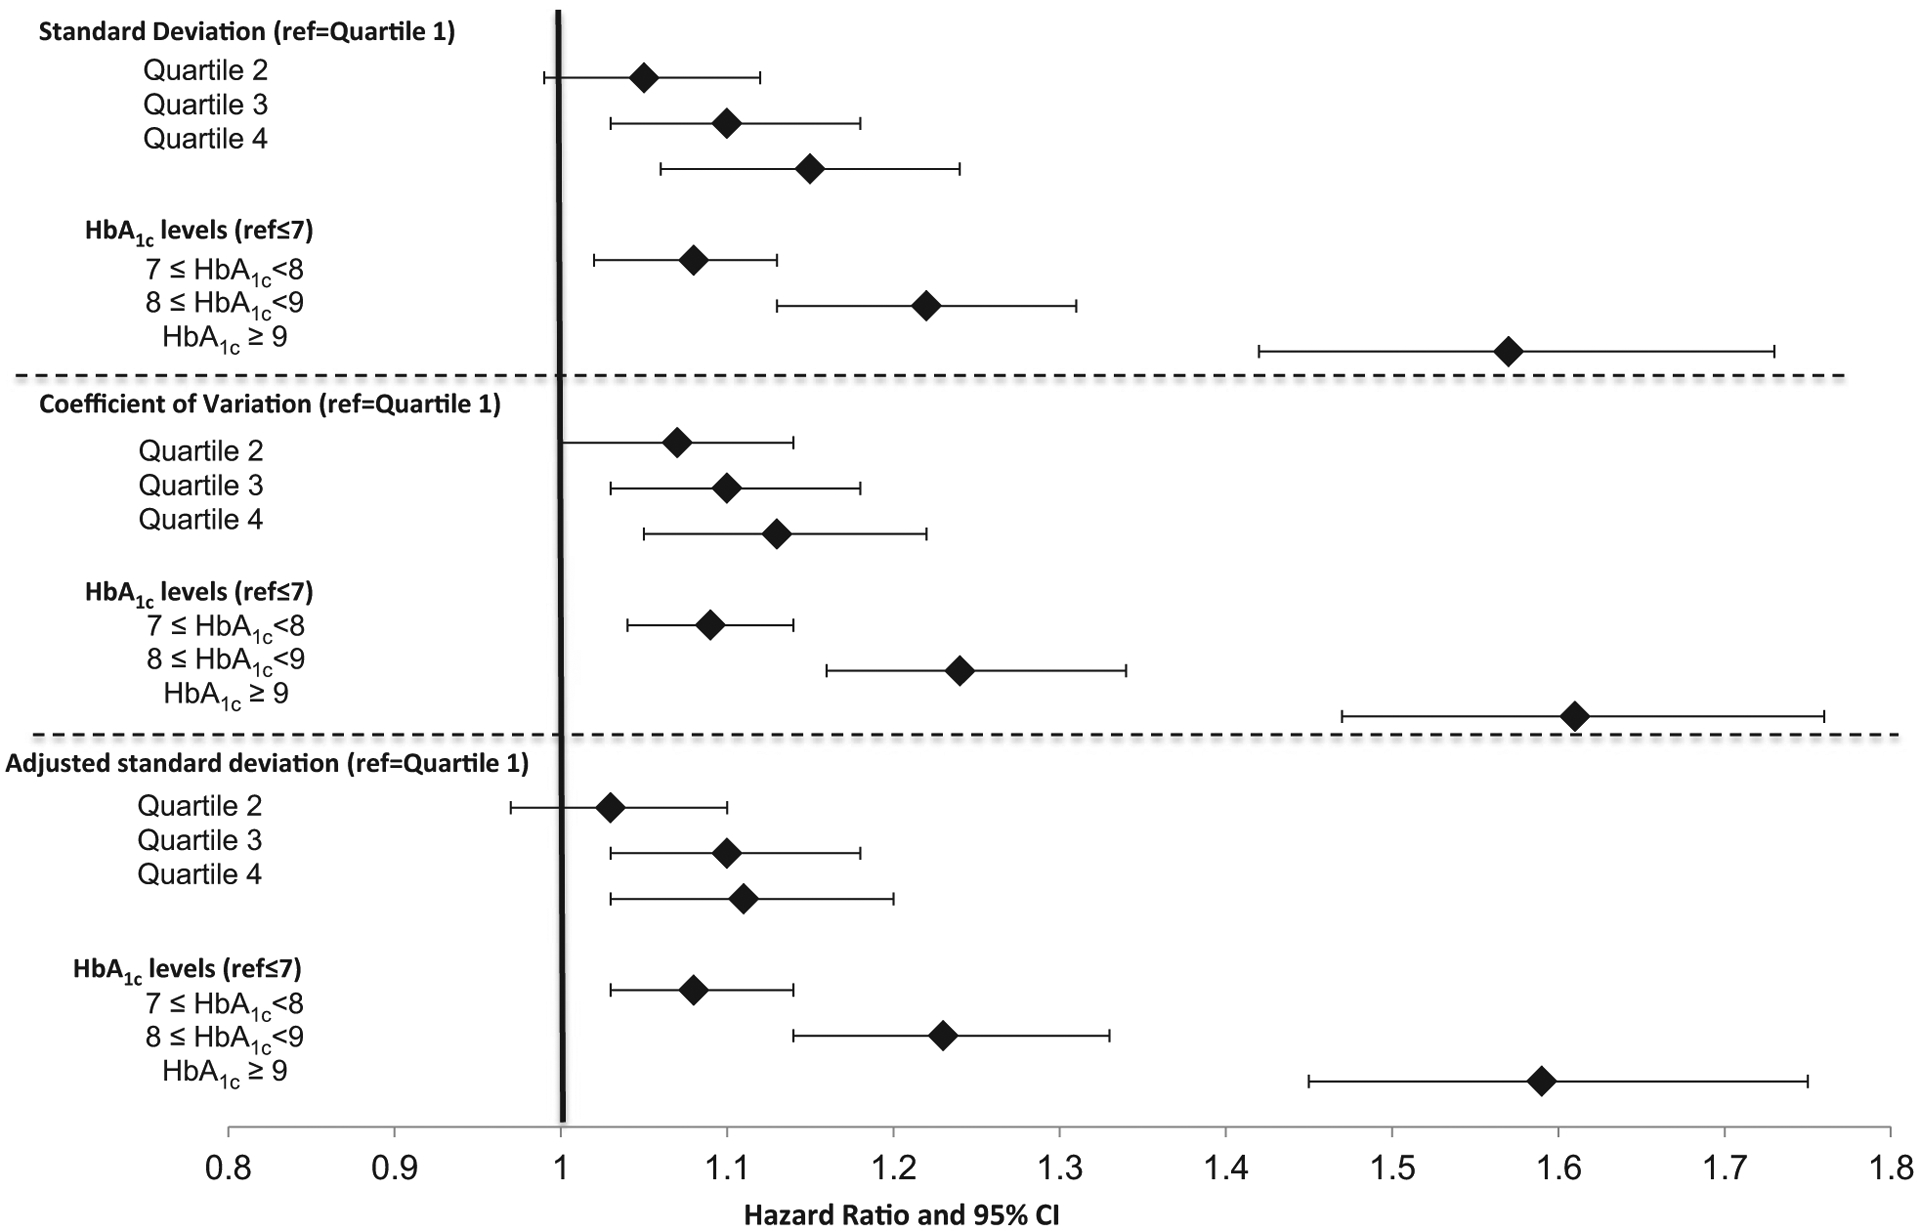
Over a mean 3.3 years of follow-up, there was a consistent relationship between greater HbA1c variability and the likelihood of experiencing each health outcome (Figs 3–5). Models included HbA1c variability, mean HbA1c levels, the directional trend of HbA1c levels, covariates and quality controls. The hazard ratio predicting each outcome generally increased throughout the quartiles for each of three HbA1c variability measures. Hazard ratios for the third or fourth quartile were significantly higher for each outcome compared with individuals in the first quartile. For example, using the adjusted sd measure, the hazard ratios for mortality were 1.14 (95% CI 1.04, 1.25) and 1.42 (95% CI 1.28, 1.58) in the third and fourth quartiles, respectively (Fig. 3; see Table S2 for complete estimates from this model). For ACSC hospitalization, the hazard ratios were 1.10 (95% CI 1.03, 1.18) and 1.11 (95% CI 1.03, 1.20; Fig. 4), and for MI or stroke, third and fourth quartile hazard ratios were 1.25 (95% CI 1.10, 1.41) and 1.23 (95% CI 1.07, 1.42), respectively (Fig. 5).
FIGURE 3.
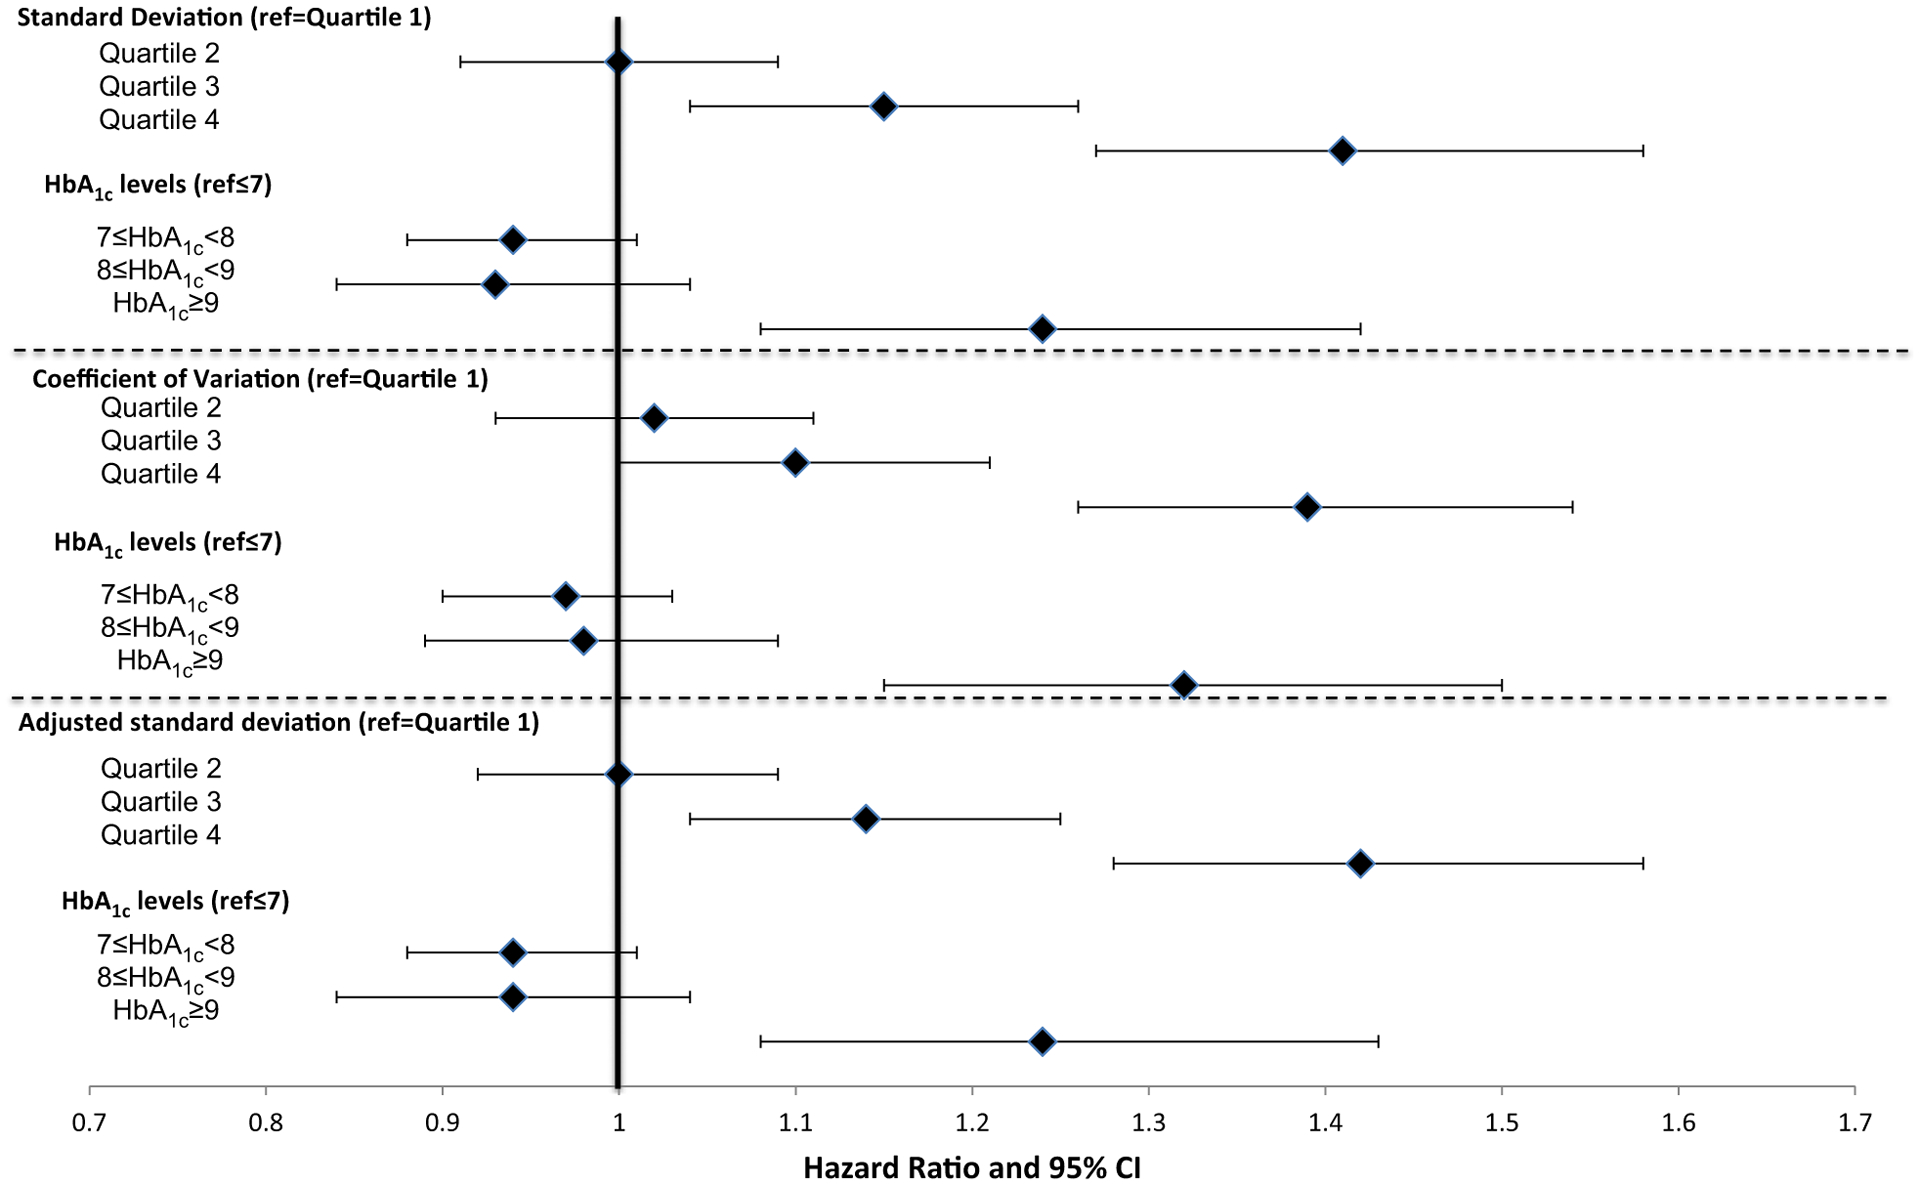
Effect of HbA1c variability and levels on mortality (n = 50 861).
aModels include baseline change in HbA1c slope, demographics, Elixhauser comorbidities, Young severity index, BMI, microalbumin, serum creatinine, blood pressure, LDL, starting a thiazolidinedione or insulin compared to sulphonylurea, provider quality controls, year fixed effects and Veterans Affairs Medical Center random effects
FIGURE 5.
Effect of HbA1c variability and levels on myocardial infarction or stroke (n = 50 861).
FIGURE 4.
Effect of HbA1c variability and levels on hospitalization for ambulatory care-sensitive conditions (n = 50 861).
aModels include baseline change in HbA1c slope, demographics, Elixhauser comorbidities, Young severity index, BMI, microalbumin, serum crea nine, blood pressure, LDL, starting a thiazolidinedione or insulin compared to sulphonylurea, provider quality controls, year fixed effects and Veterans Affairs Medical Center random effects.
Higher baseline HbA1c levels also independently predicted risk of each health outcome (Figs 3–5). HbA1c ≥ 53 mmol/mol (> 7%) significantly increased the odds of both ACSC hospitalization and MI or stroke. Mean HbA1c ≥ 75 mmol/mol (≥ 9%) significantly increased the odds of mortality. In general, the hazard ratios were larger with higher mean HbA1c levels. HbA1c slope during the baseline period did not have a consistent and significant effect on outcomes, but there were indications that the highest quartile (i.e. more positive slope) could be associated with slightly greater risk of MI, stroke and ASCS hospitalization (data not shown).
Sensitivity analyses using similar models and a 2-year rather than a 3-year baseline period for HbA1c variability resulted in a smaller study population (n = 27 398). Qualitatively similar results were noted (Tables S3–S5). Individuals in the highest quartile of HbA1c variability were more likely to experience mortality, ASCS hospitalization, and MI or stroke compared with individuals in the first quartile.
Discussion
We found that greater HbA1c variability significantly increased the likelihood of mortality, MI or stroke, and ACSC hospitalization for veterans with Type 2 diabetes. The effect of HbA1c variability was independent of baseline HbA1c levels or directional trends. As expected, the mean baseline HbA1c level also significantly predicted each outcome in the same models. Our findings are consistent with those of other clinical studies that found that higher HbA1c variability significantly increases the risk of incident CVD [16] and mortality [10,11,13]. We also found a previously unexamined relationship between increased HbA1c variability and risk of hospitalization for ACSC.
To illustrate the effect of HbA1c variability on adverse health outcomes, one can consider the risk of mortality using the adjusted sd measure. An individual with baseline HbA1c ≥ 75 mmol/mol (≥ 9%) but in the lowest quartile for HbA1c variability had a 24% greater risk of death compared with an individual with baseline HbA1c level < 53 mmol/mol (< 7%) who was also in the lowest quartile for HbA1c variability. By contrast, an individual with baseline HbA1c level < 53 mmol/mol (< 7%) but in the fourth quartile for HbA1c variability had a 42% greater risk of death compared with an individual with baseline HbA1c level < 53 mmol/mol (< 7%) who was also in the lowest quartile for HbA1c variability. These results highlight how diabetes management may be affected by the additional risk information conveyed by HbA1c variability measures.
Aspects of the study design increase its validity and strengthen the evidence for an independent effect of HbA1c variability on adverse health outcomes. This study used nationwide data from electronic medical records on a large population of veterans. Consequently, the final sample size was almost five times larger than previous studies that used clinical trial data or registry information from selected facilities. We measured HbA1c variability during a 3-year baseline period and used these baseline values to predict health outcomes for up to 8 years. The clearly delineated baseline and outcome periods in this study increase the likelihood that our findings are causal because variability is measured before outcomes are observed, reducing the danger of reverse causation. Additionally, we included measures of facility-level process quality to control for differences in practice style.
Despite these strengths, the main limitation of the present study was that we cannot be certain that the relationship was causal. Future research is needed to apply other experimental methods to verify whether HbA1c variability causes poor health outcomes or whether the relationship is attributable to unobservable factors. The study has other limitations that could be addressed by future research. We attempted to identify patients at a similar stage in their disease progression as evidenced by the need for a second diabetes medication. Adding a new medication may alter HbA1c variability so we included the first 12 months after that change in the calculations of HbA1c variability. Results from sensitivity analyses that excluded this 12-month period were qualitatively similar. Nevertheless, the administrative claims data used for this study did not have reliable information on duration of diabetes. Future research could select a broader study population in whom the duration of diabetes is known, to further validate the relationship between HbA1c variability and health outcomes and to determine if HbA1c variability influences adverse health outcomes in different ways throughout disease progression. For example, HbA1c variability could have less impact on outcomes early in the course of disease. Our study population was largely male and had low-income status so results may not be generalizable to other populations. Future studies should focus on important subpopulations to determine if the effect of HbA1c variability differs among demographic groups.
The potential mechanisms underlying the observations in the present study are as yet uncertain. A few mechanistic studies have evaluated the cellular effects of glucose variability. In vitro and in vivo studies show that short-term glucose fluctuations significantly increase oxidative stress. In vitro, increased glucose variability enhances the release of inflammatory cytokines, and glucose oscillations induce endothelial dysfunction in both healthy subjects and patients with diabetes [25,26]. Daily glucose fluctuations are associated with oxidative stress, carotid intimal thickness and increased left ventricular mass [26,27]. Among hospitalized patients, greater day-to-day glucose variability is associated with adverse outcomes, including longer length of stay, infections and in-hospital mortality [4–6] as well as risk of asymptomatic hypoglycaemia [7,8]. Nonetheless, there remain substantial gaps in our understanding of the links between diabetes treatment, glucose variability, HbA1c variability and complications.
A direct relationship between HbA1c variability and micro- and macrovascular complications and mortality has important clinical implications. Clinical measures that prospectively identify individuals who are at higher risk of complications will have great relevance to patients, clinicians and policy-makers. For example, potential overtreatment in current Type 2 diabetes management sits at the intersection of overuse of low value practices and medication safety. Several diabetes clinical practice guidelines now recommend that HbA1c levels be targeted to a range that balances benefits and harms for a given patient [28,29]; however, many older patients are potentially overtreated to near-normal HbA1c levels [30], with the likelihood of also amplifying HbA1c variability and exposing them to risks of macrovascular complications, hospitalization and decreased life expectancy.
In summary, patients with Type 2 diabetes and higher HbA1c variability are at increased risk of mortality, ACSC hospitalization and MI or stroke. Limiting the range of HbA1c fluctuations over time and adhering to guideline-directed HbA1c target levels may reduce the risk of diabetes complications.
Supplementary Material
Table S1. Descriptive demographic, comorbidity, and outcome statistics (n = 50 861).
Table S2. Cox proportional hazard model predicting mortality (n = 50 861).
Table S3. Cox proportional hazard models: effect of HbA1c variability and levels on mortality: 2-year baseline (n = 27 398).
Table S4. Cox proportional hazard models: effect of HbA1c variability and levels on myocardial infarction or stroke (n = 27 398): 2-year baseline.
Table S5. Cox proportional hazard models: effect of HbA1c variability and levels on hospitalization for ambulatory care-sensitive conditions: 2-year baseline (n = 27 398).
What’s new?
Glucose variability over time may contribute to microvascular and macrovascular complications. This retrospective cohort study uses data on US military veterans diagnosed with Type 2 diabetes (n = 50 861) to examine the relationship between HbA1c variability and health outcomes.
Greater HbA1c variability is associated with increased risk of mortality, hospitalization for ambulatory care-sensitive conditions and myocardial infarction or stroke.
The models controlled for mean HbA1c levels and the direction of change in HbA1c levels, emphasizing the independent effect HbA1c variability has on outcomes.
Limiting the range of HbA1c fluctuations over time may reduce adverse complications in patients with Type 2 diabetes.
Acknowledgements
The authors are indebted to Donglin Li and Aaron Legler for programming support. The views expressed in this article are those of the authors and do not necessarily reflect the position and policy of the US Federal Government or the Department of Veterans Affairs. No official endorsement from the VA, Boston University, Northeastern University or Harvard University should be inferred.
Funding sources
This study was supported by research grants (IIR 10-136) from the Department of Veterans Affairs Health Services Research and Development Service and from the Agency for Healthcare Research and Quality (R01 HS019708).
Footnotes
Competing interests
None declared.
Supporting Information
Additional Supporting Information may be found in the online version of this article:
References
- 1.Action to Control Cardiovascular Risk in Diabetes Study Group, Gerstein HC, Miller ME, Byington RP, Goff DC Jr, Bigger JT et al. Effects of intensive glucose lowering in type 2 diabetes. N Engl J Med 2008; 358: 2545–2559. [DOI] [PMC free article] [PubMed] [Google Scholar]
- 2.ADVANCE Collaborative Group, Patel A, MacMahon S, Chalmers J, Neal B, Billot L et al. Intensive blood glucose control and vascular outcomes in patients with type 2 diabetes. N Engl J Med 2008; 358: 2560–2572. [DOI] [PubMed] [Google Scholar]
- 3.Duckworth W, Abraira C, Moritz T, Reda D, Emanuele N, Reaven PD et al. Glucose control and vascular complications in veterans with type 2 diabetes. N Engl J Med 2009; 360: 129–139. [DOI] [PubMed] [Google Scholar]
- 4.Eslami S, Taherzadeh Z, Schultz MJ, Abu-Hanna A. Glucose variability measures and their effect on mortality: a systematic review. Intensive Care Med 2011; 37: 583–593. [DOI] [PMC free article] [PubMed] [Google Scholar]
- 5.Mellbin LG, Malmbertg K, Ryden L, Wedel H, Vestberg D, Lind M. The relationship between glycemic variability and cardiovascular complications in patients with acute myocardial infarction and type 2 diabetes: a report from the DIGAMI 2 trial. Eur Heart J 2013; 34: 374–379. [DOI] [PubMed] [Google Scholar]
- 6.Mendez CE, Mok KT, Ata A, Tanenberg RJ, Calles-Escandon J, Umpierrez GE. Increased glycemic variability is independently associated with length of stay and mortality in noncritically ill hospitalized patients. Diabetes Care 2013; 36: 4091–4097. [DOI] [PMC free article] [PubMed] [Google Scholar]
- 7.Monnier L, Wojtusciszyn A, Colette C, Owens D. The contribution of glucose variability to asymptomatic hypoglycemia in persons with type 2 diabetes. Diabetes Technol Ther 2011; 13: 813–818. [DOI] [PubMed] [Google Scholar]
- 8.Kim Y, Rajan KB, Sims SA, Wroblewski KE, Reutrakul S. Impact of glycemic variability and hypoglycemia on adverse hospital outcomes in non-critically ill patients. Diabetes Res Clin Pract 2014; 103: 437–443. [DOI] [PubMed] [Google Scholar]
- 9.Kilpatrick ES, Rigby AS, Atkin SL. A1C variability and the risk of microvascular complications in type 1 diabetes: data from the Diabetes Control and Complications Trial. Diabetes Care 2008; 31: 2198–2202. [DOI] [PMC free article] [PubMed] [Google Scholar]
- 10.Zoppini G, Verlato G, Targher G, Bonora E, Trombetta M, Muggeo M. Variability of body weight, pulse pressure and glycaemia strongly predict total mortality in elderly type 2 diabetic patients. The Verona Diabetes Study. Diabetes Metab Res Rev 2008; 24: 624–628. [DOI] [PubMed] [Google Scholar]
- 11.Ma WY, Li HY, Pei D, Hsia TL, Lu KC, Tsai LY et al. Variability in hemoglobin A1c predicts all-cause mortality in patients with type 2 diabetes. J Diabetes Complications 2012; 26: 296–300. [DOI] [PubMed] [Google Scholar]
- 12.Waden J, Forsblom C, Thorn LM, Gordin D, Saraheimo M, Groop P. A1c variability predicts incident cardiovascular events, microalbuminuria, and overt diabetic nephropathy in patients with type 1 diabetes. Diabetes 2009; 58: 2649–2655. [DOI] [PMC free article] [PubMed] [Google Scholar]
- 13.Skriver MV, Sandbaek A, Kristensen JK, Stovring H. Relationship of HbA1c variabilty, absolute changes in HbA1c, and all-cause mortality in type 2 diabetes: a Danish population-based prospective observational study. BMJ Open Diabetes Res Care 2015; 2: e00060. [DOI] [PMC free article] [PubMed] [Google Scholar]
- 14.Hynes DM, Koelling K, Stroupe K, Arnold N, Mallin K, Sohn MW et al. Veterans’ access to and use of Medicare and Veterans Affairs health care. Med Care 2007; 45: 214–223. [DOI] [PubMed] [Google Scholar]
- 15.Penno G, Solini A, Zoppini G, Orsi E, Fondelli C, Zerbini G et al. Hemoglobin A1c variability as an independent correlate of cardiovascular disease in patients with type 2 diabetes: a cross-sectional analysis of the renal insufficiency and cardiovascular events (RIACE) Italian multicenter study. Cardiovasc Diabetol 2013; 12: 98. [DOI] [PMC free article] [PubMed] [Google Scholar]
- 16.Luk AO, Ma RC, Lau ES, Yang X, Lau WW, Yu LW et al. Risk association of HbA1c variability with chronic kidney disease and cardiovascular disease in type 2 diabetes: prospective analysis of the Hong Kong Diabetes Registry. Metab Res Rev 2013; 29: 384–390. [DOI] [PubMed] [Google Scholar]
- 17.Prentice JC, Conlin PR, Gellad WF, Edelman D, Lee TA, Pizer SD. Capitalizing on Prescribing Pattern Variation to Compare Medications for Type 2 Diabetes. Value Health 2014; 17: 854–862. [DOI] [PubMed] [Google Scholar]
- 18.Elixhauser A, Steiner C, Harris DR, Coffey RM. Comorbidity measures for use with administrative data. Med Care 1998; 36: 8–27. [DOI] [PubMed] [Google Scholar]
- 19.Young BA, Lin E, Von Korff M, Simon G, Ciechanowski P, Ludman EJ et al. Diabetes Complications Severity Index and Risk of Mortality, Hospitalization, and Healthcare Utilization. Am J Manag Care 2008; 14: 15–24. [PMC free article] [PubMed] [Google Scholar]
- 20.Agency for Health Care Resarch and Quality (AHRQ). 2013. Prevention Quality Indicators Technical Specifications– Version 4.5, May 2013. Available at: http://www.qualityindicators.ahrq.gov/Modules/PQI_TechSpec.aspx. Last accessed 1 August 2013.
- 21.Arnold N, Sohn M-W, Maynard C, Hynes DM. “VA-NDI Mortality Merge Project.” In VIReC Technical Report 2, edited by VA Information Resource Center, Hines, IL: VA Information Resource Center, 2006. [Google Scholar]
- 22.Kyota Y, Schneeweiss S, Glynn RJ, Cannuscio CC, Avorn J, Solomon DH. Accuracy of Medicare Claims-based Diagnosis of Acute Myocardial Infarction: Estimating Positive-Predictive Value on the Basis of Review of Hospital Records. Am Heart J 2004; 148: 99–104. [DOI] [PubMed] [Google Scholar]
- 23.Reker DM, Rosen AK, Hoenig H, Berlowitz DR, Laughlin J, Anderson L et al. The hazards of stroke case selection using administrative data. Med Care 2002; 40: 96–104. [DOI] [PubMed] [Google Scholar]
- 24.Grambsch PM, Therneau TM. Proportional hazards tests and diagnostics based on weighted residuals. Biometrika 1994; 81: 515–526. [Google Scholar]
- 25.Esposito K, Nappo F, Marfella R, Giugliano G, Giugliano F, Ciotola M et al. Inflammatory cytokine concentrations are acutely increased by hyperglycemia in humans: role of oxidative stress. Circulation 2002; 106: 2067–2072. [DOI] [PubMed] [Google Scholar]
- 26.Monnier L, Mas E, Ginet C, Michel F, Villon L, Cristol JP et al. Activation of oxidative stress by acute glucose fluctuations compared with sustained chronic hyperglycemia in patients with type 2 diabetes. JAMA 2006; 295: 1681–1687. [DOI] [PubMed] [Google Scholar]
- 27.Di Flaviani A, Picconi F, Di Stefano P, Giordani I, Malandrucco I, Maggio P et al. Impact of glycemic and blood pressure variability on surrogate measures of cardiovascular outcomes in type 2 diabetic patients. Diabetes Care 2011; 34: 1605–1609. [DOI] [PMC free article] [PubMed] [Google Scholar]
- 28.American Diabetes Association. Standards of Medical Care in Diabetes. Diabetes Care 2015; 38: S1–S93. [DOI] [PubMed] [Google Scholar]
- 29.Department of Veterans Affairs (VA) and Department of Defense (DoD). VA/DoD Clinical Practice Guideline for the Management of Diabetes Mellitus. 2010; Version 4.0.
- 30.Tseng CL, Soroka O, Maney M, Aron DC, Pogach LM. Assessing potential glycemic overtreatment in persons at hypoglycemic risk. JAMA Intern Med 2014; 174: 259–268. [DOI] [PubMed] [Google Scholar]
Associated Data
This section collects any data citations, data availability statements, or supplementary materials included in this article.
Supplementary Materials
Table S1. Descriptive demographic, comorbidity, and outcome statistics (n = 50 861).
Table S2. Cox proportional hazard model predicting mortality (n = 50 861).
Table S3. Cox proportional hazard models: effect of HbA1c variability and levels on mortality: 2-year baseline (n = 27 398).
Table S4. Cox proportional hazard models: effect of HbA1c variability and levels on myocardial infarction or stroke (n = 27 398): 2-year baseline.
Table S5. Cox proportional hazard models: effect of HbA1c variability and levels on hospitalization for ambulatory care-sensitive conditions: 2-year baseline (n = 27 398).