

Abstract
Hypoxia-induced insulin resistance appears to suppress exogenous glucose oxidation during metabolically matched aerobic exercise during acute (<8 h) high-altitude (HA) exposure. However, a better understanding of this metabolic dysregulation is needed to identify interventions to mitigate these effects. The objective of this study was to determine if differences in metabolomic profiles during exercise at sea level (SL) and HA are reflective of hypoxia-induced insulin resistance. Native lowlanders (n = 8 males) consumed 145 g (1.8 g/min) of glucose while performing 80-min of metabolically matched treadmill exercise at SL (757 mmHg) and HA (460 mmHg) after 5-h exposure. Exogenous glucose oxidation and glucose turnover were determined using indirect calorimetry and dual tracer technique ([13C]glucose and [6,6-2H2]glucose). Metabolite profiles were analyzed in serum as change (Δ), calculated by subtracting postprandial/exercised state SL (ΔSL) and HA (ΔHA) from fasted, rested conditions at SL. Compared with SL, exogenous glucose oxidation, glucose rate of disappearance, and glucose metabolic clearance rate (MCR) were lower (P < 0.05) during exercise at HA. One hundred and eighteen metabolites differed between ΔSL and ΔHA (P < 0.05, Q < 0.10). Differences in metabolites indicated increased glycolysis, tricarboxylic acid cycle, amino acid catabolism, oxidative stress, and fatty acid storage, and decreased fatty acid mobilization for ΔHA. Branched-chain amino acids and oxidative stress metabolites, Δ3-methyl-2-oxobutyrate (r = −0.738) and Δγ-glutamylalanine (r = −0.810), were inversely associated (P < 0.05) with Δexogenous glucose oxidation. Δ3-Hydroxyisobutyrate (r = −0.762) and Δ2-hydroxybutyrate/2-hydroxyisobutyrate (r = −0.738) were inversely associated (P < 0.05) with glucose MCR. Coupling global metabolomics and glucose kinetic data suggest that the underlying cause for diminished exogenous glucose oxidative capacity during aerobic exercise is acute hypoxia-mediated peripheral insulin resistance.
Keywords: branched-chain amino acids, fatty acids, glycogenolysis, high altitude, substrate oxidation
INTRODUCTION
Acute high-altitude (HA) exposure (<8 h) suppresses exogenous glucose oxidation during steady-state aerobic exercise compared with metabolically matched exercise at sea level (SL) (1–4). In two separate studies (1, 4), our laboratory observed that consuming exogenous glucose during metabolically matched, steady-state aerobic exercise was associated with higher concentrations of circulating glucose and insulin, and lower rates of exogenous glucose oxidation during acute HA exposure compared with SL. Furthermore, glucose rate of disappearance (Rd) and metabolic clearance rate (MCR), kinetic measures indicative of glucose uptake and utilization (5, 6), were both lower at HA compared with SL (1). Collectively, these metabolic dysregulations suggest that acute hypoxia elicits peripheral insulin resistance in healthy exercising adults (7). Although our glucose kinetics and circulating glucose and insulin responses suggest impaired insulin sensitivity as a potential mechanism contributing to the reduction in exogenous glucose oxidation, a better understanding of this metabolic dysregulation is required to identify interventions to mitigate these effects of acute HA exposure.
Nontargeted metabolomics analysis is a methodological approach that may provide greater insight into metabolic alterations that manifest when exogenous glucose oxidation is impaired at HA. This approach provides a comprehensive and sensitive analysis, allowing for the simultaneous measurement of hundreds to thousands of metabolites which can capture changes in whole body metabolism (8, 9). Metabolite profiling may provide greater insight into hypoxia-induced insulin resistance as a mechanism resulting in changes in metabolic pathways associated with impaired substrate oxidation, mobilization, and storage. Recent investigations have used metabolite profiling to gain a greater understanding into metabolic alterations with altitude acclimatization of ≥14 days (10, 11). This approach has also been effectively used to characterize metabolic dysregulation between healthy individuals and those with insulin resistance or type 2 diabetes (12–14). In addition, individual metabolites of branched-chain amino acid (BCAA) metabolism and oxidative stress have been identified as markers of these disease states (12–14). Identifying similar patterns in healthy adults during aerobic exercise at HA would strengthen evidence of hypoxia-induced insulin resistance and aid in identifying potential therapeutic targets.
The objective of this study was to assess the effects of acute HA exposure on changes in global metabolomic profiles during aerobic exercise while consuming carbohydrate. We hypothesized that metabolomic profiles would differ between SL and HA, and that these differences would be reflective of hypoxia-induced insulin resistance. In addition, metabolites that differ between SL and HA will be associated with reductions in exogenous glucose oxidation rate, glucose Rd, and MCR at HA compared with SL.
METHODS AND MATERIALS
Participants
Participants in this study were a part of a larger randomized crossover study that examined the impact of acute HA (hyperbaric hypoxia) on exogenous glucose oxidation and glucose turnover during metabolically matched, steady-state aerobic exercise compared with SL (1). Eight healthy, recreationally active men (age: 23 ± 2 yr) completed the study. Individuals were excluded from participation if they had any metabolic, cardiovascular, or gastrointestinal disorders, prior diagnosis of high-altitude pulmonary edema or high-altitude cerebral edema, evidence of apnea or other sleeping disorders, presence of asthma or respiratory tract infection (<1 mo of data collection), taking medications that interferes with oxygen delivery, anemia (HCT < 38% and Hgb < 12.5 g/dL), sickle cell anemia/trait, born at altitudes >2,100 m, living at altitudes >1,200 m, were smokers, refused to abstain from alcohol, smokeless tobacco, and dietary supplement use during the study, had musculoskeletal injury that compromised ability to exercise, or donated blood with 8 wk of beginning the study. All data collection took place at the United States Army Research Institute of Environmental Medicine (USARIEM, Natick, MA), during November and December 2018. This study was approved by the Institutional Review Board at the US Army Medical Research and Development Command (MRDC, Fort Detrick, MD; www.clinicaltrials.gov; NCT03851744).
Height (Seritex, Inc., Carlstadt, NJ), body mass (WB-110A, Tanita, Tokyo, Japan), and body composition (dual energy X-ray absorptiometry, DPX-IQ, GE Lunar Corporation, Madison, WI), were used to characterize the participants (body mass: 83 ± 9 kg, height: 178 ± 7 cm, body mass index: 26 ± 3 kg/m2, fat mass: 21 ± 5 kg, fat-free mass: 63 ± 5 kg). Peak oxygen uptake (V̇o2peak) was assessed during a progressive intensity, treadmill (Trackmaster TMX425C, Newton, KA) running exercise test using an indirect, open circuit respiratory system (True Max 2400, Parvo Medics, Sandy, UT) to prescribe exercise intensities. Participants completed assessments of V̇o2peak under SL (4.3 ± 0.2 L/min) and HA (2.9 ± 0.2 L/min) conditions.
Study Design
As previously described (1), to normalize the effects of diet and exercise on endogenous carbohydrate stores before the experiments, 48 h before testing, participants completed a glycogen depletion protocol by cycling (Lode, BV, The Netherlands) at various intensities until failure (15), and were then fed a controlled diet (5.9 ± 0.2 g/kg/day carbohydrate, 1.2 ± 0.1 g/kg/day protein, and 1.0 ± 0.1 g/kg/day fat) before each study arm. At the conclusion of the normalization phase, participants reported to the hypobaric chamber after a 10-h overnight fast to complete the trial under SL (757 mmHg) and HA (460 mmHg) conditions. To match our previous work (16), participants rested quietly while exposed to SL or HA conditions for 5 h, and then they completed 80 min of metabolically matched, steady-state exercise on a treadmill, while consuming 145 g of glucose (1.8 g/min). Glucose turnover was assessed using 6-6-[2H2]glucose tracer methodologies. Indirect calorimetry and breath sampling for 13C/12C expired in CO2 were used to determine carbohydrate and fat oxidation during exercise at SL and HA. Blood samples for metabolomics analysis were collected 20 min before exercise under resting, fasted conditions at SL, and after 40 min of aerobic exercise at both SL and HA conditions. After a minimum 7-day washout period, participants returned to the laboratory to complete the second arm of the investigation. Treatment (SL vs. HA) order was randomized using a random numbers generator to avoid order bias.
Steady-State Treadmill Exercise
After 48 h of controlled feeding and exercise, participants reported to the hypobaric chamber after a 10-h overnight fast to complete the trial under SL (757 ± 10 mmHg) or HA (459 ± 2 mmHg) conditions. To match our previous work (4), participants sat quietly while exposed to SL or HA conditions for 5 h. They then completed 80 min of steady-state exercise on a treadmill, while consuming 145 g of glucose (1.8 g/min) enriched with 200 mg [13C]glucose (Cambridge Isotope Laboratory, Andover, MA). Treadmill speed (3.7 ± 0.3 mph) and grade (2% ± 0%) were matched between conditions to match the absolute exercise intensity between SL (V̇o2: 1.66 ± 0.14 L/min, 329 ± 28 kcal) and HA (V̇o2: 1.59 ± 0.10 L/min, 320 ± 19 kcal). Glucose turnover was assessed using a primed (82.2 μmol/kg), continuous (0.78 μmol/kg/min) infusion of 6-6-[2H2]glucose, provided 2 h before and throughout exercise. Participants ingested 58 g carbohydrate immediately before exercise, followed by consumption of 29 g carbohydrate at 20, 40, and 60 min during exercise. The carbohydrate drink was prepared by the Combat Feeding Directorate (Natick, MA), containing corn-derived dextrose (CERELOSE, Ingredion, Westchester, IL). Nutrient content was confirmed using gas chromatography (Covance Laboratories, Inc., Madison, WI). Indirect calorimetry and breath sampling for 13C/12C expired in CO2 were used to determine carbohydrate and fat oxidation during exercise at SL and HA.
Exogenous Glucose Oxidation and Turnover
As previously reported (1), exogenous glucose oxidation during metabolically matched, steady-state aerobic exercise was calculated using equations by Peronnet et al. (17) under SL and HA conditions. The Steele equation (18) with modifications for nonsteady state was used to calculate glucose Rd and MCR under SL and HA conditions. The differences in exogenous glucose oxidation, Rd, and MCR between SL and HA conditions were used in the current analysis to determine associations of these primary outcome measures of the parent study to metabolite concentrations during exercise.
Metabolomics
Serum samples for metabolomics analysis were collected by antecubital intravenous draw at 20 min before exercise under resting, fasted at SL, and after 40 min of aerobic exercise while consuming carbohydrate at SL and HA conditions. Samples were centrifuged at 3,000 rpm at 4°C for 10 min. Serum was then stored at −80°C until analysis. Samples were analyzed using four separate methods: two separate reverse phase (RP)/ultrahigh performance liquid chromatography-tandem mass spectroscopy (UPLC-MS/MS) methods with positive ion mode electrospray ionization (ESI), a RP/UPLC-MS/MS method with negative ion mode ESI, and a hydrophilic interaction (HILIC)/UPLCMS/MS method with negative ion mode ESI (Metabolon Inc., Morrisville, NC). Technical replicates, blanks, internal standards, and several recovery standards were analyzed with experimental samples for quality control. Raw data were extracted, peaks identified, and quality control processed using proprietary hardware and software. The relative quantitation values are based on integrated peak areas (area under the curve). All samples were analyzed on an equivalency basis based on volume.
Metabolites were identified by automated comparison of the ion features in the experimental samples to a references library of chemical standard entries that included retention time, molecular weight (m/z), preferred adducts, and in-source fragments as well as associated MS spectra, and were curated by visual inspection for quality control using software developed at Metabolon (Metabolon, Inc.) (19, 20). The level of identification for the majority of the compounds detected meets the highest standard of metabolite identification according to the Metabolomics Standards Initiative (21). Several types of controls were analyzed in concert with the experimental samples. A pooled matrix sample was generated by taking a small volume of each experimental sample to serve as a technical replicate throughout the dataset. Extracted water samples served as process blanks. A cocktail of quality control standards that would interfere with the measurement of endogenous compounds was spiked into every analyzed sample to allow instrument performance monitoring and aided chromatographic alignment. Instrument variability was determined by calculating the median relative standard deviation (RSD) for the standards that were added to each sample before injection into the mass spectrometers. Overall process variability was determined by calculating the median RSD for all endogenous metabolites (i.e., noninstrument standards) present in 100% of the pooled matrix samples.
Statistical Analysis
Sample size calculations were based on primary study outcome of exogenous glucose oxidation, which has been previously reported (1). Analyses were completed using R v4.0.3, SPSS v26 (IBM Analytics; Armonk, NY), ArrayStudio (Omicsoft, Corp.; Cary, NC), and MetaboAnalyst v.5.0 (22). Before analysis of metabolomics data, any missing values were imputed using the minimum observed peak area for each compound. Peak area for each metabolite was then normalized to set the mean equal to 0, and log10 transformed to meet model assumptions. Metabolites were analyzed as change (Δ), calculated by subtracting peak area during postprandial/exercised state SL (ΔSL) and HA (ΔHA) from peak area during fasted, rested conditions at SL.
Orthogonal projections to latent structures discriminant analysis, hierarchical clustering of Euclidean distances, and pattern hunter analysis were conducted using MetaboAnalyst v.5.0 (22) to assess the effect of condition (ΔSL vs. ΔHA) on changes in global metabolite profiles. Paired t test was also used to determine differences between ΔSL and ΔHA. Statistically significant differences were then associated with between-condition differences (Δ) in exogenous glucose oxidation, glucose Rd, and MCR using Spearman’s correlation coefficient. To account for multiple comparisons, the Benjamini–Hochberg method was used to estimate false discovery rate (Q value). Statistical significance was set at P < 0.05 and Q < 0.10.
RESULTS
As previously reported (1), exogenous glucose oxidation was 0.09 ± 0.09 g/min lower (P < 0.05), Glucose Rd was 1.66 ± 1.69 mg/kg/min lower, and MCR was 3.11 ± 3.00 mg/kg/min lower (P < 0.05) during metabolically matched, steady-state exercise at HA compared with SL.
Metabolomics analysis measured 1,162 metabolites. Of those, 952 could be identified. Orthogonal projections to latent structures discriminant analysis demonstrated a clear separation in metabolite profiles by condition (Fig. 1). Hierarchical clustering and pattern search analysis identified multiple metabolites that clustered together and were most strongly associated with differences between conditions (Fig. 2, A and B). In total, 188 metabolites demonstrated significant (P < 0.05, Q < 0.10) differences between ΔSL and ΔHA (Supplemental Table S1; see https://doi.org/10.6084/m9.figshare.14597352). Of those significant metabolites, 8% were within glycolysis and tricarboxylic acid (TCA) cycle pathways, 39% were within amino acid metabolism pathways, 2% were oxidative stress pathways, and 15% were within fatty acid metabolism pathways.
Figure 1.
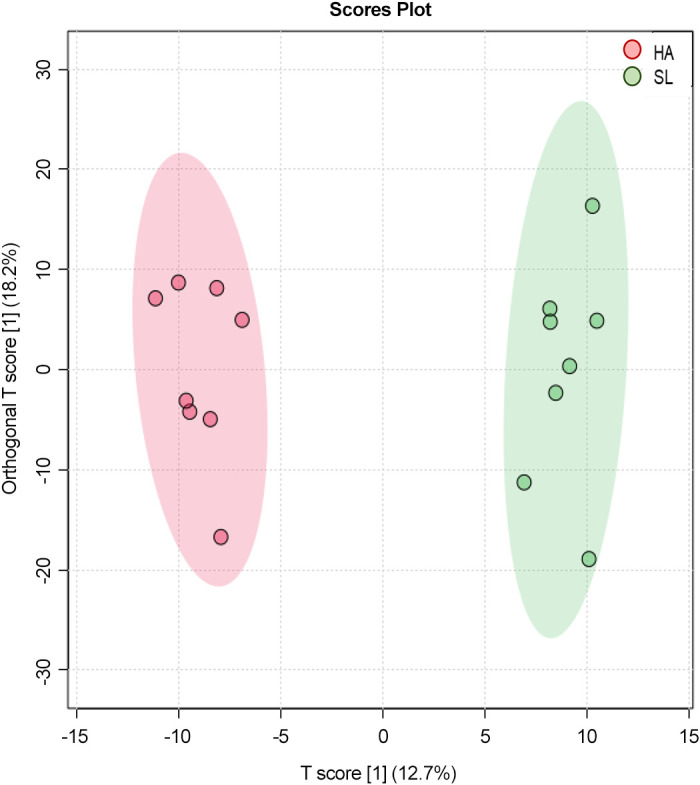
Orthogonal projections to latent structures discriminant analysis score plot for all metabolite features samples based on subject (n = 8) and condition [sea level (SL) and high altitude (HA)]. Circles represent individuals participants under each experimental condition.
Figure 2.

A: heatmap of hierarchical cluster analysis of the 50 metabolites with the lowest Q values between changes in sea level (ΔSL) and high altitude (ΔHA). B: pathfinder analysis of the 25 metabolites most highly associated with differences between ΔSL and ΔHA.
Within the glycolysis pathway, increases in lactate and pyruvate were higher in ΔHA compared with ΔSL (Fig. 3, A and B). Increases in the TCA cycle metabolites malate, fumarate, citrate, aconitate (cis or trans), and α-ketoglutarate were also higher (P < 0.05, Q < 0.10) for ΔHA compared with ΔSL (Fig. 3, C–G). Conversely, increases in succinate were lower (P < 0.05, Q < 0.10) for ΔHA compared with ΔSL, and larger decreases (P < 0.05, Q < 0.10) in succinylcarnitine were observed for ΔHA compared with ΔSL (Fig. 3, H and I).
Figure 3.

Box plots of difference from resting, fasted conditions at sea level (SL) in glycolysis (A and B), and tricarboxylic acid (TCA) metabolites (C–I) during exercise at SL and high altitude (HA). *Significantly different from SL, P < 0.05, Q < 0.10. Exact P and Q values are reported in Supplemental Table S1.
Decreases in branched-chain amino acids (BCAA), leucine, isoleucine, and valine, were greater (P < 0.05, Q < 0.10) for ΔHA compared with ΔSL (Fig. 4, A–C). Downstream BCAA metabolites, 3-hydroxyisobutyrate, 3-methyl-2-oxobutyrate, and 4-methyl-2-oxopentanoate, were higher (P < 0.05, Q < 0.10) for ΔHA compared with ΔSL (Fig. 4, D–F). ΔValine was positively associated with Δexogenous glucose oxidation (P < 0.05, r = 0.786) and Δglucose Rd (P < 0.05, r = 0.786; Fig. 4, G and H). Δ3-Hydroxyisobutyrate and Δ3-methyl-2-oxobutyrate were inversely associated with ΔMCR (P < 0.05, r = −0.762) and Δexogenous glucose oxidation (P < 0.05, r = −0.738), respectively (Fig. 4, I and J). Within other pathways of amino acid metabolism, larger reductions in multiple histidine and urea cycle-related metabolites were observed for ΔHA compared with ΔSL (Table 1).
Figure 4.

Box plots of difference from resting, fasted conditions at sea level (SL) in branched-chain amino acids (BCAA) metabolites (A–F) during exercise at SL and high altitude (HA). *Significantly different from SL, P < 0.05, Q < 0.10. Exact P and Q values are reported in Supplemental Table S1. Significant associations in delta (HA-SL) BCAA metabolites to delta exogenous glucose oxidation, metabolic clearance rate (MCR), and glucose Rd (G–J).
Table 1.
Histidine and urea cycle metabolites
| Subpathway | Metabolite | ΔSea Level | ΔHigh Altitude | P Value | Q Value |
|---|---|---|---|---|---|
| Histidine metabolism | 1-Methyl-5-imidazoleacetate | 0.30 (−0.20, 0.79) | −0.76 (−1.55, 0.03) | 0.001965 | 0.034 |
| 1-Methyl-5-imidazolelactate | 0.23 (−0.27, 0.73) | −1.00 (−1.96, −0.04) | 0.004776 | 0.048741 | |
| 1-Methylhistamine | 0.62 (0.09, 1.16) | −0.68 (−1.23, −0.13) | 0.000161 | 0.01762 | |
| 3-Methylhistidine | −0.52 (−0.95, −0.09) | −1.81 (−2.22, −1.40) | 2.40 E−05 | 0.010267 | |
| Histidine | −0.56 (−0.81, −0.31) | −1.56 (−2.36, −0.76) | 0.009504 | 0.07169 | |
| N-acetylhistidine | 0.13 (−0.35, 0.61) | −0.74 (−1.34, −0.15) | 0.004244 | 0.044842 | |
| Urea cycle metabolism | 2-Oxoarginine | 0.28 (−0.22, 0.77) | −0.97 (−1.41, −0.54) | 0.001858 | 0.03393 |
| Argininate | 0.07 (−0.43, 0.56) | −1.16 (−1.70, −0.63) | 0.000257 | 0.01762 | |
| Arginine | −0.72 (−1.16, −0.29) | −1.87 (−2.55, −1.19) | 0.001006 | 0.025854 | |
| Citrulline | −0.90 (−1.50, −0.29) | −2.06 (−2.47, −1.64) | 0.000376 | 0.01762 | |
| Dimethylarginine (ADMA + SDMA) | −0.18 (−0.98, 0.62) | −1.75 (−2.27, −1.23) | 0.001237 | 0.026432 | |
| Homoarginine | −0.41 (−1.10, 0.28) | −1.79 (−2.42, −1.16) | 0.000442 | 0.01762 | |
| N-acetylarginine | −0.36 (−1.23, 0.52) | −1.20 (−1.93, −0.48) | 0.006469 | 0.056118 | |
| Ornithine | −0.43 (−1.31, 0.44) | −1.47 (−2.22, −0.72) | 0.001856 | 0.03393 |
Values mean (95% confidence interval) log10, presented as the delta during postprandial/exercise under sea level and high-altitude conditions minus fasted, rested sea level conditions. Main effect of condition for all metabolites; P < 0.05 and Q < 0.10.
Changes in γ-glutamylalanine and 2-hydroxybutyrate/2-hydroxyisobutyrate, both markers of oxidative stress, were higher (P < 0.05, Q < 0.10) for ΔHA compared with ΔSL (Fig. 5, A and B). Δ2-Hydroxybutyrate/2-hydroxyisobutyrate was inversely associated with ΔMCR (P < 0.05, r = −0.738; Fig. 5C). Δγ-Glutamylalanine was inversely associated with Δexogenous glucose oxidation (P < 0.05, r = −0.810) and Δglucose Rd (P < 0.05, r = −0.881; Fig. 5, D and E).
Figure 5.

Box plots of difference from resting, fasted conditions at sea level (SL) in oxidative stress metabolites (A and B) during exercise at SL and high altitude (HA). *Significantly different from SL, P < 0.05, Q < 0.10. Exact P and Q values are reported in Supplemental Table S1. Significant associations in delta (HA-SL) oxidative stress metabolites to delta exogenous glucose oxidation, metabolic clearance rate (MCR), and glucose Rd (C–E).
Changes in several fatty acid-related metabolites were different (P < 0.05, Q < 0.10) between ΔHA compared with ΔSL (Table 2). Decreases in multiple carnitine and choline metabolites were greater (P < 0.05, Q < 0.10) for ΔHA compared with ΔSL. In contrast, increase in malonate, a metabolite in the fatty acid synthesis pathway, was higher (P < 0.05, Q < 0.10) for ΔHA compared with ΔSL.
Table 2.
Fatty acid metabolites
| Subpathway | Metabolite | ΔSea Level | ΔHigh Altitude | P Value | Q Value |
|---|---|---|---|---|---|
| Carnitine Metabolism | Carnitine | −0.19 (−0.74, 0.35) | −1.06 (−1.89, 0.23) | 0.007039 | 0.058157 |
| Deoxycarnitine | −0.16 (−1.01, 0.69) | −0.76 (−1.55, 0.03) | 0.006051 | 0.053835 | |
| Fatty acid metabolism (acyl carnitine, hydroxy) | (S)-3-Hydroxybutyrylcarnitine | 0.34 (−0.17, 0.84) | 1.45 (0.54, 2.37) | 0.016166 | 0.096671 |
| Fatty acid metabolism (acyl choline) | Arachidonoylcholine | −1.21 (−1.67, −0.74) | −1.97 (−2.43, −1.52) | 0.000187 | 0.01762 |
| Docosahexaenoylcholine | −1.07 (−1.56, −0.57) | −1.85 (−2.28, −1.41) | 0.000287 | 0.01762 | |
| Eicosapentaenoylcholine | −1.09 (−1.69, −0.50) | −1.65 (−2.37, −0.92) | 0.002779 | 0.036451 | |
| Fatty acid synthesis | Malonate | −0.91 (−1.81, −0.01) | 1.01 (0.35, 1.67) | 4.47 E−05 | 0.010267 |
| Fatty acid, dicarboxylate | 3-Carboxy-4-methyl-5-pentyl-2-furanpropionate (3-CMPFP) | −0.16 (−0.74, 0.43) | −1.46 (−2.22, −0.70) | 0.002219 | 0.035351 |
| Octadecanedioate (C18) | −0.28 (−1.00, 0.44) | 0.51 (−0.24, 1.27) | 0.010877 | 0.076246 | |
| Phospholipid metabolism | Choline | −0.22 (−0.96, 0.51) | −1.63 (−2.49, −0.77) | 0.002523 | 0.035729 |
Values mean (95% confidence interval) log10, presented as the delta during postprandial/exercise under sea level and high-altitude conditions minus fasted, rested sea level conditions. Main effect of condition for all metabolites; P < 0.05 and Q < 0.10.
DISCUSSION
The main finding of this study was that acute HA exposure altered circulating metabolomics profiles during metabolically matched, steady-state aerobic exercise compared with SL conditions. Significant differences were observed in metabolites within sub-pathways of glycolysis, TCA cycle, BCAA metabolism, oxidative stress, and fatty acid metabolism. Changes in several of these metabolites were associated with decreases in exogenous glucose oxidation, glucose Rd, and MCR at HA, suggesting that changes in activity within these metabolic pathways under acute HA conditions may mediate hypoxia-induced insulin resistance.
The primary outcome from the parent study (1) was that exogenous glucose oxidation was reduced during aerobic exercise under acute HA conditions compared with SL. Accompanying lower rates of exogenous glucose oxidation were increased circulating glucose and insulin concentrations and reductions in glucose Rd and MCR (1). These shifts in glucose kinetics are characteristic of insulin resistance (7) and suggest that reductions in peripheral glucose uptake may be a primary factor contributing to lower rates of exogenous glucose oxidation at HA. We thus hypothesized that the observed dysregulations in glucose metabolism were the result of hypoxia-induced insulin resistance. Using nontargeted metabolomics analysis in this secondary investigation demonstrated greater increases in metabolites indicative of oxidative stress, γ-glutamylalanine, and 2-hydroxybutyrate/2-hydroxyisobutyrate, during exercise at HA relative to SL, which were associated with larger declines in exogenous glucose oxidation, MCR, and glucose Rd. Increased oxidative stress is common during unacclimitized high-altitude exposure, potentially due to decreased oxygen pressure resulting in elevated free radical production and reductions in plasma antioxidant capacity (23, 24). Higher concentrations of these metabolites have also been observed in individuals with type 2 diabetes and insulin resistance (25, 26).
Increased oxidative stress in the current study may be associated with hypoxia-induced lipid accumulation under HA compared with SL conditions (27, 28). Lower concentrations of choline and acyl choline metabolites, carnitine, and higher concentrations of malonate under HA conditions indicate decreased fatty acid mobilization and fatty acid transport into the mitochondria, and increased fatty acid synthesis (29, 30). Low choline availability impairs fatty acid β-oxidation and results in mitochondrial dysfunction increasing oxidative stress (28, 31). Low carnitine and high acyl carnitine concentrations also increase oxidative stress and have been linked to insulin resistant populations (32, 33). Accumulation of acyl carnitines with hypoxia exposure has been reported in human (34) and rodent models (35), with the latter also reporting concurrent reductions in fat oxidation. Declines in the rate fat oxidation with HA exposure were reported in our parent study (1) and may have been the result of hypoxia-induced reductions in carnitine, which is essential for transporting long-chain fatty acids into the mitochondria for β-oxidation. Interestingly, supplementation of l-carnitine during hypoxia exposure functions as an antioxidant, reduced oxidative stress, and improved physical performance in rats (36, 37). Whether l-carnitine supplementation with acute HA exposure in humans can reduce oxidative stress to mitigate hypoxia-induced insulin resistance, and improve exercise performance is unclear.
Several BCAA metabolites that had a greater increase for ΔHA compared with ΔSL have also been previously associated with type 2 diabetes and insulin resistance (12). Higher concentrations of the BCAA metabolites 3-hydroxyisobutyrate, 3-methyl-2-oxobutyrate, and 4-methyl-2-oxopentanoate are associated with insulin resistance and type 2 diabetes in both human and mouse models (13, 38–40). In agreement with previous animal and human diseased state studies, our results demonstrate that greater increases in 3-hydroxyisobutyrate and 3-methyl-2-oxobutyrate were associated with lower MCR, an indicator of glucose uptake into peripheral tissue, and exogenous glucose oxidation, respectively.
Hypoxia-mediated changes in BCAA metabolites may, in part, be due to increased glycogenolysis and reductions in endogenous glucose stores during acute HA exposure. Our laboratory (1) and others (41–43) have shown endogenous glucose oxidation is higher and fat oxidation is lower during metabolically matched aerobic exercise under acute HA compared with SL. Increased glycogenolysis was reflected in the current study with higher increases in glycolysis metabolites pyruvate and lactate at HA. Higher pyruvate with HA exposure may explain the larger increase in TCA cycle metabolites during HA. However, concomitant increases in lactate production under the hypoxic conditions suggest increased anaerobic glycolysis. Higher pyruvate and lactate at HA may be due to increased hypoxia inducible factor 1α (HIF-1α) upregulating PDK1 via deactivation of PDH, preventing the conversion of pyruvate to acetyl-CoA (44). Increases in TCA cycle metabolites under HA conditions may instead reflect alternate carbon flow for oxidation (45). It is unlikely that increases in TCA metabolites are derived from fatty acids, as both fat oxidation and related fatty acid metabolites were reduced at HA. Greater decreases in leucine, isoleucine, and valine, with increases of downstream BCAA metabolites at HA may indicate increased reliance on BCAA carbon skeletons for energy production via the TCA cycle (46). Similar alterations in glycolysis, TCA, and BCAA metabolite profiles have been reported during ascent to Everest base camp (47) and following 4 days of exposure to hypobaric hypoxia at 5,300 m (34). Low energy or glycogen availability may increase the reliance of BCAA for substrate to be used for energy production and maintenance of glucose homeostasis (48, 49). Leucine and isoleucine can be broken down and converted to acetyl-CoA to enter the TCA cycle for energy production (46, 50). Acetyl-CoA then enters the TCA through its conversion to citrate, which aligns with higher concentrations of citrate at HA compared with SL in the current study.
Despite increases in the majority of TCA metabolites, succinate decreased to a greater extent during aerobic exercise at HA compared with SL. Lower succinate may be reflective of changes in BCAA metabolites. Unlike leucine and isoleucine, valine enters the TCA cycle through conversion to succinyl-CoA, which in turn is converted to succinate (46). Increase in 3-hydroxyisobutyrate, a valine metabolite, during exercise at HA may suggest impaired conversion of this metabolite to enter the TCA cycle to be used for energy. The subsequent higher increase in fumurate within the TCA cycle at HA may have resulted from the conversion of urea cycle metabolites for energy use (51). This increased reliance on urea and other amino acid metabolites for oxidative purposes may be a marker of negative net protein balance during acute hypoxia exposure. Our laboratory (52) has previously reported that reductions in plasma urea and histidine metabolites occur concurrently with negative net protein balance following 4 days of ∼55% activity-induced energy deficit. Reductions in concentrations of these metabolites have also been reported with decreased dietary protein intake (53), which results in negative protein balance. Taken together, these findings suggest that increased reliance on amino acids for oxidative purposes may, in part, help explain declines in mechanistic target of rapamycin complex 1 anabolic signaling (54), negative net protein balance (55, 56), and reductions in muscle mass (55–57) that occur in unacclimatized lowlanders sojourning at HA.
Our current study provides novel insight into the changes of metabolomics profiles while consuming carbohydrate during aerobic exercise under acute HA exposure. However, several limitations should be acknowledged. A sample size of eight for the parent study was generated based on anticipated differences of −14 ± 8 g/40 min exercise in exogenous glucose oxidation at HA compared with SL (1). This sample size was appropriate to address the primary outcome of differences in substrate oxidation and glucose turnover between SL and HA conditions; however, it is relatively small for metabolomics analysis. Though relatively small, other studies of similar sample size, n = 14 (7 men, 7 women) and n = 10 (6 men and 4 women) have effectively used metabolomics analysis to characterized metabolic alterations after 16 (10), 3, and 14 days (11) of hypoxia exposure. In addition, in the current study, the alterations in metabolomic profiles largely align with the results from the substrate oxidation in the parent study (1). Agreement between indirect calorimetry/isotope and metabolomic datasets, along with larger differences in effects between study conditions, enhances the physiological relevance and likely validity of the results. Furthermore, to account for the small sample size we assessed our data as deltas during exercise under acute high altitude and sea level conditions from our control resting/fasted sample collected under sea level conditions. This approach not only allowed us to isolate the effects of the exercise response between the two conditions, but also limited the number of data points being compared which enhance our statistical power. Similarly, the use of a crossover study designed enhanced the statistical power of our work by allowing each participant to act as their own control. It should also be noted that the results of our study should be taken in the context of our current study design. Our study exposed male participants to conditions equal to an altitude 4,300 m for ∼8 h. Only males were included in this investigation so outcome measures from the parent study could be appropriately compared with our previous work, which only had male participants. Sex-based differences in substrate oxidation during exercise at SL may result in differences in response to change in substrate oxidation at HA between men and women. Variant results may be observed using female participants, different severities of altitude, and more prolonged exposures.
It is important to state that while changes in metabolomics profiles during HA are reflective of changes in substrate oxidation and mirror profiles of insulin resistant populations, causality cannot be determined. The information obtained from this analysis can be used to identify potential interventions for future investigation to overcome changes in metabolite profiles to improve glucose tolerance to support physical performance at HA. Based on the present study findings, short-term use of insulin sensitizing drugs, such as metformin or pioglitazone, may be appropriate with unacclimatized HA exposure to efficiently metabolize dietary carbohydrate. Alternatively, potential nutrition interventions such as antioxidant supplement l-carnitine or choline supplementation to reduce oxidative stress and enhance fat oxidation may improve metabolic dysregulation by increasing reliance on fatty acids for fuel during exercise, minimizing oxidative stress associated with insulin resistance.
In conclusion, results from this study show differences in circulating metabolite profiles during exercise under acute HA compared with SL conditions, indicating increased glycolysis and TCA cycle activity, amino acid breakdown, oxidative stress, and fatty acid storage, and decreased fatty acid mobilization. Increased concentrations and inverse associations of metabolites within BCAA and oxidative stress pathways with exogenous glucose oxidation, glucose Rd, and MCR suggest that changes in metabolite profiles under acute HA conditions may be reflective of hypoxia-induced insulin resistance. These data provide new insight into the potential underlying alterations in metabolic pathways that govern metabolic dysregulation in substrate oxidation under acute HA exposure.
SUPPLEMENTAL DATA
Supplemental Table S1: doi.org/10.6084/m9.figshare.14597352.
GRANTS
This material is based on the work supported by DHP JPC-5/MOMRP and through fellowship appointments to the US Army Research Institute of Environmental Medicine administered by the Oak Ridge Institute for Science and Education (to J. L. Coleman) through an interagency agreement between the US Department of Energy and the US Army Medical Research and Development Command.
DISCLAIMERS
The opinions or assertions contained herein are the private views of the authors and are not to be construed as official or as reflecting the views of the Army or the Department of Defense. Any citations of commercial organizations and trade names in this report do not constitute an official Department of the Army endorsement of approval of the products or services of these organizations.
DISCLOSURES
No conflicts of interest, financial or otherwise, are declared by the authors.
AUTHOR CONTRIBUTIONS
L.M.M., A.A.F., A.J.Y., and S.M.P. conceived and designed research; L.M.M., M.A.W., A.J.Y., and S.M.P. performed experiments; L.M.M., J.P.K., and J.L.C. analyzed data; L.M.M., J.P.K., A.J.Y., and S.M.P. interpreted results of experiments; L.M.M. and J.L.C. prepared figures; L.M.M. drafted manuscript; L.M.M., J.P.K., M.A.W., J.L.C., A.A.F., A.J.Y., and S.M.P. edited and revised manuscript; L.M.M., J.P.K., M.A.W., J.L.C., A.A.F., A.J.Y., and S.M.P. approved final version of manuscript.
ACKNOWLEDGMENTS
The authors thank the volunteers for participating in this research experiment. The authors acknowledge our medical oversight team for support of this study. The authors sincerely thank Dr. David Chuch, Dr. Robert Wolfe, Dr. Jess Gwin, Claire Whitney, Christopher Carrigan, Nancy Murphy, Patrick Radcliffe, Adrienne Hatch-McChesney, and Heather Fagnant from the US Army Research Institute of Environmental Medicine, and Danielle Anderson from the Combat Feeding Directorate for contributions to the project.
REFERENCES
- 1.Margolis LM, Wilson MA, Whitney CC, Carrigan CT, Murphy NE, Radcliffe PN, Gwin JA, Church DD, Wolfe RR, Ferrando AA, Young AJ, Pasiakos SM. Acute hypoxia reduces exogenous glucose oxidation, glucose turnover, and metabolic clearance rate during steady-state aerobic exercise. Metabolism 103: 154030, 2020. doi: 10.1016/j.metabol.2019.154030. [DOI] [PubMed] [Google Scholar]
- 2.O'Hara JP, Duckworth L, Black A, Woods DR, Mellor A, Boos C, Gallagher L, Tsakirides C, Arjomandkhah NC, Morrison DJ, Preston T, King RF. Fuel use during exercise at altitude in women with glucose-fructose ingestion. Med Sci Sports Exerc 51: 2586–2594, 2019. doi: 10.1249/mss.0000000000002072. [DOI] [PubMed] [Google Scholar]
- 3.O'Hara JP, Woods DR, Mellor A, Boos C, Gallagher L, Tsakirides C, Arjomandkhah NC, Holdsworth DA, Cooke CB, Morrison DJ, Preston T, King RF. A comparison of substrate oxidation during prolonged exercise in men at terrestrial altitude and normobaric normoxia following the coingestion of 13C glucose and 13C fructose. Physiol Rep 5: e13101, 2017. doi: 10.14814/phy2.13101. [DOI] [PMC free article] [PubMed] [Google Scholar]
- 4.Young AJ, Margolis LM, Pasiakos SM. Commentary on the effects of hypoxia on energy substrate use during exercise. J Int Soc Sports Nutr 16: 28, 2019. doi: 10.1186/s12970-019-0295-6. [DOI] [PMC free article] [PubMed] [Google Scholar]
- 5.Norwich KH, Radziuk J, Lau D, Vranic M. Experimental validation of nonsteady rate measurements using a tracer infusion method and inulin as tracer and tracee. Can J Physiol Pharmacol 52: 508–521, 1974. doi: 10.1139/y74-068. [DOI] [PubMed] [Google Scholar]
- 6.Zderic TW, Schenk S, Davidson CJ, Byerley LO, Coyle EF. Manipulation of dietary carbohydrate and muscle glycogen affects glucose uptake during exercise when fat oxidation is impaired by beta-adrenergic blockade. Am J Physiol Endocrinol Metab 287: E1195–E1201, 2004. doi: 10.1152/ajpendo.00302.2004. [DOI] [PubMed] [Google Scholar]
- 7.Wajngot A, Roovete A, Vranic M, Luft R, Efendic S. Insulin resistance and decreased insulin response to glucose in lean type 2 diabetics. Proc Natl Acad Sci USA 79: 4432–4436, 1982. doi: 10.1073/pnas.79.14.4432. [DOI] [PMC free article] [PubMed] [Google Scholar]
- 8.Nicholson JK, Lindon JC, Holmes E. 'Metabonomics': understanding the metabolic responses of living systems to pathophysiological stimuli via multivariate statistical analysis of biological NMR spectroscopic data. Xenobiotica 29: 1181–1189, 1999. doi: 10.1080/004982599238047. [DOI] [PubMed] [Google Scholar]
- 9.Sampson DL, Broadbent JA, Parker AW, Upton Z, Parker TJ. Urinary biomarkers of physical activity: candidates and clinical utility. Expert Rev Proteomics 11: 91–106, 2014. doi: 10.1586/14789450.2014.859527. [DOI] [PubMed] [Google Scholar]
- 10.Chicco AJ, Le CH, Gnaiger E, Dreyer HC, Muyskens JB, D'Alessandro A, Nemkov T, Hocker AD, Prenni JE, Wolfe LM, Sindt NM, Lovering AT, Subudhi AW, Roach RC. Adaptive remodeling of skeletal muscle energy metabolism in high-altitude hypoxia: lessons from AltitudeOmics. J Biol Chem 293: 6659–6671, 2018. doi: 10.1074/jbc.ra117.000470. [DOI] [PMC free article] [PubMed] [Google Scholar]
- 11.Lawler NG, Abbiss CR, Gummer JPA, Broadhurst DI, Govus AD, Fairchild TJ, Thompson KG, Garvican-Lewis LA, Gore CJ, Maker GL, Trengove RD, Peiffer JJ. Characterizing the plasma metabolome during 14 days of live-high, train-low simulated altitude: a metabolomic approach. Exp Physiol 104: 81–92, 2019. doi: 10.1113/ep087159. [DOI] [PubMed] [Google Scholar]
- 12.Gonzalez-Franquesa A, Burkart AM, Isganaitis E, Patti ME. What have metabolomics approaches taught us about type 2 diabetes? Curr Diab Rep 16: 74, 2016. doi: 10.1007/s11892-016-0763-1. [DOI] [PMC free article] [PubMed] [Google Scholar]
- 13.Hernandez-Alvarez MI, Diaz-Ramos A, Berdasco M, Cobb J, Planet E, Cooper D, Pazderska A, Wanic K, O'Hanlon D, Gomez A, de la Ballina LR, Esteller M, Palacin M, O'Gorman DJ, Nolan JJ, Zorzano A. Early onset and classical forms of type 2 diabetes show impaired expression of genes involved in muscle branched-chain amino acids metabolism. Sci Rep 7: 13850, 2017. doi: 10.1038/s41598-017-14120-6. [DOI] [PMC free article] [PubMed] [Google Scholar]
- 14.Palmer ND, Okut H, Hsu FC, Ng MCY, Chen YI, Goodarzi MO, Taylor KD, Norris JM, Lorenzo C, Rotter JI, Bergman RN, Langefeld CD, Wagenknecht LE, Bowden DW. Metabolomics identifies distinctive metabolite signatures for measures of glucose homeostasis: the Insulin Resistance Atherosclerosis Family Study (IRAS-FS). J Clin Endocrinol Metab 103: 1877–1888, 2018. doi: 10.1210/jc.2017-02203. [DOI] [PMC free article] [PubMed] [Google Scholar]
- 15.McInerney P, Lessard SJ, Burke LM, Coffey VG, Lo Giudice SL, Southgate RJ, Hawley JA. Failure to repeatedly supercompensate muscle glycogen stores in highly trained men. Med Sci Sports Exerc 37: 404–411, 2005. doi: 10.1249/01.mss.0000155699.51360.2f. [DOI] [PubMed] [Google Scholar]
- 16.Young AJ, Berryman CE, Kenefick RW, Derosier AN, Margolis LM, Wilson MA, Carrigan CT, Murphy NE, Carbone JW, Rood JC, Pasiakos SM. Altitude acclimatization alleviates the hypoxia-induced suppression of exogenous glucose oxidation during steady-state aerobic exercise. Front Physiol 9: 830, 2018. doi: 10.3389/fphys.2018.00830. [DOI] [PMC free article] [PubMed] [Google Scholar]
- 17.Peronnet F, Massicotte D, Brisson G, Hillaire-Marcel C. Use of 13C substrates for metabolic studies in exercise: methodological considerations. J Appl Physiol (1985) 69: 1047–1052, 1990. doi: 10.1152/jappl.1990.69.3.1047. [DOI] [PubMed] [Google Scholar]
- 18.Wolfe RR, Chinkes DL. Isotope Tracers in Metabolic Research: Principles and Practice of Kinetic Analysis. Hoboken (New Jersey): Wiley, 2005. [Google Scholar]
- 19.Dehaven CD, Evans AM, Dai H, Lawton KA. Organization of GC/MS and LC/MS metabolomics data into chemical libraries. J Cheminform 2: 9, 2010. doi: 10.1186/1758-2946-2-9. [DOI] [PMC free article] [PubMed] [Google Scholar]
- 20.Evans AM, DeHaven CD, Barrett T, Mitchell M, Milgram E. Integrated, nontargeted ultrahigh performance liquid chromatography/electrospray ionization tandem mass spectrometry platform for the identification and relative quantification of the small-molecule complement of biological systems. Anal Chem 81: 6656–6667, 2009. doi: 10.1021/ac901536h. [DOI] [PubMed] [Google Scholar]
- 21.Sumner LW, Amberg A, Barrett D, Beale MH, Beger R, Daykin CA, Fan TW, Fiehn O, Goodacre R, Griffin JL, Hankemeier T, Hardy N, Harnly J, Higashi R, Kopka J, Lane AN, Lindon JC, Marriott P, Nicholls AW, Reily MD, Thaden JJ, Viant MR. Proposed minimum reporting standards for chemical analysis Chemical Analysis Working Group (CAWG) Metabolomics Standards Initiative (MSI). Metabolomics 3: 211–221, 2007. doi: 10.1007/s11306-007-0082-2. [DOI] [PMC free article] [PubMed] [Google Scholar]
- 22.Xia J, Wishart DS. Using MetaboAnalyst 3.0 for comprehensive metabolomics data analysis. Curr Protoc Bioinformatics 55: 14.10.11–14.10.91, 2016. doi: 10.1002/cpbi.11. [DOI] [PubMed] [Google Scholar]
- 23.Debevec T, Millet GP, Pialoux V. Hypoxia-induced oxidative stress modulation with physical activity. Front Physiol 8: 84, 2017. doi: 10.3389/fphys.2017.00084. [DOI] [PMC free article] [PubMed] [Google Scholar]
- 24.Lewis NA, Howatson G, Morton K, Hill J, Pedlar CR. Alterations in redox homeostasis in the elite endurance athlete. Sports Med 45: 379–409, 2015. doi: 10.1007/s40279-014-0276-5. [DOI] [PubMed] [Google Scholar]
- 25.Gall WE, Beebe K, Lawton KA, Adam KP, Mitchell MW, Nakhle PJ, Ryals JA, Milburn MV, Nannipieri M, Camastra S, Natali A, Ferrannini E, Group RS; the RISC Study Group. α-hydroxybutyrate is an early biomarker of insulin resistance and glucose intolerance in a nondiabetic population. PLoS One 5: e10883, 2010. doi: 10.1371/journal.pone.0010883. [DOI] [PMC free article] [PubMed] [Google Scholar]
- 26.Marchesini G, Avagnina S, Barantani E, Ciccarone A, Corica F, Dall’Aglio E, Dalle Grave R, Morpurgo P, Tomasi F, Vitacolonna E. Aminotransferase and gamma-glutamyl transpeptidase levels in obesity are associated with insulin resistance and the metabolic syndrome. J Endocrinol Invest 28: 333–339, 2005. doi: 10.1007/BF03347199. [DOI] [PubMed] [Google Scholar]
- 27.Qin S, Yin J, Huang K. Free fatty acids increase intracellular lipid accumulation and oxidative stress by modulating PPARα and SREBP-1c in L-02 cells. Lipids 51: 797–805, 2016. doi: 10.1007/s11745-016-4160-y. [DOI] [PubMed] [Google Scholar]
- 28.Zhu J, Wu Y, Tang Q, Leng Y, Cai W. The effects of choline on hepatic lipid metabolism, mitochondrial function and antioxidative status in human hepatic C3A cells exposed to excessive energy substrates. Nutrients 6: 2552–2571, 2014. doi: 10.3390/nu6072552. [DOI] [PMC free article] [PubMed] [Google Scholar]
- 29.Bowman CE, Wolfgang MJ. Role of the malonyl-CoA synthetase ACSF3 in mitochondrial metabolism. Adv Biol Regul 71: 34–40, 2019. doi: 10.1016/j.jbior.2018.09.002. [DOI] [PMC free article] [PubMed] [Google Scholar]
- 30.Macfarlane DP, Zou X, Andrew R, Morton NM, Livingstone DE, Aucott RL, Nyirenda MJ, Iredale JP, Walker BR. Metabolic pathways promoting intrahepatic fatty acid accumulation in methionine and choline deficiency: implications for the pathogenesis of steatohepatitis. Am J Physiol Endocrinol Metab 300: E402–E409, 2011. doi: 10.1152/ajpendo.00331.2010. [DOI] [PMC free article] [PubMed] [Google Scholar]
- 31.Corbin KD, Zeisel SH. Choline metabolism provides novel insights into non-alcoholic fatty liver disease and its progression. Curr Opin Gastroenterol 28: 159–165, 2012. doi: 10.1097/mog.0b013e32834e7b4b. [DOI] [PMC free article] [PubMed] [Google Scholar]
- 32.Bene J, Hadzsiev K, Melegh B. Role of carnitine and its derivatives in the development and management of type 2 diabetes. Nutr Diabetes 8: 8–10, 2018. doi: 10.1038/s41387-018-0017-1. [DOI] [PMC free article] [PubMed] [Google Scholar]
- 33.Koves TR, Ussher JR, Noland RC, Slentz D, Mosedale M, Ilkayeva O, Bain J, Stevens R, Dyck JR, Newgard CB, Lopaschuk GD, Muoio DM. Mitochondrial overload and incomplete fatty acid oxidation contribute to skeletal muscle insulin resistance. Cell Metab 7: 45–56, 2008. doi: 10.1016/j.cmet.2007.10.013. [DOI] [PubMed] [Google Scholar]
- 34.Liao W-T, Liu B, Chen J, Cui J-H, Gao Y-X, Liu F-Y, Xu G, Sun B-D, Zhang E-L, Yuan Z-B, Zhang G, Gao Y-Q. Metabolite modulation in human plasma in the early phase of acclimatization to hypobaric hypoxia. Sci Rep 6: 1–14, 2016. doi: 10.1038/srep22589. [DOI] [PMC free article] [PubMed] [Google Scholar]
- 35.Bruder ED, Raff H. Cardiac and plasma lipid profiles in response to acute hypoxia in neonatal and young adult rats. Lipids Health Dis 9: 3–6, 2010. doi: 10.1186/1476-511X-9-3. [DOI] [PMC free article] [PubMed] [Google Scholar]
- 36.Bodea F, Bocea A, Decea N. [l-Carnitine decreases oxidative stress induced by experimental hypobaric hypoxia]. Pediatr Endocrinol Diabetes Metab 16: 78–81, 2010. [PubMed] [Google Scholar]
- 37.Panjwani U, Thakur L, Anand JP, Singh SN, Amitabh Singh SB, Banerjee PK. Effect of l-carnitine supplementation on endurance exercise in normobaric/normoxic and hypobaric/hypoxic conditions. Wilderness Environ Med 18: 169–176, 2007. doi: 10.1580/PR45-05.1. [DOI] [PubMed] [Google Scholar]
- 38.Menni C, Fauman E, Erte I, Perry JR, Kastenmuller G, Shin SY, Petersen AK, Hyde C, Psatha M, Ward KJ, Yuan W, Milburn M, Palmer CN, Frayling TM, Trimmer J, Bell JT, Gieger C, Mohney RP, Brosnan MJ, Suhre K, Soranzo N, Spector TD. Biomarkers for type 2 diabetes and impaired fasting glucose using a nontargeted metabolomics approach. Diabetes 62: 4270–4276, 2013. doi: 10.2337/db13-0570. [DOI] [PMC free article] [PubMed] [Google Scholar]
- 39.Nilsen MS, Jersin RA, Ulvik A, Madsen A, McCann A, Svensson PA, Svensson MK, Nedrebo BG, Gudbrandsen OA, Tell GS, Kahn CR, Ueland PM, Mellgren G, Dankel SN. 3-Hydroxyisobutyrate, a strong marker of insulin resistance in type 2 diabetes and obesity that modulates white and brown adipocyte metabolism. Diabetes 69: 1903–1916, 2020. doi: 10.2337/db19-1174. [DOI] [PMC free article] [PubMed] [Google Scholar]
- 40.Palmer ND, Okut H, Hsu F-C, Ng MCY, Chen Y-DI, Goodarzi MO, Taylor KD, Norris JM, Lorenzo C, Rotter JI, Bergman RN, Langefeld CD, Wagenknecht LE, Bowden DW. Metabolomics identifies distinctive metabolite signatures for measures of glucose homeostasis: the Insulin Resistance Atherosclerosis Family Study (IRAS-FS). J Clin Endocrinol Metab 103: 1877–1888, 2018. doi: 10.1210/jc.2017-02203. [DOI] [PMC free article] [PubMed] [Google Scholar]
- 41.Griffiths A, Shannon O, Matu J, King R, Deighton K, O’Hara JP. Response: commentary on the effects of hypoxia on energy substrate use during exercise. J Int Soc Sports Nutr 16: 1–6, 2019. doi: 10.1186/s12970-019-0330-7. [DOI] [PMC free article] [PubMed] [Google Scholar]
- 42.Lundby C, Sander M, van Hall G, Saltin B, Calbet JA. Maximal exercise and muscle oxygen extraction in acclimatizing lowlanders and high altitude natives. J Physiol 573: 535–547, 2006. doi: 10.1113/jphysiol.2006.106765. [DOI] [PMC free article] [PubMed] [Google Scholar]
- 43.Peronnet F, Massicotte D, Folch N, Melin B, Koulmann N, Jimenez C, Bourdon L, Launay JC, Savourey G. Substrate utilization during prolonged exercise with ingestion of (13)C-glucose in acute hypobaric hypoxia (4,300 m). Eur J Appl Physiol 97: 527–534, 2006. doi: 10.1007/s00421-006-0164-2. [DOI] [PubMed] [Google Scholar]
- 44.Murray AJ. Metabolic adaptation of skeletal muscle to high altitude hypoxia: how new technologies could resolve the controversies. Genome Med 1: 117, 2009. doi: 10.1186/gm117. [DOI] [PMC free article] [PubMed] [Google Scholar]
- 45.Wagenmakers AJ, Beckers EJ, Brouns F, Kuipers H, Soeters PB, van der Vusse GJ, Saris WH. Carbohydrate supplementation, glycogen depletion, and amino acid metabolism during exercise. Am J Physiol Endocrinol Metab 260: E883–E890, 1991. doi: 10.1152/ajpendo.1991.260.6.E883. [DOI] [PubMed] [Google Scholar]
- 46.Neinast M, Murashige D, Arany Z. Branched chain amino acids. Annu Rev Physiol 81: 139–164, 2019. doi: 10.1146/annurev-physiol-020518-114455. [DOI] [PMC free article] [PubMed] [Google Scholar]
- 47.O’Brien KA, Atkinson RA, Richardson L, Koulman A, Murray AJ, Harridge SDR, Martin DS, Levett DZH, Mitchell K, Mythen MG, Montgomery HE, Grocott MPW, Griffin JL, Edwards LM. Metabolomic and lipidomic plasma profile changes in human participants ascending to Everest Base Camp. Sci Rep 9: 1–12, 2019. doi: 10.1038/s41598-019-38832-z. [DOI] [PMC free article] [PubMed] [Google Scholar]
- 48.Dhahbi JM, Mote PL, Wingo J, Rowley BC, Cao SX, Walford RL, Spindler SR. Caloric restriction alters the feeding response of key metabolic enzyme genes. Mech Ageing Dev 122: 1033–1048, 2001. doi: 10.1016/S0047-6374(01)00230-5. [DOI] [PubMed] [Google Scholar]
- 49.Hagopian K, Ramsey JJ, Weindruch R. Caloric restriction increases gluconeogenic and transaminase enzyme activities in mouse liver. Exp Gerontol 38: 267–278, 2003. doi: 10.1016/S0531-5565(02)00202-4. [DOI] [PubMed] [Google Scholar]
- 50.Kainulainen H, Hulmi JJ, Kujala UM. Potential role of branched-chain amino acid catabolism in regulating fat oxidation. Exerc Sport Sci Rev 41: 194–200, 2013. doi: 10.1097/JES.0b013e3182a4e6b6. [DOI] [PubMed] [Google Scholar]
- 51.O'Flaherty L, Adam J, Heather LC, Zhdanov AV, Chung YL, Miranda MX, Croft J, Olpin S, Clarke K, Pugh CW, Griffiths J, Papkovsky D, Ashrafian H, Ratcliffe PJ, Pollard PJ. Dysregulation of hypoxia pathways in fumarate hydratase-deficient cells is independent of defective mitochondrial metabolism. Hum Mol Genet 19: 3844–3851, 2010. doi: 10.1093/hmg/ddq305. [DOI] [PMC free article] [PubMed] [Google Scholar]
- 52.Karl JP, Margolis LM, Murphy NE, Carrigan CT, Castellani JW, Madslien EH, Teien HK, Martini S, Montain SJ, Pasiakos SM. Military training elicits marked increases in plasma metabolomic signatures of energy metabolism, lipolysis, fatty acid oxidation, and ketogenesis. Physiol Rep 5: e13407, 2017. doi: 10.14814/phy2.13407. [DOI] [PMC free article] [PubMed] [Google Scholar]
- 53.Kochlik B, Gerbracht C, Grune T, Weber D. The influence of dietary habits and meat consumption on plasma 3‐methylhistidine—a potential marker for muscle protein turnover. Mol Nutr Food Res 62: 1701062, 2018. doi: 10.1002/mnfr.201701062. [DOI] [PMC free article] [PubMed] [Google Scholar]
- 54.Margolis LM, Carbone JW, Berryman CE, Carrigan CT, Murphy NE, Ferrando AA, Young AJ, Pasiakos SM. Severe energy deficit at high altitude inhibits skeletal muscle mTORC1-mediated anabolic signaling without increased ubiquitin proteasome activity. FASEB J 32: 5955–5966, 2018. doi: 10.1096/fj.201800163RR. [DOI] [PubMed] [Google Scholar]
- 55.Berryman CE, Young AJ, Karl JP, Kenefick RW, Margolis LM, Cole RE, Carbone JW, Lieberman HR, Kim IY, Ferrando AA, Pasiakos SM. Severe negative energy balance during 21 d at high altitude decreases fat-free mass regardless of dietary protein intake: a randomized controlled trial. FASEB J 32: 894–905, 2018. doi: 10.1096/fj.201700915r. [DOI] [PubMed] [Google Scholar]
- 56.Friedlander AL, Braun B, Pollack M, MacDonald JR, Fulco CS, Muza SR, Rock PB, Henderson GC, Horning MA, Brooks GA, Hoffman AR, Cymerman A. Three weeks of caloric restriction alters protein metabolism in normal-weight, young men. Am J Physiol Endocrinol Metab 289: E446–E455, 2005. doi: 10.1152/ajpendo.00001.2005. [DOI] [PubMed] [Google Scholar]
- 57.Pasiakos SM, Berryman CE, Carrigan CT, Young AJ, Carbone JW. Muscle protein turnover and the molecular regulation of muscle mass during hypoxia. Med Sci Sports Exerc 49: 1340–1350, 2017. doi: 10.1249/MSS.0000000000001228. [DOI] [PubMed] [Google Scholar]