Keywords: glucose fluxes, model, physical activity, tracer, type 1 diabetes
Abstract
Exercise effects (EE) on whole body glucose rate of disappearance (Rd) occur through insulin-independent (IIRd) and insulin-dependent (IDRd) mechanisms. Quantifying these processes in vivo would allow a better understanding of the physiology of glucose regulation. This is of particular importance in individuals with type 1 diabetes (T1D) since such a knowledge may help to improve glucose management. However, such a model is still lacking. Here, we analyzed data from six T1D and six nondiabetic (ND) subjects undergoing a labeled glucose clamp study during, before, and after a 60-min exercise session at 65% V̇o2max on three randomized visits: euglycemia-low insulin, euglycemia-high insulin, and hyperglycemia-low insulin. We tested a set of models, all sharing a single-compartment description of glucose kinetics, but differing in how exercise is assumed to modulate glucose disposal. Model selection was based on parsimony criteria. The best model assumed an exercise-induced immediate effect on IIRd and a delayed effect on IDRd. It predicted that exercise increases IIRd, compared with rest, by 66%–82% and 67%–97% in T1D and ND, respectively, not significantly different between the two groups. Conversely, the exercise effect on IDRd ranged between 81% and 155% in T1D and it was significantly higher than ND, which ranged between 10% and 40%. The exaggerated effect observed in IDRd can explain the higher hypoglycemia risk related to individuals with T1D. This novel exercise model could help in informing safe and effective glucose management during and after exercise in individuals with T1D.
NEW & NOTEWORTHY Here, we present a new mathematical model describing the effect of moderate physical activity on insulin-mediated and noninsulin-mediated glucose disposal in subjects with and without diabetes. We believe that this represents a step-forward in the knowledge of type 1 diabetes pathophysiology, and an useful tool to design safe and effective insulin-therapies.
INTRODUCTION
Although physical activity is known to offer benefits in individuals with and without diabetes, it is a challenge for the hormonal system aiming to maintain glucose homeostasis. As highlighted by Riddell et al. (1), this is even more challenging in subjects with diabetes, especially type 1 (T1D), for which it represents one of the major obstacles to achieve optimal glucose control.
Exercise physiology has been widely studied in the literature, in particular at organ/cellular level (2–10). Most of the studies agreed that physical activity trigger both the insulin-independent and insulin-dependent pathways of glucose disposal and demonstrated that the insulin-dependent one remains active beyond exercise duration. This results in a long-lasting enhancement of muscle sensitivity (11). Recently, this finding was confirmed in vivo in an elegant study by Nguyen et al. (12), where the insulin-mediated and the noninsulin-mediated glucose uptake were assessed in a population with T1D using an euglycemic clamp with three insulin levels.
To the best of our knowledge, a few attempts have been made to translate the available physiological knowledge into a mathematical model able to describe the effect of exercise on glucose disposal and insulin sensitivity (13, 14). However, as acknowledged by Breton (13), some important dynamics were not fully captured by the model, due to the lack of appropriate data available at that time.
A mechanistic model able to accurately quantify and segregate the effect of exercise on insulin-dependent and -independent glucose utilization would be useful for several reasons. For instance, it would allow to assess the role of hyperglycemia and/or hyperinsulinemia in determining the extent of exercise-stimulated glucose uptake (1, 15), as well as to quantitatively compare such effect in nondiabetic (ND) and subject with T1D. This would permit a better understanding of the physiology and pathophysiology of glucose regulation system in vivo. Moreover, such a model could be used to improve glycemic control in individuals with T1D, e.g., by proper training and informing algorithms to forecast hypoglycemic episodes or automated insulin infusion systems.
In the past years, a number of studies have been published reporting data on glucose turnover after or during a session of exercise, especially in the postprandial state (16–20). However, none of these experiments was able to segregate the effects of exercise in its insulin-independent and -dependent components (21, 22). Only recently, two sophisticated experimental protocols (12, 15) allowed this separation.
In particular, Romeres et al. (15) considered three visits in which glucose and insulin were kept constant at normal or high levels. The study design was suitable to develop a mechanistic model of the effect of moderate aerobic exercise on insulin-independent (IIRd) and -dependent rates of disappearance (IDRd), both in nondiabetic (ND) subjects and subjects with T1D. The infusion of an isotopic glucose tracer during the clamp also provided a model-independent estimate of glucose rate of disappearance, usable for model validation.
The aim of this study was to exploit the data generated by Romeres et al. (15) to, first, develop and validate a mechanistic model describing exercise effect on IIRd and IDRd, and, second, to use it to compare exercise effect on glucose uptake in ND and T1D subjects, accounting for the role of hyperglycemia and/or hyperinsulinemia.
MATERIALS AND METHODS
Subjects and Protocol
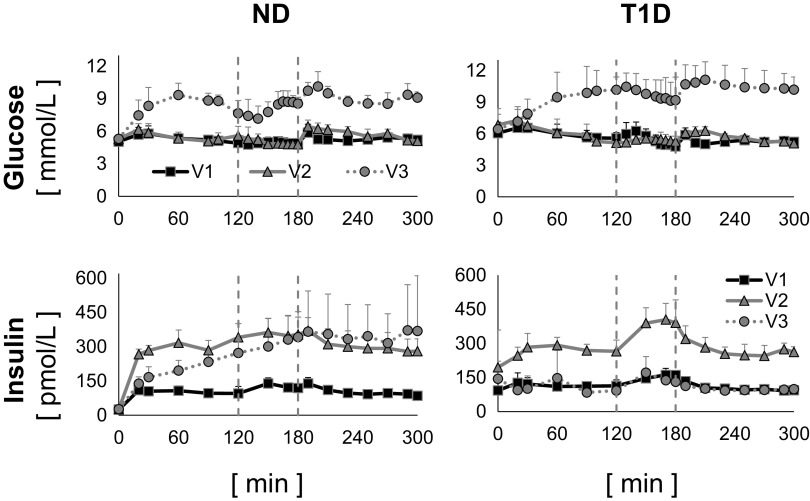
Six participants with type 1 diabetes (age: 28.7 ± 7.1 yr, fat-free mass: 56.2 ± 7.9, body mass index: 28.3 ± 4.8, V̇o2max: 28.7 ± 10.4 means ± SD) and six participants without diabetes (age: 28.2 ± 10.4 yr, fat-free mass: 55.0 ± 10.8, body mass index: 23.6 ± 2.3, V̇o2max: 36.6 ± 7.0 means ± SD) were studied in three occasions, in random order, with the glucose clamp technique, at different glucose levels and insulin infusion rates (Fig. 1). A detailed description of the experimental protocol has been published by Romeres et al. (15). Briefly, visit 1 (V1) was an euglycemic clamp (∼100 mg/dL) with low-insulin infusion (0.25 mU/kg/min), visit 2 (V2) was an euglycemic clamp (∼100 mg/dL) with high-insulin infusion (0.75 mU/kg/min), and visit 3 (V3) was a hyperglycemic clamp (∼180 mg/dL) with low-insulin infusion (0.25 mU/kg/min). It is worth noting that, since somatostatin was not infused, the hyperglycemic condition stimulated endogenous insulin secretion in healthy individuals so that, during V3, insulin concentration was comparable with that obtained during V2.
Figure 1.
Plasma glucose (top) and insulin (bottom) concentrations measured during visit 1 (V1, black continuous line with squares), visit 2 (V2, gray continuous line with triangles), and visit 3 (V3, gray dotted line with circles) in nondiabetic (ND, left) and type 1 diabetes (T1D, right), average ± SD of the six ND subjects.
During each visit, 1-h session of moderate-intensity aerobic exercise (65% V̇o2max) started 2 h after the beginning of the clamp. Dextrose (50%) labeled with [6,6-2H2] glucose was infused in amount sufficient to clamp glucose at the desired level. In addition, [6,6-2H2] glucose was infused (F2H) from time zero in a pattern that mimicked the anticipated changes in endogenous glucose production (EGP), to minimize the changes in the tracer to tracee ratio, as previously reported (23). Blood samples were frequently drawn for 5 h, before, during, and after the exercise session, to measure tracer enrichment and plasma concentrations of glucose, insulin, and other hormones.
From these data, a virtually model-independent estimate of the total rate of glucose appearance, Ratot (accounting for both the exogenous and endogenous components) was obtained by applying the Steele equation (24) to the clamped tracer to tracee ratio. Then, by subtracting the known exogenous glucose infusion rate (GIR) from Ratot, endogenous glucose production (EGP) was calculated. Finally, the calculation of glucose rate of disappearance (Rd) was obtained from the mass-balance equation, like in Basu et al. (23).
Modeling Exercise Effect on Rd
The development of a model describing the effect of exercise on the rate of glucose disappearance requires first a model of glucose kinetics and disposal insulin action in the absence of physical activity. Here, the so-called hot glucose minimal model (25) was used. In fact, during the clamp, glucose fluctuations were small (see Fig. 1), so that glucose kinetics was well approximated by a single-compartment description:
| (1) |
where Q(t) is the glucose mass, Gtot(t) the total plasma glucose concentration, with Gb its basal value, (t) the insulin action on glucose disposal, X0 its value at t = 0, I(t) the insulin concentration, Vg the glucose volume of distribution, p1 the fractional disposal glucose effectiveness at zero insulin, p2 the rate constant of insulin action on Rd, SI the disposal insulin sensitivity. EGP, I, and GIR are the model forcing functions, assumed to be known without error.
At variance with the study by Avogaro et al. (25), basal EGP (EGPb) was known from model independent estimates. Therefore, at least in ND individuals, parameter p1 could be calculated from the steady-state constraint, thus reducing the number of unknown parameters by one:
| (2) |
where X0 = SI · Ib, with Ib basal insulin.
Conversely, in participants with T1D, p1 was estimated from the data, since basal insulin is not well defined in this group.
Finally, model-based Rd was calculated as:
| (3) |
Model development.
Six models of increasing complexity were tested (Supplemental Fig. S1; all Supplemental material is available at https://doi.org/10.6084/m9.figshare.14178941). They all shared the description of Rd reported in Eq. 3 to describe the data of the first 120 min (pre-exercise phase), but incorporated different descriptions of the effects of exercise on Rd: insulin-independent and/or -dependent, immediate, and/or delayed.
Model 1. This model tests the existence of an insulin-independent effect of exercise on rate of glucose disappearance (IIRd) and assumes that such an effect is immediate and proportional to the exercise extent.
The model is the one of Eq. 1, in which the constant parameter p1 is substituted by the exercise-driven variable p1ex:
| (4) |
where p5 is the insulin-independent effect of the exercise on rate of glucose disappearance and E(t) is a signal marking the occurrence of exercise. E(t) was modeled either with a square-wave signal (equal to 1 during exercise and 0 otherwise) smoothed with a first-order low-pass filter, with time constant of 1 min, to obtain a continuous signal or assuming that E(t) increases linearly, from the start of the exercise (t = 120 min) to time 120 min + p7, where p7 is an unknown parameter, representing the time needed to reach the target exercise effort, and remains constant and equal to 1 until the end of the exercise. It is worth noting that p7 always collapsed to zero in the ND group.
Model 2. This model hypothesizes the existence of an insulin-dependent effect of exercise on glucose rate of disappearance (IDRd). Like Model 1, the model assumes that such an effect is immediate and proportional to exercise extent.
The model is that of Eq. 1, in which the constant parameter SI is substituted with the exercise-driven variable SIex and X(t) by Xex(t):
| (5) |
| (6) |
where p6 the insulin-dependent effect of exercise on the rate of glucose disappearance.
Model 3. Like model 2, model 3 assumes that exercise exerts its effect on insulin-dependent rate of glucose disappearance (IDRd) by modulating SI but, at variance with Model 2, here the action is delayed:
| (7) |
where Ea (t) is a signal, delayed with respect to E(t):
| (8) |
with p4 the rate constant of the insulin-dependent action of exercise on glucose rate of disappearance and E(t) the signal marking the occurrence of physical activity.
Model 4. This model combines the insulin-independent effect of Eq. 4 and the immediate action of the exercise on IDRd of Eq. 5 (Fig. 1, Supplemental Panel S4).
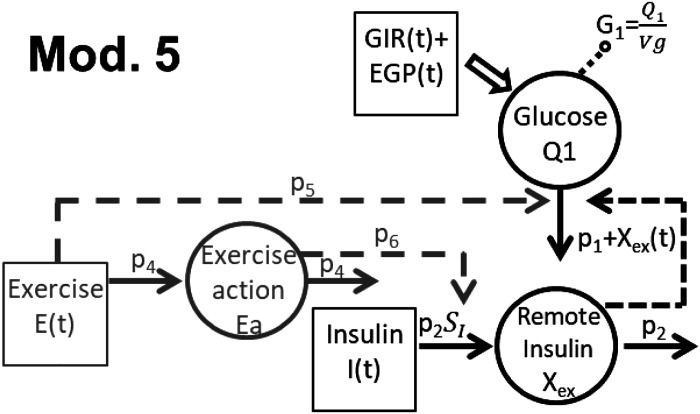
Model 5. This model assumes that physical activity exerts an immediate effect on IIRd (Eq. 4) and a delayed effect on IDRd (Eqs. 7 and 8) (Fig. 2).
Figure 2.
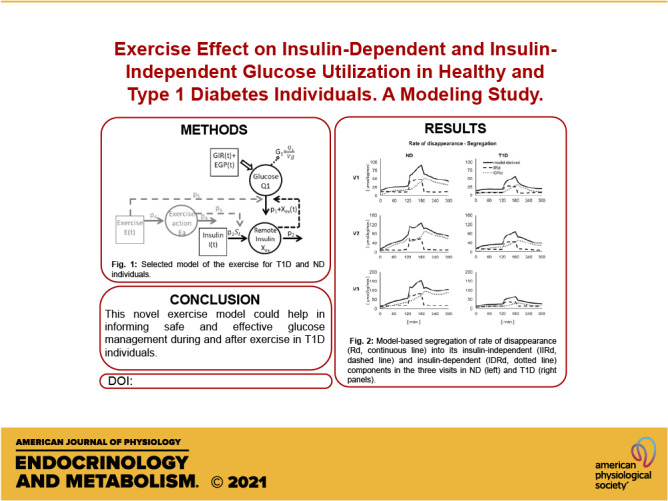
Selected model of the exercise for individuals with type 1 diabetes (T1D) and nondiabetic (ND) individuals. EGP, endogenous glucose production; GIR, glucose infusion rate.
Model 6. This model assumes that the effect of exercise on IDRd was immediate and the effect on IIRd delayed. In this case, one has:
| (9) |
Model identification.
All the models are a priori uniquely identifiable and were identified from plasma glucose concentration data using a Maximum a Posteriori (MAP) estimator (26) implemented in Matlab R2019b (27) to facilitate the a posteriori identifiability of the models. EGP, GIR, insulin concentration, and E are the model forcing functions, assumed to be known without error. Measurement error on glucose data was assumed to be independent, Gaussian, with zero mean and known constant coefficient of variation (CV), equal to 2%.
In detail, the identification procedure entails two steps. First, parameters Vg, p2, SI (and p1 in T1D) were estimated using data of the pre-exercise session (t = 0–120 min), separately in each visit, assuming that parameters were log-normally distributed with mean and variance taken from the study by Avogaro et al.(25). It resulted that Vg and p2 were similar in the three visits, while SI (as well as p1 in T1D) was not (data not shown). Thus, the identification was rerun simultaneously on the data of the three visits, keeping Vg and p2 constant among the visits, while accounting for possible inter-occasion variability of SI (and p1 in T1D). In the second step, we applied the MAP method to estimate the whole parameter set, using the data measured before, during, and after the exercise session (the so-called a posteriori information) and the subject-specific estimates and covariance matrix of the parameters estimated in the first step (the so-called a priori information). Parameters p5 and p6 were also allowed to vary among the three occasions to account for the intrasubject variability of the metabolic response to exercise.
Model selection.
Model performances were compared based on standard criteria, such as the ability to describe the data (weighted residual sum of squares, WRSS), the precision of parameter estimates (expressed as coefficient of variation, CV) and physiological plausibility of model parameters. The good precision of the estimated parameters was defined as CV < 50%. Among the model that well fit the data and provide precise estimate of the parameters, the best one was selected using the Bayesian information criterion (BIC) (28).
Model validation.
Rd profile can be derived from all the aforementioned models as:
| (10) |
where p1ex and Xex are the exercise-modulated disposal glucose effectiveness and insulin action, respectively, appropriately defined for each model. The models can also segregate the predicted Rd(t) into its insulin-independent (IIRd) and -dependent (IDRd) components:
| (11) |
| (12) |
In fact, if insulin were zero, Xex would also be zero, and Rd(t) would reduce to , i.e., the insulin-independent glucose uptake.
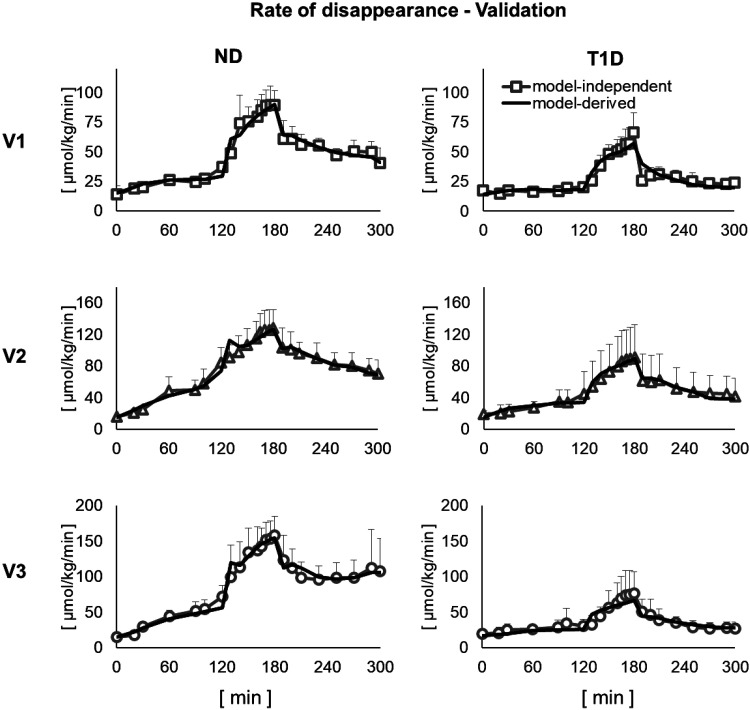
Model validation was performed by comparing model-independent and model-dependent estimates of Rd (Eq. 10).
Assessment of Exercise Effect on IIRd and IDRd in ND and T1D
The models enabled to single out the relative contribution of exercise in enhancing IIRd and IDRd. In fact, using the model, one could simulate what would have been the pattern of the insulin-dependent and -independent rate of disappearance with the same GIR, glucose, and insulin concentrations, but in the absence of exercise (IIRdrest and IDRdrest, respectively), by simply switching off the E(t) signal. Then, the effect of exercise (EE) on IIRd and IDRd was calculated as the ratio:
| (13) |
| (14) |
where AUC is the area under the curve.
Two-way ANOVA, implemented in Matlab R2019b (27), was used to assess between-group and within-group/among visits differences observed in EEIIRd and EEIDRd. A P value < 0.05 was considered statistically significant.
RESULTS
Model Selection and Validation
The metrics used to select the best model for the T1D group are summarized in Table 1. Similar results are obtained in the ND group (reported in Supplemental Table S1).
Table 1.
Model comparison in T1D
| Model No. | Residual Randomness | WRSS (Means ± SD) | Mean CV, % | BIC (Means ± SD) | No. of Parameters |
|---|---|---|---|---|---|
| 1 | no | 1,088 ± 582 | 13 | 1,129 ± 589 | 11 |
| 2 | no | 1,063 ± 644 | 16 | 1,104 ± 649 | 11 |
| 3 | no | 1,124 ± 667 | 14 | 1,169 ± 673 | 12 |
| 4 | yes | 593 ± 477 | 31 | 645 ± 483 | 14 |
| 5 | yes | 481 ± 376 | 29 | 541 ± 382 | 16 |
| 6 | yes | 591 ± 472 | 27 | 647 ± 478 | 15 |
BIC, Bayesian information criterion; CV, coefficient of variation; T1D, type 1 diabetes; WRSS, weighted residual sum of squares.
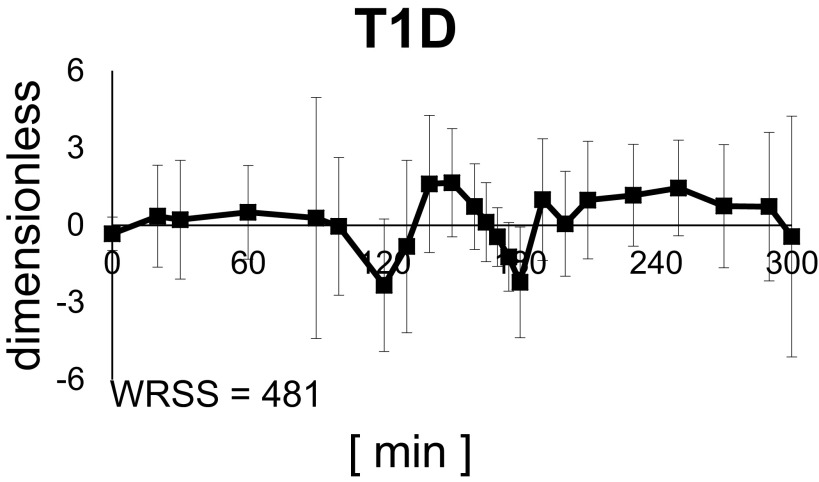
Models 1, 2, and 3 showed the worse results in terms of model fit (highest WRSS and nonrandom the residual pattern) in both populations (Supplemental Figs. S2 and S3), meaning that the data did not support the hypothesis that exercise exerts its effect on just one of the two components of glucose Rd. This led us to test the assumption that exercise simultaneously enhances IIRd and IDRd. In fact, model 4, which takes into account both immediate effects on IDRd and IIRd, provided a better fit of the data compared with Models 1, 2, and 3. However, model prediction still showed margins of improvements, likely due to the absence of a prolonged effect beyond exercise end. Model 6 did not improve significantly WRSS with respect to model 4, both in healthy subjects and subjects with T1D. Conversely, model 5 provided significantly (P < 0.05) lower WRSS and acceptable precision of parameter estimates (CVs < 50%). Therefore, and according to BIC, it was selected as the best model. The weighted residuals obtained with model 5 in the T1D group are shown in Fig. 3.
Figure 3.
Average weighted residual of the selected model. Vertical bars represent SD. T1D, type 1 diabetes; WRSS, weighted residual sum of squares.
Assessment of Exercise Effect on IIRd and IDRd in ND and T1D
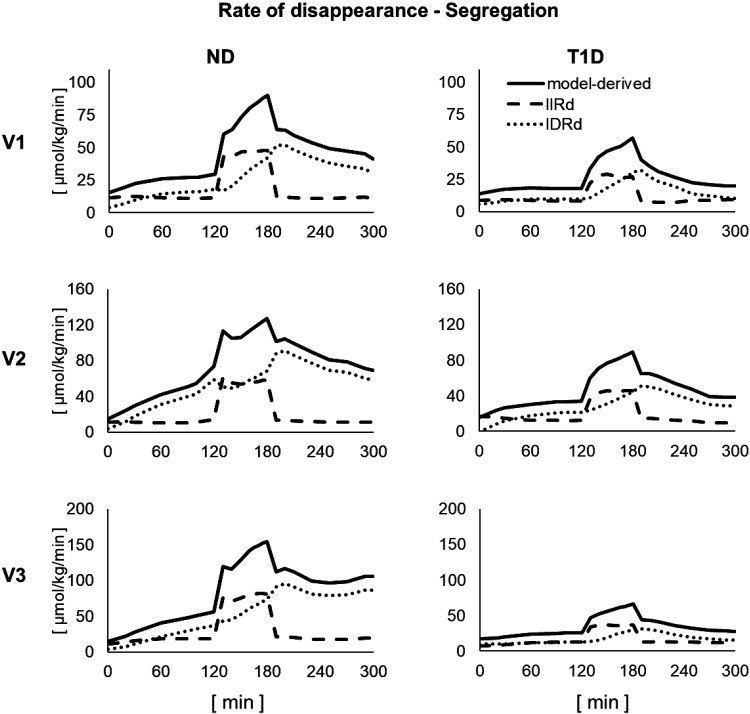
Model-based segregation of Rd into its IIRd and IDRd components is shown in Fig. 5.
Figure 5.
Model-based segregation of rate of disappearance (Rd, continuous line) into its insulin-independent (IIRd, dashed line) and insulin-dependent (IDRd, dotted line) components in the three visits in nondiabetic (ND, left) and type 1 diabetes (T1D, right).
The Rd time courses predicted by model 5 were in very good agreement with the model-independent estimates, obtained by applying Steele equation to the clamped [6,6-2H2]glucose to total glucose ratio (23, 24) (Fig. 4).
Figure 4.
Comparison between model-independent and model-derived glucose rate of disappearance in the three visits in nondiabetic (ND, left) and type 1 diabetes (T1D, right). Vertical bars represent SD.
EEIIRd in subjects with T1D was 66 ± 42% (means ± SD) during V1 (euglycemia—low insulin), 82 ± 84% during V2 (euglycemia—high insulin), and 53 ± 55% during V3 (hyperglycemia—low insulin), (Fig. 6, left). In ND subjects, EEIIRd was 67 ± 31% during V1, 97 ± 28% during V2, and 74 ± 16% during V3. Using ANOVA, we did not find any significant difference in EEIIRd, neither between groups nor among visits.
Figure 6.
Effect of physical activity on insulin-independent (left) and -dependent (right) rate of glucose disappearance in the three visits in nondiabetic (ND) and type 1 diabetes (T1D). Vertical bars represent SD.
EEIDRd in subjects with T1D was 155 ± 219% during V1, 81 ± 162% during V2, and 83 ± 109% during V3 (Fig. 6, right). In ND subjects, EEIDRd was 40 ± 33% during V1, 10 ± 17% during V2, and 22 ± 32% during V3. Using ANOVA, EEIDRd was significantly higher in T1D than ND population (P < 0.05).
DISCUSSION
Several studies (1–11, 16–18) have assessed exercise effect on glucose turnover in different experimental conditions, both in healthy and subjects with T1D. They mostly suggested that, at least at cellular level, exercise differently affects the insulin-independent and insulin-dependent components of glucose utilization. Very recently, Nguyen et al. (12) demonstrated that this hypothesis remains valid at whole body level. Our results are in agreement with those presented in the literature, confirming that exercise affect both IIRd and IDRd. With respect to the study by Nguyen et al. (12), our work has three elements of novelty: the validation of a mechanistic model able to describe glucose dynamics during aerobic exercise; the quantitative assessment of how hyperglycemia and/or hyperinsulinemia (15) affect exercise ability to promote glucose disposal; the results in ND subjects, to better understand T1D pathophysiology. It is worth noting that, using the model, it was possible to separate insulin-independent and -dependent components of Rd, even in the presence of circulating insulin, since the model can, in some sense, extrapolate system behavior at zero insulin. This is the advantage of using a model, which assumes a relationship among Rd, glucose mass, and insulin action. Needless to say, this is a model-based assessment of IIRd, difficult to safely validate in an experimental paradigm in human subjects. This is why we have gone through a very careful model validation.
We tested six models, all sharing a single-compartment structure of glucose kinetics and the assumption that insulin action on glucose disposal emanates from a compartment remote from plasma (25). The use of a single-compartment description for glucose kinetics was driven by the necessity of well-describing glucose kinetics in the pre-exercise phase with the minimum number of parameters, so that the addition of parameters to describe the exercise effect did not jeopardize model identifiability. However, the single-compartment assumption was acceptable since, during the clamp, glucose variations were modest (Fig. 1).
Results support the hypothesis that exercise affects both IIRd and IDRd, with the first almost immediate and the second delayed with respect to exercise onset. This holds both in T1D and ND population. In fact, models assuming that exercise has an effect only on IIRd or IDRd performed poorly in terms of model ability to predict the data (models 1, 2, 3). A significant improvement in terms of model fit was indeed obtained whenever the two combined effects were included in the model (models 4, 5 and 6 improved WRSS and BIC with respect to models 1, 2 and 3). This agrees with the results previously reported in Refs. 2, 3, 5–7, 10, 12, proving that exercise activates both the insulin-independent pathways and the insulin-dependent glucose uptake.
The better performance of model 5 with respect to models 4 and 6 in terms of parsimony criteria revealed that exercise effect is immediate on IIRd and delayed, with respect to the onset of physical activity, on IDRd. The first outcome may be explained by the fact that exercise triggers a rapid increase in blood flow, capillary recruitment and, through changes in intracellular ion fluxes, GLUT-4 translocation to the cell membrane, and all the above factors increase glucose transport in skeletal muscle (9, 29, 30). The second outcome agrees with the study by Greiwe et al. and Colberg et al. (11, 31) and Nguyen et al. (12), where authors reported that insulin-dependent glucose uptake continued beyond exercise session since muscles became more sensitive to the action of insulin. The selected model provided an estimate of glucose Rd similar to the model-independent Rd derived from tracer data, also available in this experiment.
The model allowed quantifying the exercise effect (EE) on insulin-independent and -dependent glucose utilization and, thanks to experimental design, to highlight the role of hyperglycemia and/or hyperinsulinemia in determining the extent of such an effect. Results show that neither hyperglycemia nor hyperinsulinemia inhibited exercise capability to stimulate IIRd (EEIIRd). On the other hand, EEIDRd tended to be lower, despite not significantly, both in hyperglycemia and hyperinsulinemia conditions than during euglycemia with low-circulating insulin.
Finally, results showed that, moderate aerobic exercise induced a similar increment in IIRd in ND population and population with T1D, with a range of 67%–97% and 66%–82%, respectively. Conversely, the effect of exercise on IDRd, was significantly higher in T1D (81%–155%) compared to ND (10%–40%). A possible explanation of the significant increment in IDRd in T1D compared with ND could be that exercise overcomes, at least in part, the whole body insulin resistance that is known to exist in T1D. This result can also in part explains why T1D are subjected to a higher risk of hypoglycemic episodes than ND after exercising, especially if the counterregulation is impaired.
A limitation of the model is that it slightly overestimated glucose concentration measurement at t = 120. That was indeed a critical moment during the experiment, when the subject moved from the bed to the bike to perform the exercise session. However, we believe that the inability of the model to fit a single glucose sample does not jeopardize the validity of model and its predictions. Another limitation is the rather simplistic model of the signal E(t) used to mark the occurrence of exercise. We acknowledge that using a more physiological signal, e.g., the heart rate, could have improved model performance to some extent. In any case, the model could be easily modified to incorporate any possible physiological signal linked to physical activity and model parameters rescaled accordingly. It is worth noting that the time needed to reach the target exercise effort could be different in more trained subjects or in other populations, e.g., subjects with T2D, or if the experimental conditions were changed, e.g., types and intensities of exercise. Therefore, this assumption could be revised in future studies. In addition, here, EGP was used as known input of the model, mainly to avoid parameter compensation, likely to occur when one tries to model exercise effect on Rd and EGP simultaneously. The development of a model of exercise effect on endogenous glucose production (EGP) will allow to overcome this limitation. This will make it possible to complete the assessment of the effect of exercise on glucose turnover. Finally, the study was conducted on a small number of subjects; therefore, additional studies are required to draw robust general conclusions.
In conclusion, the results represent a step-forward in the knowledge of T1D pathophysiology, and a useful comparator for similar studies either performed in subjects undergoing different types and intensities of exercise, or in different populations, e.g., trained subjects and type 2 diabetes.
Possible future developments include testing the model in experimental settings that better fit the real-life conditions, e.g., in the postprandial state and model incorporation in the UVa/Padova T1D simulator (32) so that it can be employed to design algorithms for adjusting insulin therapy during and after exercise.
SUPPLEMENTAL DATA
Supplemental Table S1 and Supplemental Figs. S1–S3: https://doi.org/10.6084/m9.figshare.14178941
GRANTS
This study was supported by the Italian Minister for Education under the initiative “Departments of Excellence” (Law 232/2016), by National Institutes of Health National Institute of Diabetes and Digestive and Kidney Diseases Grants R01-DK-90541 and R01-DK-29953 (to R. Basu) and R01-DK-85516 and DP3-DK-106785 (to A. Basu), and by National Center for Advancing Translational Science Grant UL1 TR000135.
DISCLOSURES
No conflicts of interest, financial or otherwise, are declared by the authors.
AUTHOR CONTRIBUTIONS
D.R., A.B., C.C., R.B., and C.D.M. conceived and designed research; D.R. and A.B. performed experiments; D.R. and M.S. analyzed data; D.R., M.S., A.B., C.C., R.B., and C.D.M. interpreted results of experiments; D.R. prepared figures; D.R. drafted manuscript; M.S., A.B., C.C., R.B., and C.D.M. edited and revised manuscript; D.R., M.S., A.B., C.C., R.B., and C.D.M. approved final version of manuscript.
ACKNOWLEDGMENTS
The authors thank Barbara Norby, Brent McConahey, and Michael Slama (Endocrine Research Unit, Mayo Clinic) and the staff of the Mayo Clinic CRTU for contributions in the conduct of the study.
REFERENCES
- 1.Riddell MC, Gallen IW, Smart CE, Taplin CE, Adolfsson P, Lumb AN, Kowalski A, Rabasa-Lhoret R, McCrimmon RJ, Hume C, Annan F, Fournier PA, Graham C, Bode B, Galassetti P, Jones TW, Millán IS, Heise T, Peters AL, Petz A, Laffel LM. Exercise management in type 1 diabetes: a consensus statement. Lancet Diabetes Endocrinol 5: 377–390, 2017. doi: 10.1016/s2213-8587(17)30014-1. [DOI] [PubMed] [Google Scholar]
- 2.Andersen P, Saltin B. Maximal perfusion of skeletal muscle in man. J Physiol 366: 233–249, 1985. doi: 10.1113/jphysiol.1985.sp015794. [DOI] [PMC free article] [PubMed] [Google Scholar]
- 3.Aoi W, Naito Y, Yoshikawa T. Role of oxidative stress in impaired insulin signaling associated with exercise-induced muscle damage. Free Radic Biol Med 65: 1265–1272, 2013. doi: 10.1016/j.freeradbiomed.2013.09.014. [DOI] [PubMed] [Google Scholar]
- 4.Dohm GL. Invited review: Regulation of skeletal muscle GLUT-4 expression by exercise. J Appl Physiol 93: 782–787, 2002. doi: 10.1152/japplphysiol.01266.2001. [DOI] [PubMed] [Google Scholar]
- 5.Hawley JA, Lessard SJ. Exercise training‐induced improvements in insulin action. Acta Physiol 192: 127–135, 2007. doi: 10.1111/j.1748-1716.2007.01783.x. [DOI] [PubMed] [Google Scholar]
- 6.Holloszy JO. Exercise-induced increase in muscle insulin sensitivity. J Appl Physiol 99: 338–343, 2005. doi: 10.1152/japplphysiol.00123.2005. [DOI] [PubMed] [Google Scholar]
- 7.Proctor DN, Shen PH, Dietz NM, Eickhoff TJ, Lawler LA, Ebersold EJ, Loeffler DL, Joyner MJ. Reduced leg blood flow during dynamic exercise in older endurance-trained men. J Appl Physiol 85: 68–75, 1998. doi: 10.1152/jappl.1998.85.1.68. [DOI] [PubMed] [Google Scholar]
- 8.Thorell A, Hirshman MF, Nygren J, Jorfeldt L, Wojtaszewski JFP, Dufresne SD, Horton ES, Ljungqvist O, Goodyear LJ. Exercise and insulin cause GLUT-4 translocation in human skeletal muscle. Am J Physiol Endocrinol Metab 277: E733–E741, 1999. doi: 10.1152/ajpendo.1999.277.4.e733. [DOI] [PubMed] [Google Scholar]
- 9.Wasserman DH, Kang L, Ayala JE, Fueger PT, Lee-Young RS. The physiological regulation of glucose flux into muscle in vivo. J Exp Biol 214: 254–262, 2011. doi: 10.1242/jeb.048041. [DOI] [PMC free article] [PubMed] [Google Scholar]
- 10.Zierath JR, Krook A, Wallberg-Henriksson H. Insulin action and insulin resistance in human skeletal muscle. Diabetologia 43: 821–835, 2000. doi: 10.1007/s001250051457. [DOI] [PubMed] [Google Scholar]
- 11.Greiwe JS, Hickner RC, Hansen PA, Racette SB, Chen MM, Holloszy JO. Effects of endurance exercise training on muscle glycogen accumulation in humans. J Appl Physiol 87: 222–226, 1999. doi: 10.1152/jappl.1999.87.1.222. [DOI] [PubMed] [Google Scholar]
- 12.Nguyen T-TP, Jacobs PG, Castle JR, Wilson LM, Kuehl K, Branigan D, Gabo V, Guillot F, Riddell MC, Haidar A, El Youssef J. Separating insulin-mediated and non-insulin-mediated glucose uptake during aerobic exercise in people with type 1 diabetes. Am J Physiol Endocrinol Metab. 320: E425–E437, 2021. doi: 10.1152/ajpendo.00534.2020. [DOI] [PMC free article] [PubMed] [Google Scholar]
- 13.Breton MD. Physical activity—the major unaccounted impediment to closed loop control. J Diabetes Sci Technol 2: 169–174, 2008. doi: 10.1177/193229680800200127. [DOI] [PMC free article] [PubMed] [Google Scholar]
- 14.Derouich M, Boutayeb A. The effect of physical exercise on the dynamics of glucose and insulin. J Biomech 35: 911–917, 2002. doi: 10.1016/s0021-9290(02)00055-6. [DOI] [PubMed] [Google Scholar]
- 15.Romeres D, Olson K, Carter R, Cobelli C, Dalla Man C, Basu A, Basu R. Hyperglycemia but not hyperinsulinemia is favorable for exercise in type 1 diabetes: a pilot study. Diabetes Care 43: 2176–2182, 2020. doi: 10.2337/dc20-0611. [DOI] [PMC free article] [PubMed] [Google Scholar]
- 16.Edinburgh RM, Hengist A, Smith HA, Travers RL, Koumanov F, Betts JA, Thompson D, Walhin J-P, Wallis GA, Hamilton DL, Stevenson EJ, Tipton KD, Gonzalez JT. Preexercise breakfast ingestion versus extended overnight fasting increases postprandial glucose flux after exercise in healthy men. Am J Physiol Endocrinol Metab 315: E1062–E1074, 2018. doi: 10.1152/ajpendo.00163.2018. [DOI] [PMC free article] [PubMed] [Google Scholar]
- 17.Morrison DJ, Kowalski GM, Grespan E, Mari A, Bruce CR, Wadley GD. Measurement of postprandial glucose fluxes in response to acute and chronic endurance exercise in healthy humans. Am J Physiol Endocrinol Metab 314: E503–E511, 2018. doi: 10.1152/ajpendo.00316.2017. [DOI] [PubMed] [Google Scholar]
- 18.Petersen KF, Price TB, Bergeron R. Regulation of net hepatic glycogenolysis and gluconeogenesis during exercise: impact of type 1 diabetes. J Clin Endocrinol Metab 89: 4656–4664, 2004. doi: 10.1210/jc.2004-0408. [DOI] [PMC free article] [PubMed] [Google Scholar]
- 19.Schiavon M, Hinshaw L, Mallad A, Dalla Man C, Sparacino G, Johnson M, Carter R, Basu R, Kudva Y, Cobelli C, Basu A. Postprandial glucose fluxes and insulin sensitivity during exercise: a study in healthy individuals. Am J Physiol Endocrinol Metab 305: E557–E566, 2013. doi: 10.1152/ajpendo.00182.2013. [DOI] [PMC free article] [PubMed] [Google Scholar]
- 20.Mallad A, Hinshaw L, Schiavon M, Dalla Man C, Dadlani V, Basu R, Lingineni R, Cobelli C, Johnson ML, Carter R, Kudva YC, Basu A. Exercise effects on postprandial glucose metabolism in type 1 diabetes: a triple-tracer approach. Am J Physiol Endocrinol Metab 308: E1106–E1115, 2015. doi: 10.1152/ajpendo.00014.2015. [DOI] [PMC free article] [PubMed] [Google Scholar]
- 21.Ebeling P, Koistinen HA, Koivisto VA. Insulin-independent glucose transport regulates insulin sensitivity. FEBS Lett 436: 301–303, 1998. doi: 10.1016/s0014-5793(98)01149-1. [DOI] [PubMed] [Google Scholar]
- 22.Kahn SE, Prigeon RL, McCulloch DK, Boyko EJ, Bergman RN, Schwartz MW, Neifing JL, Ward WK, Beard JC, Palmer JP. The contribution of insulin-dependent and insulin-independent glucose uptake to intravenous glucose tolerance in healthy human subjects. Diabetes 43: 587–592, 1994. doi: 10.2337/diab.43.4.587. [DOI] [PubMed] [Google Scholar]
- 23.Basu R, Di Camillo B, Toffolo G, Basu A, Shah P, Vella A, Rizza R, Cobelli C. Use of a novel triple-tracer approach to assess postprandial glucose metabolism. Am J Physiol Endocrinol Metab 284: E55–E69, 2003. doi: 10.1152/ajpendo.00190.2001. [DOI] [PubMed] [Google Scholar]
- 24.Steele R, Wall JS, De Bodo RC, Altszuler N. Measurement of size and turnover rate of body glucose pool by the isotope dilution method. Am J Physiol Legacy Content 187: 15–24, 1956. doi: 10.1152/ajplegacy.1956.187.1.15. [DOI] [PubMed] [Google Scholar]
- 25.Avogaro A, Vicini P, Valerio A, Caumo A, Cobelli C. The hot but not the cold minimal model allows precise assessment of insulin sensitivity in NIDDM subjects. Am J Physiol Endocrinol Metab 270: E532–E540, 1996. doi: 10.1152/ajpendo.1996.270.3.E532. [DOI] [PubMed] [Google Scholar]
- 26.Cobelli C, Carson E. Introduction to Modeling in Physiology and Medicine. New York: Academic Press, 2019. [Google Scholar]
- 27.MATLAB. 9.7.0.1190202 (R2019b). Natick, MA: The MathWorks Inc., 2019. [Google Scholar]
- 28.Kass RE, Raftery AE. Bayes factors. J Am Stat Assoc 90: 773–795, 1995. doi: 10.1080/01621459.1995.10476572. [DOI] [Google Scholar]
- 29.Shepherd PR, Kahn BB. Glucose transporters and insulin action—implications for insulin resistance and diabetes mellitus. N Engl J Med 341: 248–257, 1999. doi: 10.1056/nejm199907223410406. [DOI] [PubMed] [Google Scholar]
- 30.World of Sports Science. Skin and muscle blood flow during exercise. Encyclopedia.com. 24 Jun. 2019.
- 31.Colberg SR, Sigal RJ, Yardley JE, Riddell MC, Dunstan DW, Dempsey PC, Horton ES, Castorino K, Tate DF. Physical activity/exercise and diabetes: a position statement of the American Diabetes Association. Diabetes Care 39: 2065–2079, 2016. doi: 10.2337/dc16-1728. [DOI] [PMC free article] [PubMed] [Google Scholar]
- 32.Visentin R, Campos-Náñez E, Schiavon M, Lv D, Vettoretti M, Breton M, Kovatchev BP, Dalla Man C, Cobelli C. The UVA/Padova type 1 diabetes simulator goes from single meal to single day. J Diabetes Sci Technol 12: 273–281, 2018. doi: 10.1177/1932296818757747. [DOI] [PMC free article] [PubMed] [Google Scholar]


