

Abstract
We describe the development of 236 children with Angelman syndrome (AS) using the Bayley Scales of Infant and Toddler Development, Third Edition. Multilevel linear mixed modeling approaches were used to explore differences between molecular subtypes and over time. Individuals with AS continue to make slow gains in development through at least age 12 years of age at about 1–2 months/year based on age equivalent score and 1–16 growth score points/year depending on molecular subtype and domain. Children with a deletion have lower scores at baseline and slower rate of gaining skills while children with UBE3A variant subtype demonstrated higher scores as well as greater rates of skill attainment in all domains. The developmental profiles of UPD and ImpD were similar.
Keywords: Neurodevelopmental disorders, Motor skills disorders, Language development disorders, Developmental disabilities, Child development
Angelman syndrome (AS) is a rare neurogenetic syndrome with an estimated prevalence of 1 in 22,000 to 1 in 52,000 (Luk and Lo 2016; Mertz et al. 2013; Oiglane-Shlik et al. 2006; Yakoreva et al. 2019). The characteristics of AS include seizures, ataxia, fine motor challenges, and a happy demeanor (Guerrini et al. 2003; Williams et al. 2006). The developmental profile of AS is characterized by severe to profound intellectual disability with absent or minimal verbal speech. As such, these individuals have no capacity for independent living and require lifelong care (Bird 2014; Dagli et al. 2012).
The underlying etiology of AS is the lack of expression of the maternally inherited UBE3A gene on chromosome 15q11q13 (Bird 2014; Lalande and Calciano 2007), which may be caused by one of four mechanisms, viz. a deletion encompassing this locus on the maternally-inherited copy of chromosome 15, paternal uniparental disomy (UPD), imprinting defects on the maternal chromosome 15 that results in silencing of UBE3A on that chromosome, and a pathogenic variant in the maternally-inherited copy of UBE3A. Each of these mechanisms is considered a distinct “molecular subtype” of AS. The most common subtype, occurring in approximately 70% of affected individuals, is the “deletion subtype” (Lalande and Calciano 2007). Among individuals with a deletion, 40% have a class I deletion that is ~5.8 Mb in size, and 50–55% have a class II deletion that is ~5.0 Mb in size (Varela et al. 2004); the remainder have a deletion that is either larger than a class I or smaller than a class II deletion (Bird 2014). Approximately 8–9% of individuals with AS have paternal UPD of chromosome 15, 7–8% have an imprinting defect (ImpD), and 11% have a pathogenic variant in the maternally-inherited UBE3A (Clayton-Smith and Laan 2003); these latter individuals who do not harbor a deletion on chromosome 15 are often classified as having “non-deletion” AS, in contrast to those who have AS due to a chromosome 15 deletion. The severity of the phenotype is dependent on the molecular etiology; individuals with a deletion tend to present with a more severe phenotype, while those with non-deletion have slightly milder and more variable presentations (Bird 2014; Lossie et al. 2001; Peters et al. 2012; Tan et al. 2011; Varela et al. 2004).
Although AS was described over 50 years ago, characterization of the developmental profiles and trajectory has been limited. Most estimates of developmental functioning suggest that, even in adulthood, the cognitive skills of individuals with AS are limited and more similar to those of children under the age of 2 years (Bindels-de Heus et al. 2020; Gentile et al. 2010; Mertz et al. 2014; Peters et al. 2004, 2012; Sahoo et al. 2006). Cross-sectional developmental studies have found that children with AS due to a deletion are developmentally more delayed across all domains compared to those with a UBE3A pathogenic variant and UPD (Gentile et al. 2010; Bindels-de Heus et al. 2020).
Individuals with AS are predominantly non-verbal with a minority (almost always non-deletion AS) having a vocabulary of a few word approximation or recognizable words (Andersen et al. 2001; Pearson et al. 2019; Quinn and Rowland 2017), and even fewer develop the use of phrase speech (Sadhwani et al. 2018). Receptive language, although still significantly delayed, is often better developed than expressive language (Gentile et al. 2010; Mertz et al. 2014). Individuals with AS also have abnormal muscle tone, balance, and coordination (Buntinx et al. 1995; Clayton-Smith and Laan 2003), all of which contribute to signficant motor impairment. Individuals with non-deletion AS are more likely to sit and walk independently at a younger age than those with deletion AS (Lossie et al. 2001).
A limited number of longitudinal studies with small sample sizes have contributed to our current understanding of the developmental progression of AS. While regression of skills is rare, two non-interventional observational studies of children with an AS deletion have suggested that there are no significant changes in age equivalent scores in the cognitive domains (Peters et al. 2012; Mertz et al. 2014) and only modest improvement in receptive and expressive communication age equivalent scores over time (Mertz et al. 2014). The average age of the participants in these two studies ranged from 4 to 7 years. While participants in the Peters et al. (2012) study were re-evaluated one year after the baseline visit, participants in the Mertz et al. (2014) study had their subsequent follow-up visit 12 years later. To our knowledge, no studies have explicitly examined developmental trajectories in individuals across all molecular subtypes.
The current study used data from a multisite natural history study to characterize the developmental profiles and trajectories of individuals with AS over time and examined how these profiles and trajectories differ depending on molecular subtypes. The primary goals of this study were to: (1) describe trajectories of skills attained by children with AS in the cognitive, receptive communication, expressive communication, fine motor, and gross motor domains; (2) describe differences among molecular subtypes across developmental domains; and (3) describe patterns of developmental strengths and weaknesses for children with AS based on molecular subtypes.
Methods
Participants
Participants were drawn from the AS Natural History study (ClinicalTrials.gov identifier: NCT00296764), which was conducted from January 2006 to August 2014. They were recruited through parent support groups (e.g. Angelman Syndrome Foundation, AS listserv), and referrals from professional colleagues. Participants were evaluated approximately once a year at one of six study sites: Rady Children’s Hospital San Diego, Texas Children’s Hospital, Greenwood Genetic Center, Boston Children’s Hospital, Vanderbilt University Medical Center, and Cincinnati Children’s Hospital Medical Center. This study was approved by the Institutional Review Boards at each study site. Written consent was obtained from the legal guardian of each participant.
Only participants with a confirmed molecular diagnosis of AS and without other co-morbidities that might obscure the AS phenotype (e.g., an additional genetic diagnosis associated with developmental delay or extreme prematurity) (n = 302) were included, and for the majority, the specific molecular subtype was known. We restricted our analyses to data collected on individuals who were at least 12 months of age and less than 13 years of age. In addition, participants were excluded for the following reasons: deletions that were not or could not be classified into either class I or class II; insufficient molecular testing to allow for classification into one of the four molecular subtypes; mosaic genotype; or developmental functioning exceeding the performance thresholds on the Bayley Scales of Infant and Toddler Development, Third Edition (Bayley-III) (Bayley 2006), resulting in a final sample of 236 participants.
Measures
Developmental Functioning
Developmental functioning was assessed by the site psychologists using the Bayley-III. The Bayley-III is designed to assess skills in the cognitive, receptive communication, expressive communication, fine motor, and gross motor domains in children from birth to 42½ months old. Although normed for a younger age group, it is widely used to assess developmental skills in older children with severe cognitive impairments primarily because individuals with severe disability are better assessed by standardized measures appropriate for their developmental level rather than chronological age (Lichtenberger 2005). The Bayley-III is a well-validated measure of developmental progression and is sensitive to change (Bode et al. 2014; Rubio-Codina and Grantham-McGregor 2020; Weiss et al. 2010). Additionally, it does not rely heavily on verbal skills or motor planning, which allows all individuals with AS to complete most of the tasks despite their lack of verbal communication. The Bayley-III has been used in multiple studies of AS, including almost all previous and current clinical trials (Grieco et al. 2014; Peters et al. 2004; Tan et al. 2018; Wink et al. 2015). Because the majority of individuals in our sample were above the upper age limit for the norm-referenced standard scores, growth score equivalents and age-equivalent scores were used in the analyses for this study. Growth score equivalents are used to determine relative individual changes in each domain over time. These growth score equivalents are based on item response theory and are on an interval scale. They are directly derived from the raw scores using a conversion table listed in the Bayley manual (Table B6, pp. 219, Bayley 2006. Growth scores are age-corrected with a range of 200–800 (mean = 500, SD = 100). All site psychologists had extensive experience working with individuals with AS and administering the Bayley-III.
Statistical Analyses
Descriptive statistics, including mean age and frequencies, were computed using SAS software (version 9.4, SAS Institute, Cary, NC), and missing data points were not imputed. Comparisons were made using Chi-square for categorical variables and one-way analysis of variance for continuous variables.
For all molecular subtypes, the age-equivalents and growth score equivalents of each Bayley-III domain (Figs. 1 and 2) demonstrated a change in score over time with variation between the domains to support the use of a linear mixed model (LMM) also known as “multilevel model”). LMM is commonly used to examine changes in human development over time because it accounts for correlations in higher-level clustering unit (i.e., time). It also does not have the more restrictive requirement of balanced repeated measures design (e.g., unequal spacing of time intervals), is robust against missing data, and does not require the assumption of equal error variance, thereby providing robust standard errors of estimates (Singer and Willett 2003).
Fig. 1.
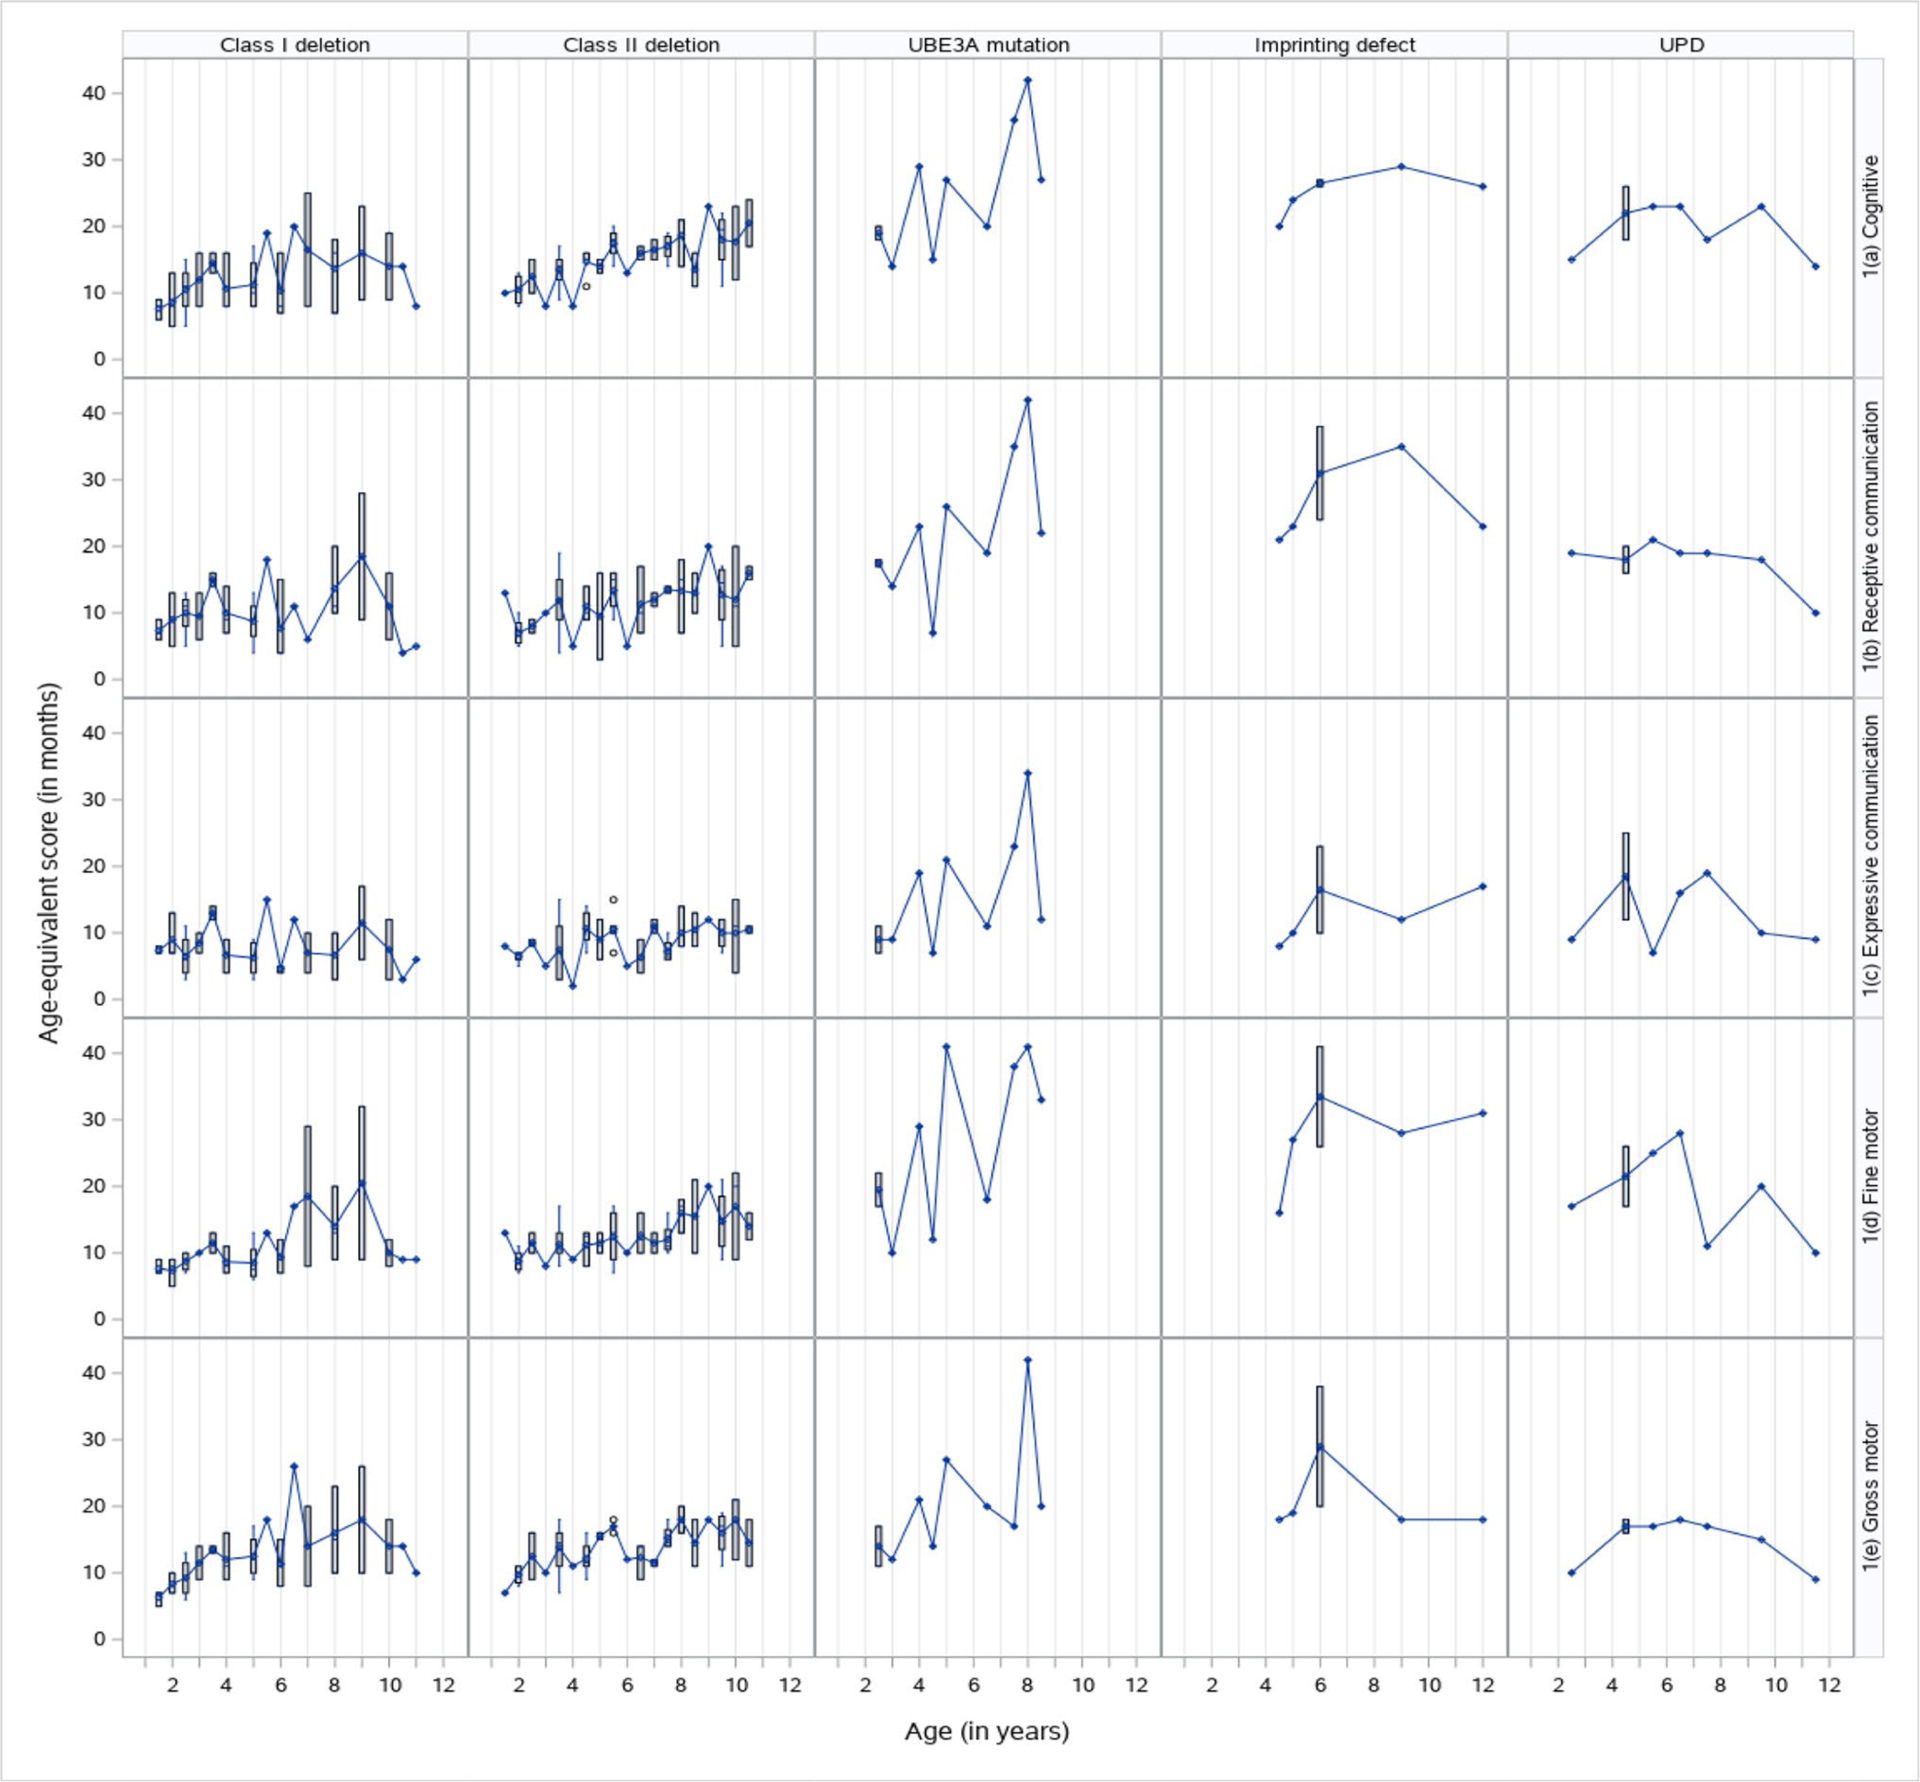
Cross-sectional distribution of Bayley-III Age-equivalent scores by subtype and domain
Fig. 2.
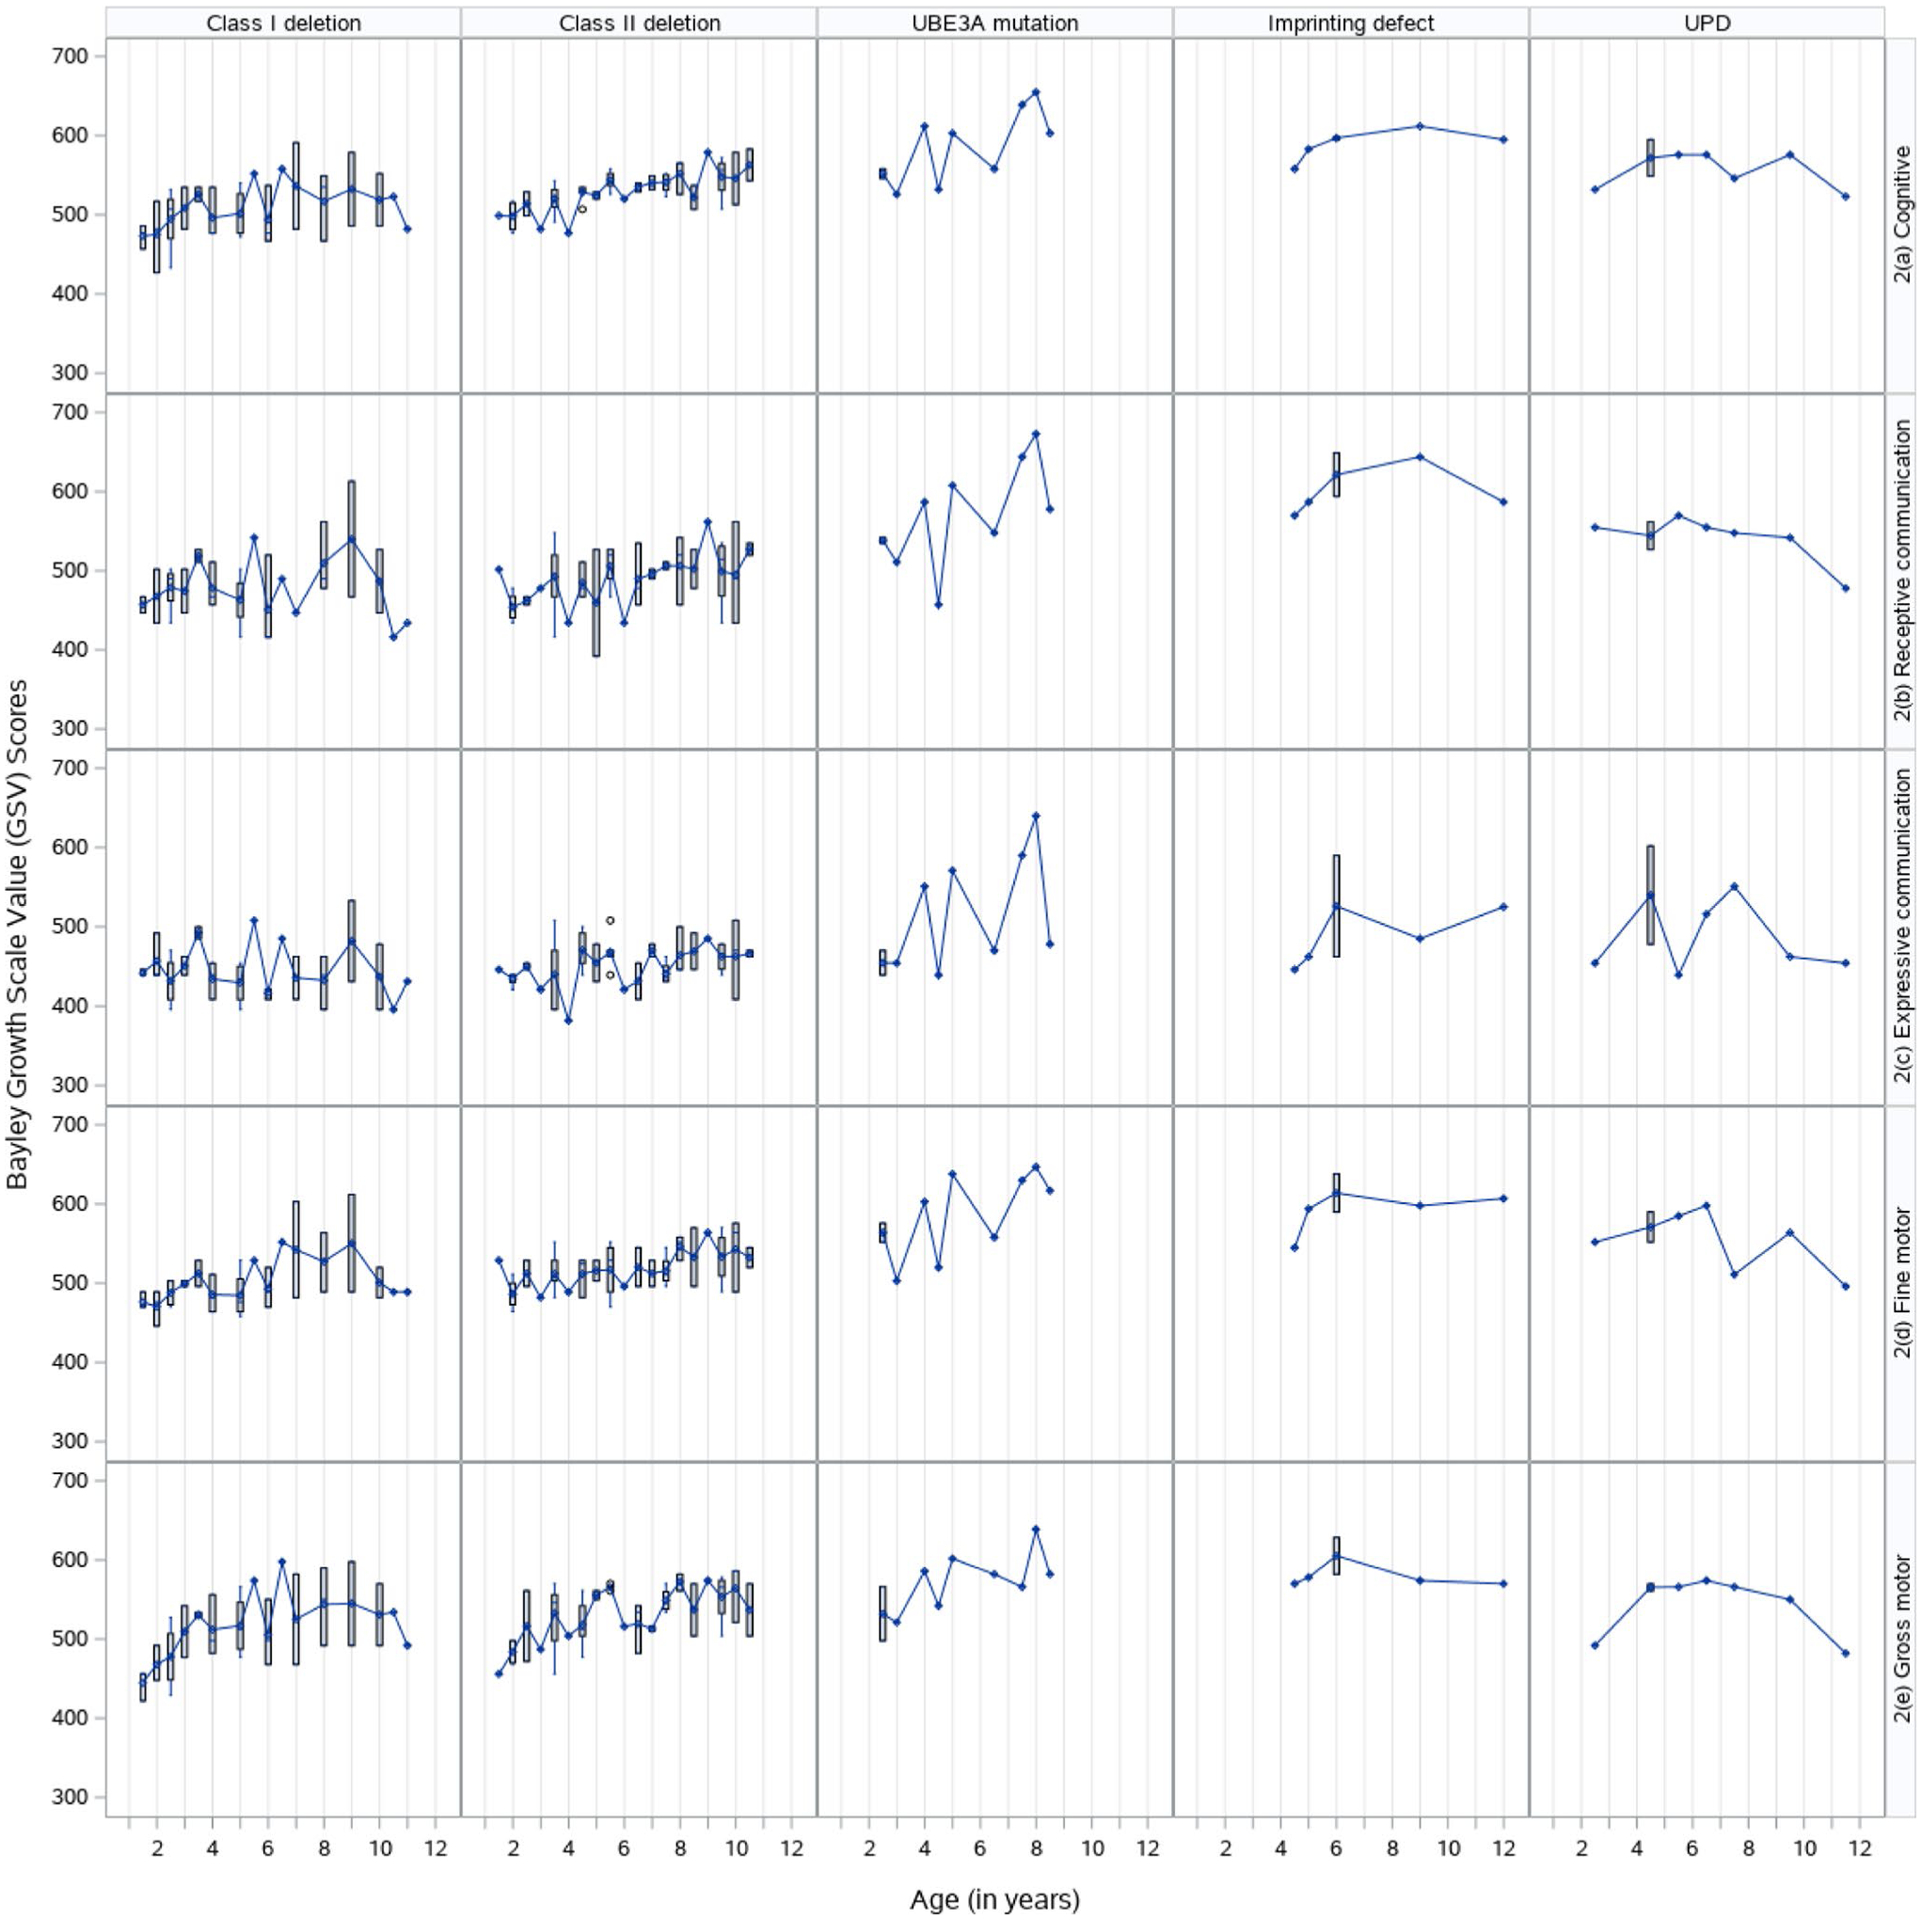
Cross-sectional distribution of Bayley-III Growth Scale Value (GSV) scores by subtype and domain
Although a quadratic term for time was tested in the model-building process, the likelihood ratio test revealed that the improvement in the model was not statistically significant. The simpler form of time is also preferred because it facilitates interpretation of the model and allows for testing of slope differences. Estimates of the final models were used to test differences in mean and slope parameters within molecular subtype.
The LMM was conducted in two separate but similar analyses: the first was to describe the molecular subtype differences within each developmental domain using the age-equivalents and growth score equivalents from the Bayley-III, and the second was to describe the differences in functioning across the different developmental domains within each molecular subtype using age-equivalent scores from the Bayley-III. In this analysis, level-1 accurately estimated the initial score and change rate of the developmental score (i.e., time level). Level-2 was designed to show the change rate by domain (using Bayley-III scores: both age equivalents and growth score equivalents) across subtypes (i.e., subtype level) for the first analysis and in developmental domains by molecular subtype using age-equivalent Bayley-III scores (i.e., domain level) for the second analysis. Random effects of intercept and slope were included in the model as well to account for individual differences in baseline scores and individual differences in rates of skill development. Change in scores over time are displayed using a variety of formats.
For both analyses, a scatterplot (i.e., QQ plots) of the residuals was used to assess normality. Individual trajectories were plotted with linear trends fitted by ordinary least squares. In building the linear models, the maximum likelihood (ML) function was used to estimate the parameters and, after a series of models were tested, the final model was selected using the fit statistics Akaike Information Criterion (AIC) and Bayesian Information Criterion (BIC) as well testing nested models using the likelihood ratio test using the changes in −2 Log Likelihood estimated from a Laplace estimation (Singer and Willett 2003). SAS procedure PROC GLIMMIX was used for the estimation and statistical inference for the linear mixed model (SAS 2017). For ease of interpretation, age was centered around 6 years, which was the mean age of the sample population. Class II deletion was chosen as the reference group because it was the largest subtype. Effect plots using PROC PLM were created for each scale estimation and to display the differences in estimated linear slopes. Additional pairwise differences in mean scores and slopes were tested using least-squares means with Bonferroni adjustments for multiple comparison tests for differences between molecular subtypes for each developmental domain and between domains within each molecular subtype. Significance of random effects were tested using Wald Z tests. Additional residual diagnostics and sensitivity analyses were conducted to determine the possible effects of site of evaluation.
Results
Sample Characteristics
The final sample was evenly split between males and females (n = 118 each). Approximately 72% of the participants had a chromosome 15q11q13 deletion, 10% had UPD, 8% had an ImpD, and 10% had a UBE3A variant (Table 1). A history of clinical seizures was reported in approximately 60% of the cohort with a mean age of first clinical seizure at 1.7 years (SD = 1.5). A total of 737 observations were included, with the mean number of visits for the cohort being 3.1 (SD = 2.0). A detailed breakdown of the number of visits across different molecular subtype and ages is provided in Table 2. Site of evaluation was not a significant covariate and therefore not added to the model.
Table 1.
Characteristics of AS participants in the study
| Class I deletion (N = 66) 28% |
Class II deletion (N = 98) 42% |
UBE3A mutation (N = 29) 12% |
ImpD (N = 17) 7% |
UPD (N = 26) 11% |
Overall N = 236 |
p | |
|---|---|---|---|---|---|---|---|
| Gender | |||||||
| Male | 35 (53%) | 49 (50%) | 11 (38%) | 8 (47%) | 15 (58%) | 118 (50%) | NS |
| Female | 31 (47%) | 49 (50%) | 18 (62%) | 9 (53%) | 11 (42%) | 118 (50%) | |
| Age at baseline (years) | |||||||
| Mean ± SD | 4.0 ± 3.2 | 4.2 ± 2.8 | 5.0 ± 3.2 | 5.4 ± 2.7 | 5.8 ± 2.9 | 4.5 ± 3.0 | <.05 |
| Range | (1.1–12.8) | (1.1–12.8) | (1.4–12.7) | (2.3–11.4) | (2.1–11.5) | (1.1–12.8) | |
| Age at final visit (years) | |||||||
| Mean ± SD | 6.4 ± 3.6 | 6.9 ± 3.6 | 6.9 ± 3.0 | 8.2 ± 3.0 | 7.8 ± 2.8 | 6.9 ± 3.4 | NS |
| Range | (1.1–12.8) | (1.1–12.8) | (1.4–12.7) | (3.6–12.8) | (2.5–12.9) | (1.1–12.9) | |
| Number of visits (Continuous) | NS | ||||||
| Mean ± SD | 3.2 ± 2.1 | 3.3 ± 2.0 | 2.6 ± 1.8 | 3.4 ± 2.2 | 2.7 ± 1.3 | 3.1 ± 2.0 | |
| Range | (1–9) | (1–8) | (1–7) | (1–7) | (1–5) | (1–9) | |
| Number of visits | NS | ||||||
| Only One visit | 14 (21%) | 19 (19%) | 12 (41%) | 4 (24%) | 6 (23%) | 55 (23%) | |
| Only Two visits | 15 (23%) | 26 (27%) | 5 (17%) | 4 (24%) | 5 (19%) | 55 (23%) | |
| Three or more visits | 37 (56%) | 53 (54%) | 12 (41%) | 9 (53%) | 15 (58%) | 126 (53%) | |
| History of seizures | 48 (73%) | 66 (67%) | 8 (28%) | 6 (35%) | 14 (54%) | 142 (60%) | <.0001 |
| Age of first clinical seizure (years) | |||||||
| Mean ± SD | 1.2 ± 1.1 | 1.8 ± 1.2 | 1.3 ± 0.7 | 3.0 ± 2.6 | 3.0 ± 2.6 | 1.7 ± 1.5 | <.001 |
| Range | (0–5) | (0–5) | (0–2) | (0–7) | (0–8) | (0–8) | |
ImpD: imprinting defect, NS: Not statistically significant, UPD: paternal uniparentaldisomy
Table 2.
Number of observations for each genetic subtype at each age
| Age (years) | Class I deletion (N = 66; Obs = 209) | Class II deletion (N = 98; Obs = 323) | UBE3A mutation (N = 29; Obs = 76) | ImpD (N = 17; Obs = 58) | UPD (N = 26; Obs = 71) | Overall N = 236 (Obs = 737) |
|---|---|---|---|---|---|---|
| 1 | 22 (10.5%) | 20 (6.2%) | 4 (5.3%) | 0 (0.0%) | 0 (0.0%) | 46 (6.2%) |
| 2 | 27 (12.9%) | 36 (11.2%) | 9 (11.8%) | 1 (1.7%) | 6 (8.5%) | 79 (10.7%) |
| 3 | 25 (12.0%) | 41 (12.7%) | 9 (11.8%) | 6 (10.3%) | 8 (11.3%) | 89 (12.1%) |
| 4 | 31 (14.8%) | 39 (12.1%) | 12 (15.8%) | 9 (15.5%) | 12 (16.9%) | 103 (14.0%) |
| 5 | 21 (10.1%) | 35 (10.8%) | 12 (15.8%) | 11 (19.0%) | 9 (12.7%) | 88 (11.9%) |
| 6 | 19 (9.1%) | 28 (8.7%) | 10 (13.2%) | 6 (10.3%) | 9 (12.7%) | 72 (9.8%) |
| 7 | 16 (7.7%) | 30 (9.3%) | 6 (7.9%) | 4 (6.9%) | 7 (9.9%) | 63 (8.6%) |
| 8 | 12 (5.7%) | 27 (8.4%) | 7 (9.2%) | 6 (10.3%) | 3 (4.2%) | 55 (7.5%) |
| 9 | 9 (4.3%) | 21 (6.5%) | 2 (2.6%) | 6 (10.3%) | 3 (4.2%) | 41 (5.6%) |
| 10 | 9 (4.3%) | 20 (6.2%) | 0 (0.0%) | 4 (6.9%) | 5 (7.0%) | 38 (5.2%) |
| 11 | 11 (5.3%) | 13 (4.0%) | 1 (1.3%) | 3 (5.2%) | 5 (7.0%) | 33 (4.5%) |
| 12 | 7 (3.4%) | 13 (4.0%) | 4 (5.3%) | 2 (3.4%) | 4 (5.6%) | 30 (4.1%) |
| All ages | 209 (100.0%) | 323 (100.0%) | 76 (100.0%) | 58 (100.0%) | 71 (100.0%) | 737 (100.0%) |
Percentages refer to percentage of observations by subgroup
ImpD: imprinting defect, UPD: paternal uniparental disomy
Developmental Trajectories Across Different Molecular Subtypes by Domain
Table 3 shows the model estimates for age-equivalent scores by domain. The intercept is the model-predicted age-equivalent score for class II deletion at the age of 6. The fixed-effect estimates indicate how much the model-predicted age-equivalent score differs from the reference group (i.e., class II deletion) for each subtype at the age of 6 and whether the difference is statistically significant. Table 4 presents means () and slopes (b) of the different subtypes and the results of pairwise tests of subtypes against each other (not just the reference group as seen in Table 3). Preliminary evaluation of the data set indicated considerable variation between participants by molecular subtype in age equivalents and growth score equivalents at baseline and over time. These differences are described by domain below.
Table 3.
Model estimates for Bayley-III age equivalent (in months) across different molecular subtypes within each developmental domain
| Cognitive | Communication | Motor skills | |||
|---|---|---|---|---|---|
| Receptive | Expressive | Fine | Gross | ||
| Fixed effects | |||||
| Intercept | 15.11 (0.52)*** | 12.31 (0.61)*** | 8.39 (0.40)*** | 13.04 (0.71)*** | 14.23 (0.51)*** |
| Age 6 (year) | 0.91 (0.11)*** | 0.72 (0.13)*** | 0.17 (0.09) | 0.86 (0.16)*** | 0.94 (0.11)*** |
| Subtype | |||||
| Class I deletion | −0.43 (0.84) | −0.87 (0.98) | −0.12 (0.65) | −0.56 (1.13) | −0.27 (0.81) |
| Class II deletion (ref.) | (ref.) | (ref.) | (ref.) | (ref.) | (ref.) |
| UBE3A mutation | 11.96 (1.09)*** | 12.26 (1.29)*** | 6.60 (0.86)*** | 16.10 (1.45)*** | 7.83 (1.04)*** |
| ImpD | 10.00 (1.32)*** | 11.35 (1.55)*** | 4.87 (1.03)*** | 14.43 (1.77)*** | 8.56 (1.28)*** |
| UPD | 7.41 (1.08)*** | 9.10 (1.27)*** | 5.48 (0.85)*** | 10.37 (1.45)*** | 4.63 (1.05)*** |
| Interaction | |||||
| Age 6*Class I deletion | 0.14 (0.17) | −0.04 (0.21) | 0.10 (0.14) | 0.17 (0.25) | 0.05 (0.17) |
| Age 6*Class II deletion (ref.) | (ref.) | (ref.) | (ref.) | (ref.) | (ref.) |
| Age 6*UBE3A mutation | 1.32 (0.24)*** | 1.79 (0.30)*** | 0.92 (0.21)*** | 2.18 (0.34)*** | 0.85 (0.24)*** |
| Age 6*ImpD | 0.30 (0.29) | 0.83 (0.35)* | −0.20 (0.24) | 1.43 (0.43)*** | −0.16 (0.30) |
| Age 6*UPD | 0.39 (0.26) | 0.54 (0.32) | 0.00 (0.23) | 1.34 (0.37)*** | −0.00 (0.27) |
| Random effects | |||||
| Intercept | 20.04 (2.46)*** | 26.80 (3.38)*** | 11.49 (1.58)*** | 35.20 (4.37)*** | 18.39 (2.19)*** |
| Age 6 (year) | 0.43 (0.10)*** | 0.55 (0.14)*** | 0.15 (0.06)** | 1.15 (0.20)*** | 0.39 (0.11)*** |
| Residual | 4.76 (0.35)*** | 8.27 (0.62)*** | 5.22 (0. 38)*** | 8.66 (0.61)*** | 5.32 (0.40)*** |
p < .05,
p < .01,
p < .001
Table 4.
Pairwise tests of differences in Age-equivalent mean (in months) and slope at 6 years of age by subtype (with Bonferroni adjustments)
| Domain | Subtype | Mean () | Slope (b) | Mean | Slope | ||||||||
|---|---|---|---|---|---|---|---|---|---|---|---|---|---|
| Class I deletion | Class II deletion | UBE3A mutation | ImpD | UPD | Class I deletion | Class II deletion | UBE3A mutation | ImpD | UPD | ||||
| Cognitive | Class I deletion | 14.7 | 1.0 | ||||||||||
| Class II deletion | 15.1 | 0.9 | |||||||||||
| UBE3A mutation | 27.1 | 2.2 | *** | *** | *** | *** | |||||||
| ImpD | 25.1 | 1.2 | *** | *** | ** | ||||||||
| UPD | 22.5 | 1.3 | *** | *** | ** | ** | |||||||
| Receptive communication | Class I deletion | 11.4 | 0.7 | ||||||||||
| Class II deletion | 12.3 | 0.7 | |||||||||||
| UBE3A mutation | 24.6 | 2.5 | *** | *** | *** | *** | |||||||
| ImpD | 23.7 | 1.6 | *** | *** | * | * | * | ||||||
| UPD | 21.4 | 1.3 | *** | *** | ** | ||||||||
| Expressive communication | Class I deletion | 8.3 | 0.3 | ||||||||||
| Class II deletion | 8.4 | 0.2 | |||||||||||
| UBE3A mutation | 15.0 | 1.1 | *** | *** | *** | *** | |||||||
| ImpD | 13.3 | 0.0 | *** | *** | *** | ||||||||
| UPD | 13.9 | 0.2 | *** | *** | ** | ||||||||
| Fine motor | Class I deletion | 12.5 | 1.0 | ||||||||||
| Class II deletion | 13.0 | 0.9 | |||||||||||
| UBE3A mutation | 29.1 | 3.0 | *** | *** | *** | *** | |||||||
| ImpD | 27.5 | 2.3 | *** | *** | ** | *** | |||||||
| UPD | 23.4 | 2.2 | *** | *** | * | ** | *** | ||||||
| Gross motor | Class I deletion | 14.0 | 1.0 | ||||||||||
| Class II deletion | 14.2 | 0.9 | |||||||||||
| UBE3A mutation | 22.1 | 1.8 | *** | *** | ** | *** | |||||||
| ImpD | 22.8 | 0.8 | *** | *** | ** | ||||||||
| UPD | 18.9 | 0.9 | *** | *** | ** | ||||||||
ImpD: imprinting defect, UPD: paternal uniparental disomy
p < .05;
p < .01;
p < .001
Cognitive
At age 6 years, all non-deletion subtypes had a statistically significant higher age-equivalent score than class II deletion (, SE = 3.17) with the UBE3A variant subtype demonstrating the highest overall age equivalent scores (, SE = 1.68) (Tables 3 and 4). The fixed effect of age at 6 (years) is the slope of the reference group (i.e. class II deletion) which as indicated in Table 3 increases at a statistically significant rate of 0.91 months/year (p < .001). Slopes of other subtypes are calculated by adding the model-estimated interaction term to the fixed effect of age. For example, for the UBE3A pathogenic variant subtype, the rate of change is 1.32 months higher than class II deletion (b = 0.91 [SE = 0.11], p < .001) resulting in a slope of 2.2 months/year (Table 4) for the cognitive age-equivalent score, which is nearly twice that of the other subtypes.
Analyses of the growth score equivalents also showed that the UBE3A pathogenic variant (, SE = 6.62), and the ImpD (, SE = 7.98) molecular subtypes had higher overall cognitive growth scores at age 6 compared to the UPD (, SE = 6.57), class I deletion (, SE = 5.09) and class II deletion (, SE = 3.17) subtypes (Tables 5 and 6). Those with the UBE3A variant subtype had the fastest rate of increase in growth scores (b = 11.3 points/year, SE = 1.68), which was significantly higher compared to the class I deletion (b = 7.5 points/year, SE = 0.18) and class II deletion subtypes (b = 6.0 points/year, SE = 0.74) (Table 6).
Table 5.
Model estimates for Bayley-III growth score equivalents across different molecular subtypes within each developmental domain
| Cognitive | Communication | Motor Skills | |||
|---|---|---|---|---|---|
| Receptive | Expressive | Fine | Gross | ||
| Fixed effects | |||||
| Intercept | 530.22 (3.17)*** | 495.37 (4.63)*** | 449.13 (3.64)*** | 517.94 (3.77)*** | 537.60 (3.41)*** |
| Age 6 (year) | 6.03 (0.74)*** | 5.71 (1.02)*** | 1.36 (0.77) | 5.92 (0.85)*** | 9.56 (0.88)*** |
| Subtype | |||||
| Class I deletion | −3.00 (5.09) | −7.98 (7.44) | −1.65 (5.84) | −4.64 (6.05) | −2.45 (5.49) |
| Class II deletion (ref.) | (ref.) | (ref.) | (ref.) | (ref.) | (ref.) |
| UBE3A mutation | 67.68 (6.62)*** | 90.50 (9.79)*** | 59.39 (7.76)*** | 80.42 (7.76)*** | 47.07 (7.02)*** |
| ImpD | 58.49 (7.98)*** | 86.18 (11.75)*** | 44.80 (9.34)*** | 74.46 (9.47)*** | 49.90 (8.61)*** |
| UPD | 44.13 (6.57)*** | 71.17 (9.69)*** | 50.74 (7.71)*** | 56.19 (7.79)*** | 32.10 (7.13)*** |
| Interaction | |||||
| Age 6*Class I deletion | 1.45 (0.18) | 0.01 (1.63) | 0.95 (1.23) | 1.08 (1.35) | 0.98 (1.40) |
| Age 6*Class II deletion (ref.) | (ref.) | (ref.) | (ref.) | (ref.) | (ref.) |
| Age 6*UBE3A mutation | 5.22 (1.68)** | 10.31 (2.37)*** | 7.91 (1.84)*** | 7.34 (1.90) *** | 0.13 (1.98) |
| Age 6*ImpD | 1.16 (2.02) | 4.68 (2.79) | −1.41 (2.11) | 2.93 (2.31) | −6.49 (2.44)** |
| Age 6*UPD | 0.89 (1.79) | 2.24 (2.59) | 0.64 (2.04) | 3.53 (2.07) | −4.64 (2.16)* |
| Random effects | |||||
| Intercept | 693.63 (91.93)*** | 1485.28 (195.7)*** | 940.08 (127.2)*** | 972.90 (127.42)*** | 746.07 (109.37)*** |
| Age 6 (year) | 22.04 (5.55)*** | 27.94 (8.34)*** | 10.97 (4.90)* | 24.58 (5.87)*** | 33.29 (8.14)*** |
| Residual | 175.69 (13.65)*** | 593.01 (43.19)*** | 433.09 (31.57)*** | 320.65 (23.31)*** | 270.47 (21.24)*** |
ImpD: imprinting defect, UPD: paternal uniparental disomy
p < .05;
p < .01;
p < .001
Table 6.
Pairwise tests of differences in growth score equivalents mean and slope at 6 years of age by subtype (with Bonferroni adjustments)
| Domain | Subtype | Mean () | Slope (b) | Mean | Slope | ||||||||
|---|---|---|---|---|---|---|---|---|---|---|---|---|---|
| Class I deletion | Class II deletion | UBE3A mutation | ImpD | UPD | Class I deletion | Class II deletion | UBE3A mutation | ImpD | UPD | ||||
| Cognitive | Class I deletion | 527.2 | 7.5 | ||||||||||
| Class II deletion | 530.2 | 6.0 | |||||||||||
| UBE3A mutation | 597.9 | 11.3 | *** | *** | * | ** | |||||||
| ImpD | 588.7 | 7.2 | *** | *** | |||||||||
| UPD | 574.4 | 6.9 | *** | *** | * | ||||||||
| Receptive communication | Class I deletion | 487.4 | 5.7 | ||||||||||
| Class II deletion | 495.4 | 5.7 | |||||||||||
| UBE3A mutation | 585.9 | 16.0 | *** | *** | *** | *** | |||||||
| ImpD | 581.6 | 10.4 | *** | *** | |||||||||
| UPD | 566.6 | 7.9 | *** | *** | * | ||||||||
| Expressive communication | Class I deletion | 447.5 | 2.3 | ||||||||||
| Class II deletion | 449.1 | 1.4 | |||||||||||
| UBE3A mutation | 508.5 | 9.3 | *** | *** | *** | *** | |||||||
| ImpD | 493.9 | −0.1 | *** | *** | *** | ||||||||
| UPD | 499.9 | 2.0 | *** | *** | ** | ||||||||
| Fine Motor | Class I deletion | 513.3 | 7.0 | ||||||||||
| Class II deletion | 517.9 | 5.9 | |||||||||||
| UBE3A mutation | 598.4 | 13.3 | *** | *** | ** | *** | |||||||
| ImpD | 592.4 | 8.9 | *** | *** | |||||||||
| UPD | 574.1 | 9.4 | *** | *** | |||||||||
| Gross motor | Class I deletion | 535.2 | 10.5 | ||||||||||
| Class II deletion | 537.6 | 9.6 | |||||||||||
| UBE3A mutation | 584.7 | 9.7 | *** | *** | |||||||||
| ImpD | 587.5 | 3.1 | *** | *** | ** | ** | * | ||||||
| UPD | 569.7 | 4.9 | *** | *** | * | * | |||||||
ImpD: imprinting defect, UPD: paternal uniparental disomy
p < .05;
p < .01;
p < .001
Receptive Communication
At age 6, the mean age equivalents for the receptive communication domain for the two deletion subtypes were 11.4 months (SD = 0.98) for class I and 12.3 months (SD = 0.61) for class II, while for the non-deletion subtypes, the mean age equivalents were between 21.4 and 24.6 months, which were significantly higher than those for each of the two deletion subtypes (Tables 3 and 4).
The non-deletion AS participants also had significantly higher receptive communication age and growth score equivalents compared to those with a deletion (Tables 4 and 6; Figs. 3b and 4b). Although the UBE3A variant subtype had the highest rate of increase in age and growth score equivalents, those with ImpD also had a significantly higher rate of increase compared to the deletion subtypes in both age-equivalents and growth score equivalents (Tables 4 and 6; Figs. 3b and 4b).
Fig. 3.
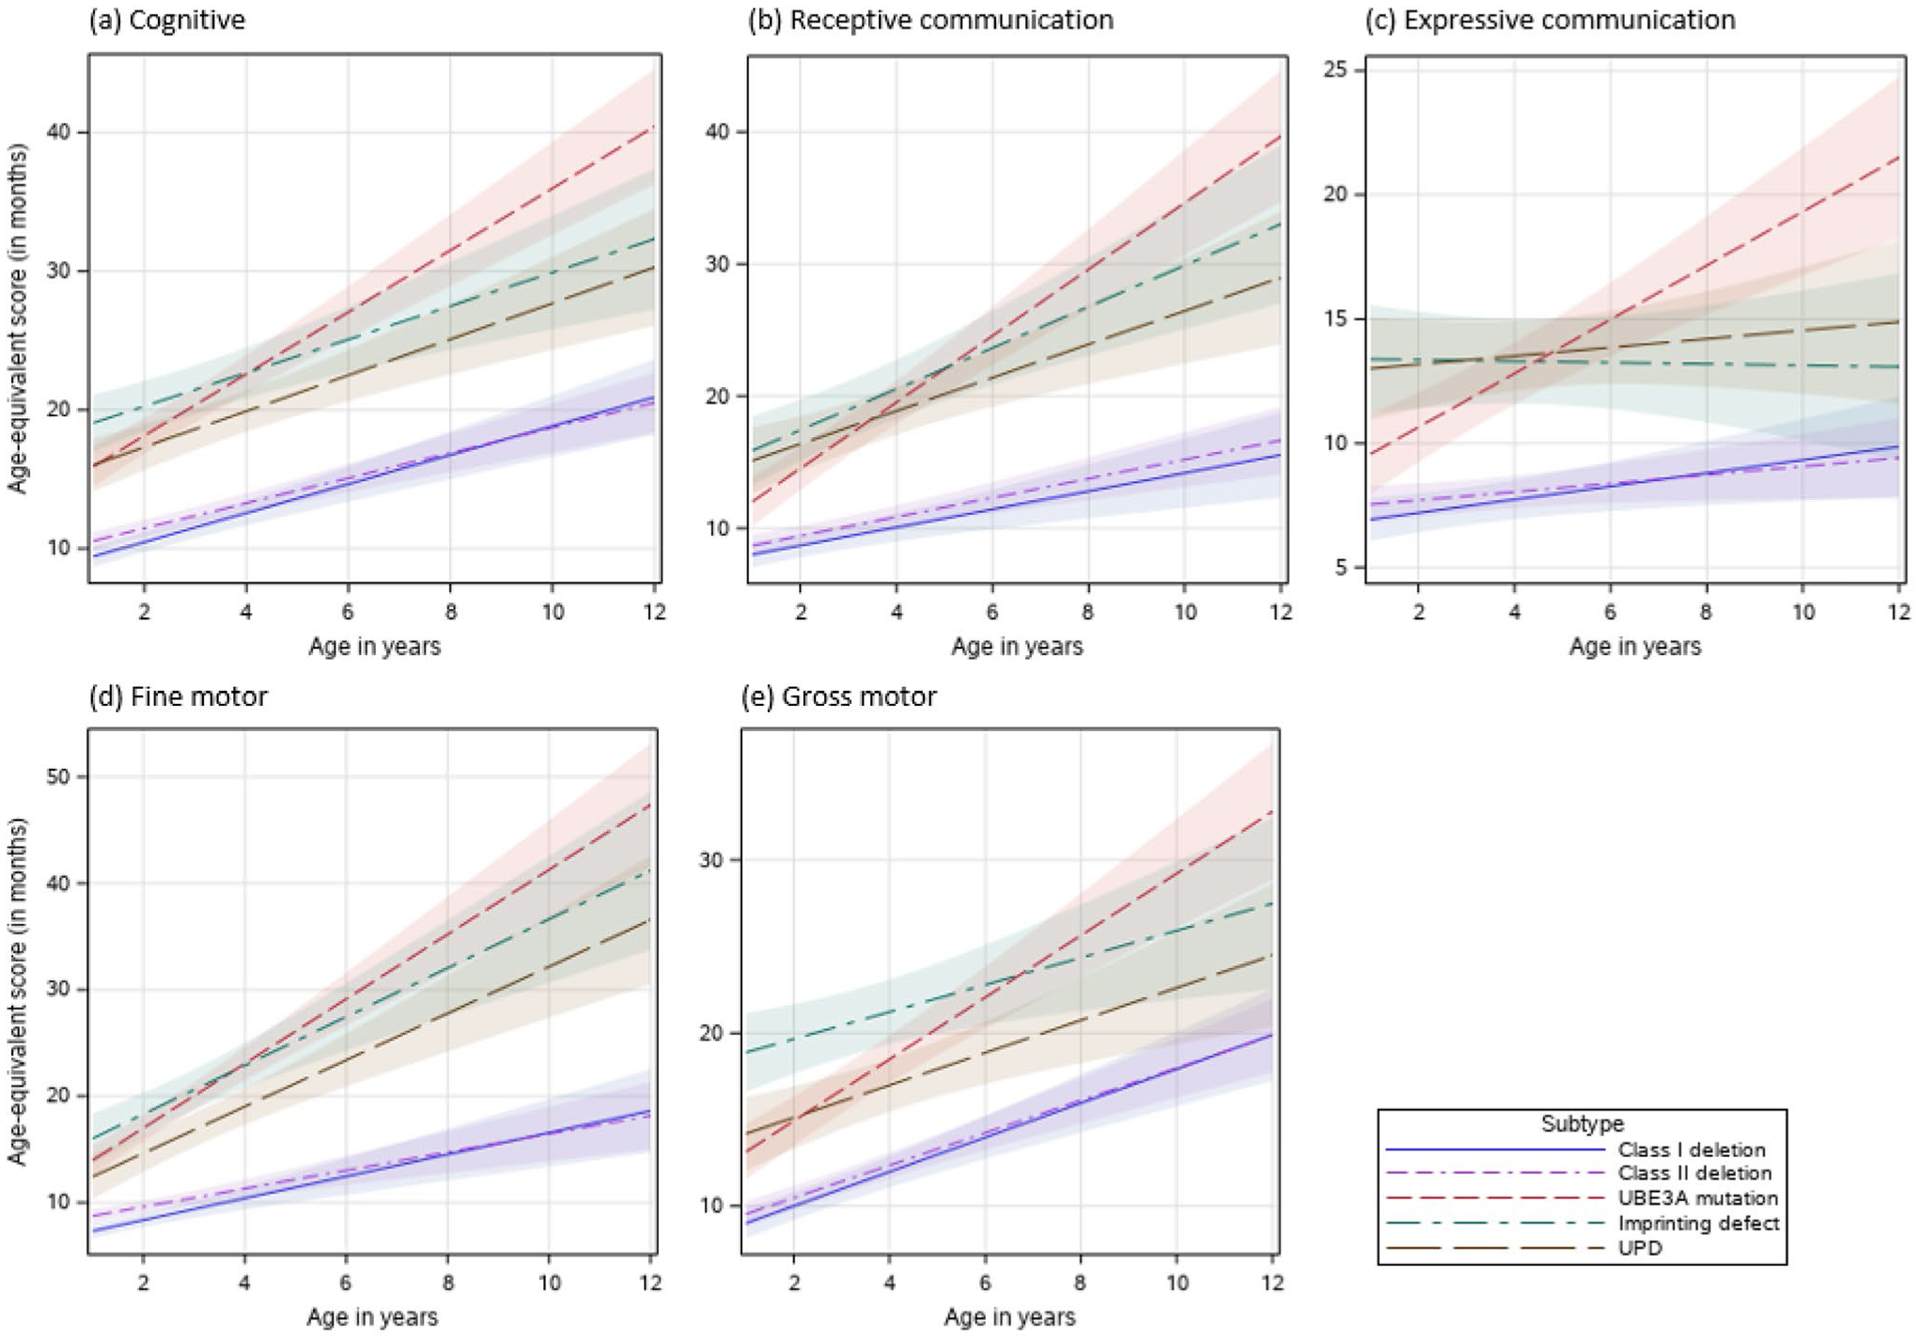
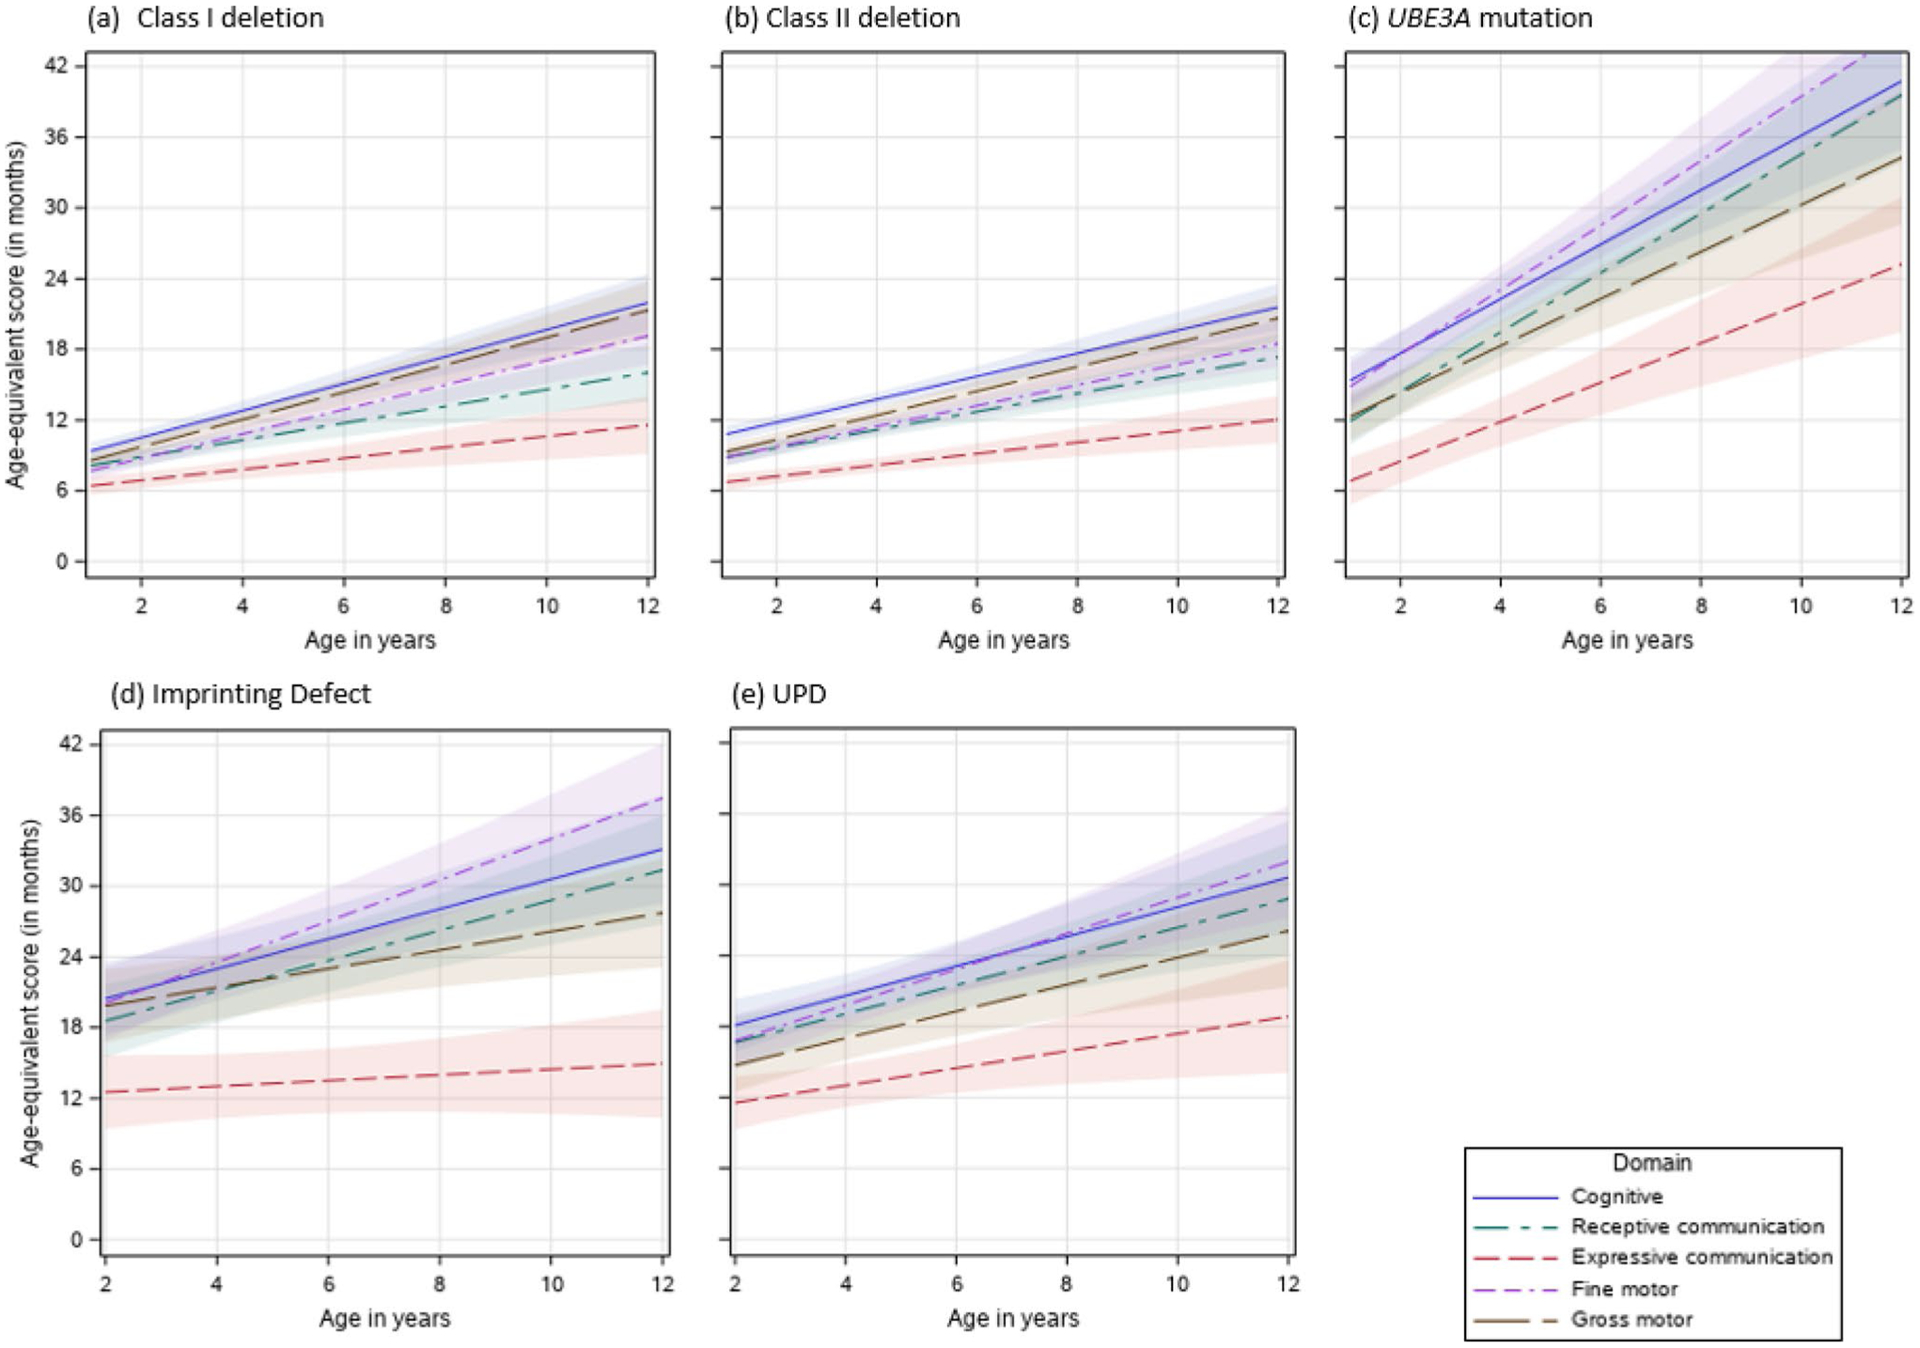
(a–e) Effects plots of Bayley-III Age-equivalent scores for each developmental domain and molecular subtype
Fig. 4.
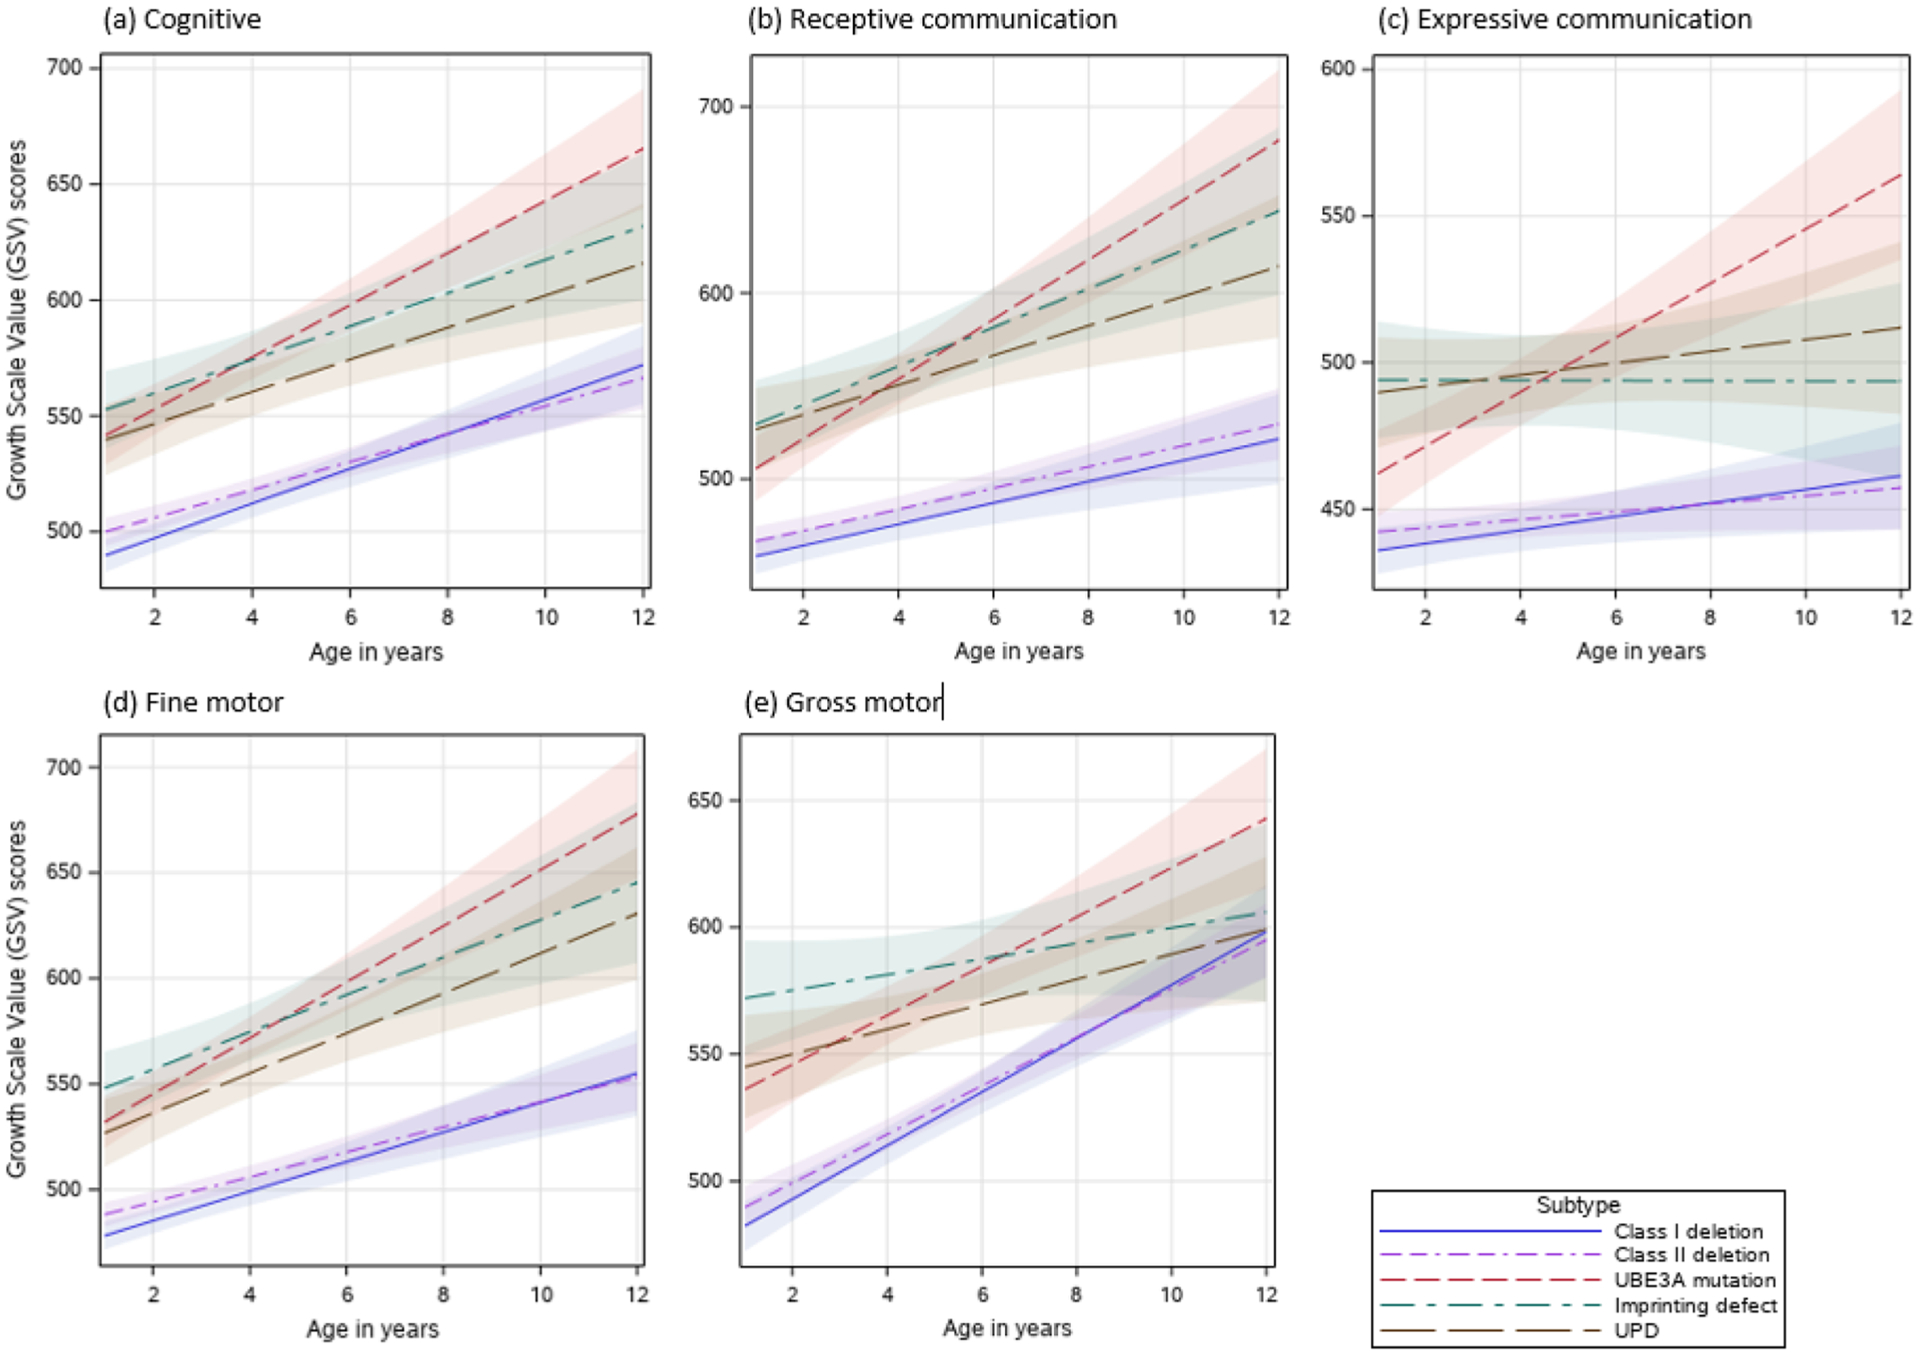
(a–e) Effects plots of Bayley-III Growth Scale Value (GSV) scores for each developmental domain and molecular subtype
Expressive Communication
Participants with non-deletion AS had significantly stronger expressive communication skills based on age-equivalents and growth score equivalents at age 6 than those with deletion (Tables 4 and 6, and Figs. 3c and 4c); however, only those with a UBE3A pathogenic variant showed a significantly steeper rate of growth for both age-equivalents (b = 1.1 month/year, SE = 0.21) and growth score equivalents (b = 9.3 points/year, SE = 1.84) compared to all other molecular subtypes (Tables 4 and 6).
Fine Motor
Like the other domains, the deletion subtypes had the lowest mean age-equivalent and growth score equivalents at age 6 years in the fine motor domain (Tables 4 and 6). Class I and class II deletion subtypes also had the lowest rates of growth in both age equivalent and growth score equivalent; these results were not statistically different among the different non-deletion subtypes (Tables 4 and 6).
Gross Motor
In the gross motor domain, class I and class II deletion subtypes had significantly lower scores than the other molecular subtypes in both the age-equivalent and growth score equivalents. Only those with a UBE3A pathogenic variant had a statistically significantly higher rate of growth (b = 1.8 months/year, SE = 0.24) compared to all other molecular types for age-equivalent scores (Tables 3 and 4). However, for growth score equivalents, the deletion groups bClass I = 10.5 points/year, bClass II = 9.6 points/year) and UBE3A subtypes (b = 9.7 points/year, SE = 0.24) had a higher rate of growth compared to those with UPD (b = 4.9 points/year, SE = 2.16) and ImpD (3.1 points/year, SE = 2.44) subtypes (Tables 5 and 6).
Developmental Trajectories of Different Domains Within Each Molecular Subtype
Having examined the developmental trajectories across the different molecular subtypes for each domain, we then sought to identify strengths and weaknesses in development within each molecular subtype. For this, we used the LMM estimates based on age-equivalents (Table 7 and Fig. 5a–e). Least squares means was also calculated to identify relative strengths and weaknesses among the different developmental domains (Table 8). These analyses showed that in all participants regardless of molecular etiology, expressive communication was a significant weakness relative to all other developmental domains (Table 8 and Fig. 5). This was the only finding that was consistent across molecular subtypes; profiles of the strengths and weaknesses of each molecular subtype are described below.
Table 7.
Model estimates for Bayley-III age-equivalent scores (in months) for developmental domains in each molecular subtype
| Class I deletion | Class II deletion | UBE3A mutation | ImpD | UPD | |
|---|---|---|---|---|---|
| Fixed effects | |||||
| Intercept | 12.92 (0.58)*** | 13.23 (0.45)*** | 28.54 (1.39)*** | 27.04 (1.39)*** | 22.85 (1.07)*** |
| Age 6 (year) | 1.04 (0.12)*** | 0.87 (0.11)*** | 2.73 (0.29)*** | 1.74 (0.27)*** | 1.51 (0.29)*** |
| Domain | |||||
| Cognitive | 2.19 (0.26)*** | 2.48 (0.20)*** | −1.63 (0.76)* | −1.51 (0.77) | 0.26 (0.66) |
| Receptive language | −1.17 (0.26)*** | −0.50 (0.20)* | −4.04 (0.76)*** | −3.34 (0.77)*** | −1.34 (0.66)* |
| Expressive language | −4.15 (0.26)*** | −4.07 (0.20)*** | −13.34 (0.76)*** | −13.53 (0.77)*** | −8.38 (0.66)*** |
| Fine motor (ref.) | (ref.) | (ref.) | (ref.) | (ref.) | (ref.) |
| Gross motor | 1.46 (0.26)*** | 1.24 (0.20)*** | −6.24 (0.75)*** | −4.04 (0.77)*** | −3.57 (0.66)*** |
| Interaction | |||||
| Age 6*Cognitive | 0.10 (0.08) | 0.10 (0.07) | −0.43 (0.27) | −0.47 (0.29) | −0.27 (0.22) |
| Age 6*Receptive language | −0.33 (0.08)*** | −0.10 (0.07) | −0.22 (0.27) | −0.46 (0.29) | −0.30 (0.22) |
| Age 6*Expressive language | −0.57 (0.08)*** | −0.39 (0.07)*** | −1.06 (0.27)*** | −1.50 (0.29)*** | −0.78 (0.22)*** |
| Age 6*Fine motor | (ref.) | (ref.) | (ref.) | (ref.) | (ref.) |
| Age 6*Gross motor | 0.12 (0.08) | 0.16 (0.07)* | −0.74 (0.27)** | −0.95 (0.29)** | −0.38 (0.22) |
| Random effects | |||||
| Intercept | 16.08 (3.48)*** | 13.57 (2.58)*** | 44.87 (12.95)*** | 25.19 (10.31)** | 21.75 (7.19)** |
| Age 6 (year) | 0.43 (0.12)*** | 0.54 (0.14)*** | 0.88 (0.39)* | 0.16 (0.22) | 0.77 (0.46)* |
| Residual | 6.64 (0.31)*** | 6.46 (0.25)*** | 18.24 (1.44)*** | 15.11 (1.42)*** | 14.34 (1.20)*** |
ImpD: imprinting defect, UPD: paternal uniparental disomy
p < .05
p < .01
p < .001
Fig. 5.
(a–e) Effects plots of Bayley-III Age-equivalent scores for each developmental domain and molecular subtype
Table 8.
Pairwise tests of differences in Age-equivalent mean (in months) and slope at 6 years of age by domain (with Bonferroni adjustments)
| Subtype | Domain | Mean () | Slope (b1) | Mean | Slope | ||||||||
|---|---|---|---|---|---|---|---|---|---|---|---|---|---|
| Cognitive | Receptive com. | Expressive com. | Fine motor | Gross motor | Cognitive | Receptive com. | Expressive com. | Fine motor | Gross motor | ||||
| Class I deletion | Cognitive | 15.1 | 1.1 | ||||||||||
| Receptive com. | 11.7 | 0.7 | *** | *** | |||||||||
| Expressive com. | 8.8 | 0.5 | *** | *** | *** | ** | |||||||
| Fine motor | 12.9 | 1.0 | *** | *** | *** | *** | *** | ||||||
| Gross motor | 14.4 | 1.2 | *** | *** | *** | *** | *** | ||||||
| Class II deletion | Cognitive | 15.7 | 1.0 | ||||||||||
| Receptive com. | 12.7 | 0.8 | *** | ** | |||||||||
| Expressive com. | 9.2 | 0.5 | *** | *** | *** | *** | |||||||
| Fine motor | 13.2 | 0.9 | *** | *** | *** | ||||||||
| Gross motor | 14.5 | 1.0 | *** | *** | *** | *** | *** | *** | * | ||||
| UBE3A mutation | Cognitive | 26.9 | 2.3 | ||||||||||
| Receptive com. | 24.5 | 2.5 | * | ||||||||||
| Expressive com. | 15.2 | 1.7 | *** | *** | * | ** | |||||||
| Fine motor | 28.5 | 2.7 | *** | *** | *** | ||||||||
| Gross motor | 22.3 | 2.0 | *** | * | *** | *** | ** | ||||||
| ImpD | Cognitive | 25.5 | 1.3 | ||||||||||
| Receptive com. | 23.7 | 1.3 | |||||||||||
| Expressive com. | 13.5 | 0.2 | *** | *** | *** | *** | |||||||
| Fine motor | 27.0 | 1.7 | *** | *** | *** | ||||||||
| Gross motor | 23.0 | 0.8 | * | *** | *** | ** | |||||||
| UPD | Cognitive | 23.1 | 1.2 | ||||||||||
| Receptive com. | 21.5 | 1.2 | |||||||||||
| Expressive com. | 14.5 | 0.7 | *** | *** | * | * | |||||||
| Fine motor | 22.9 | 1.5 | *** | *** | |||||||||
| Gross motor | 19.3 | 1.1 | *** | ** | *** | *** | |||||||
ImpD: imprinting defect, UPD: paternal uniparental disomy
p < .05;
p < .01;
p < .001
Class I Deletions
In the class I deletion subtype, cognitive (, SE = 0.26) and gross motor skills (, SE = 0.26) were the strongest skills while expressive language skills (, SE = 0.26) was the weakest (see Table 8). Rates of gain in developmental skills were similar for cognitive (b = 1.1 months/year, SE = 0.08), fine motor (b = 1.0 months/year, SE = 0.08) and gross motor (b = 1.2 months/year, SE = 0.08) domains, all of which were higher than those of receptive (b = 0.7 months/year, SE = 0.08) and expressive communication (b = 0.5 months/year, SE = 0.08) (Table 8).
Class II Deletions
Similar to the class I deletion subtype, at age 6, class II deletion subtype had the highest mean age-equivalent score in the cognitive domain (, SE = 0.20) and the lowest mean age equivalent score in the expressive language domain (, SE = 0.20). Rates of growth over time were highest for the cognitive and gross motor domains, while the lowest rate of growth occurred in the expressive language domains. Fine motor and receptive communication skills were similar in overall age equivalent scores at age 6 as well as rates of skill development; both were significantly lower than cognitive and gross motor skills, but significantly higher than expressive communication skills (Table 8, Fig. 5b).
UBE3A Pathogenic Variant
Children with a UBE3A pathogenic variant had relative strength in the fine motor and cognitive domain with higher overall age equivalent scores at age 6, but relative weakness in expressive communication (Table 8, Fig. 5c). Rates of growth were greater than 2.0 months/year for the cognitive, receptive communication, fine and gross motor domains.
ImpD
Children with an ImpD had highest mean age equivalent score at age 6 (, SE = 0.75) and highest rate of growth (b = 1.7 months/year, SE = 0.29) in the fine motor domain, but the lowest mean age equivalent score (, SE = 0.75) and slowest growth (b = 0.2 months/year, SE = 0.29) in expressive language skills. Rates of growth were similar for the cognitive and receptive language domains. These profiles are illustrated in Table 8 and Fig. 5d.
UPD
Children with UPD had relative strength in cognitive, fine motor, and receptive communication domains, with relative weakness in the expressive communication domain in terms of both mean age equivalent scores at age 6 and rate of growth. These profiles are illustrated in Table 8 and Fig. 5e.
Discussion
This study used data from the AS natural history study, which has the largest known collection of longitudinal developmental data in AS. Providing an overview of the natural history of core developmental domains is critical to advancing our understanding of this condition and provides baseline data for the assessment of therapeutic efficacy in future clinical trials. Our primary goal was to describe in detail the skills attained by children with AS in the first 12 years of life, focusing on differences in overall scores and how these ‘scores’ in the different developmental domains changed over time among and within the different molecular subtypes of AS. For the purposes of this paper, we focused our analyses on age equivalent scores and growth score equivalents.
The current analysis demonstrated that when using age-equivalent scores to estimate cognitive development, at six years of age, children with AS were demonstrating skills at approximately a 14-to-27-month developmental level, making developmental gains of around 1–2 months/year depending on the molecular subtype (Table 4). These results are similar to previous reports of developmental skill attainment in AS (Peters et al. 2004; Sahoo et al. 2006), and they are generally consistent with clinical reports and other studies of functional abilities in this population (Brun Gasca et al. 2010; Di Nuovo and Buono 2011; Micheletti et al. 2016).
It is important to note that age-equivalent scores do not capture the full picture as multiple raw scores correspond to the same age equivalent score. In addition, the rate of change in age equivalent scores across different ages are not comparable. Hence, age equivalent scores may not be sufficiently sensitive in capturing small changes in development. Researchers have therefore recommended the use of “person ability scores” such as growth score equivalents in analyzing the development of individuals with severe neurodevelopmental disorders since these scores are more sensitive for capturing changes within an individual over time (Farmer et al. 2020). Our analyses of growth score equivalents revealed that children with AS continued to gain skills through at least 12 years of age, which was the age cutoff in this study. Specifically, we found that, on average, children with AS continued to gain skills over time at a rate of approximately 1–16 growth score points/year depending on the domain and molecular subtype. This suggests that children with AS continue to learn new skills over time, however slowly it may be, and therefore they can benefit from ongoing intensive developmental interventions such as physical, occupational, and communication therapies.
Our study specifically highlighted similarities and differences in developmental outcomes across molecular subtypes. Compared to those with AS caused by ‘non-deletion’ etiologies, children with a deletion have lower scores at baseline and have a slower rate of gaining skills over time in all domains on the Bayley-III. This is consistent with prior studies that found that children with AS due to a chromosomal deletion have a more severe developmental phenotype compared to those with AS due to other molecular etiologies (Bindels-de Heus et al. 2020; Mertz et al. 2014). We also found no differences in the developmental profiles and trajectories for the two main classes of deletions, as previous authors have determined (Peters et al. 2012). Deletions are the most common genetic cause of AS, accounting for approximately 70% of cases (Bird 2014). They are also the primary target subtype for many of the emerging therapies that are being developed for AS. Treatments that can improve these developmental trajectories even modestly are likely to have a large impact on the quality of life for these individuals and their families.
UBE3A pathogenic variants, UPD, and ImpD (i.e., “non-deletion”) subtypes are often combined in studies exploring differences between molecular subtypes partly because they are rarer forms of AS compared to the deletion subtype. As a result, developmental differences between deletion and non-deletion forms of AS have been relatively well documented (Peters et al. 2004; Varela et al. 2004). However, understanding even slight differences between these non-deletion subtypes can be important for distinguishing the needs and prognoses for these children. The UBE3A pathogenic variant subtype demonstrated higher overall age equivalent scores and growth score equivalents as well as greater rates of skill attainment in all domains compared to other subtypes; consistent with previous studies (Lossie et al. 2001; Wheeler et al. 2019). The developmental profiles were generally similar for UPD and ImpD. Both subtypes generally had slightly lower overall age equivalent scores and growth score equivalents and slower rates of growth in both age equivalent scores and growth score equivalents compared to the UBE3A pathogenic variant subtype across all domains, but they had higher overall age equivalent scores and growth score equivalents than both deletion classes. In addition, both subtypes showed consistent growth in cognitive, fine motor, and receptive communication domains, but a significant weakness in expressive communication.
Relative weakness in expressive communication skills was found in all individuals regardless of molecular etiologies. Given the complex communication needs and challenges with speech production that is well documented in this population (Quinn and Rowland 2017), this was not an unexpected finding. However, it is important to note that scoring on the expressive communication subtest of the Bayley-III is limited to vocalizations heard or words said, and it does not allow credit for the use of alternative communication. Individuals with AS use a range of communication modalities including gestures, manual signs and augmentative and alternative communication (AAC) devices (Pearson et al. 2019; Quinn and Rowland 2017). If these alternative communication methods were considered, the estimated age equivalence for communication skills might be higher for some children with AS. We might also find differences in the communication skills and the use of different communication modalities among individuals with different etiologies of AS. It is important to consider these factors and include additional measures such as the Communication Matrix (Rowland and Fried-Oken 2010) or AAC assessments in order to truly understand the communication skills and needs of this population. Given the absence of speech, it is important that speech therapy in AS specifically target AAC. Indeed, studies have shown that use of AAC in AS improves overall communication skills (Roche et al. 2020).
Limitations
Although this is one of the largest longitudinal samples ever reported on AS, a major limitation is the variation in numbers of observations at different ages, particularly within some molecular subtypes. Hence, our results should be interpreted and generalized with caution given the small sample size at older ages and additional longer-term studies with larger sample sizes are warranted to confirm these findings.
Because the Bayley-III was designed for and normed in young children up to age 42½ months, the potential range of developmental skills and age-equivalent scores provided by the Bayley-III is limited. As a result, this measure cannot capture skills that would be expected in developmentally advanced children. However, many of the skills assessed on developmental measures like the Bayley-III (for example, object permanence) are necessary prerequisites for the development of the higher-order skills that are assessed on cognitive instruments designed for chronologically older children. As such, if the early developmental skills assessed on the Bayley-III are not attained, the child would not be expected to be able to complete tasks on tests that would be more age appropriate. It is critical to note, however, that children with AS exhibit a much wider range of skills than can be captured by any one developmental measure. There are other aspects of development, including functional communication and performance within their home and school environments, that are not captured in these analyses.
Unlike neurotypical children, those with Angelman syndrome may demonstrate scatter in their developmental skills such that they may not have acquired all the skills that are being assessed for a given developmental age. Because the Bayley-III was used out of the age norm with this population and the start points within the testing domains were not standardized, there may have been considerable variability in the item sets administered by different examiners across the study sites using their clinical judgment instead of testing standards to determine the most appropriate starting points. This could have resulted in inaccurate estimation of developmental skills. In addition, the Bayley-III still relies on verbal and fine motor performance (although to a lesser extent than other standardized cognitive measures), which may limit or penalize children with AS who have the cognitive ability to understand a task, but not the verbal or motoric ability to complete it. Furthermore, many of the items used to assess skills on the Bayley-III are not always developmentally appropriate for older children, so attention and motivation may impair performance. Unfamiliarity with the environment and the examiner can also contribute to reduced task performance. Despite these limitations, the Bayley-III can provide an estimate of the developmental level and capture subtle changes over time.
An additional limitation of this study is that participants were not consistently tested for mosaicism, the presence of which could ameliorate the AS phenotype through some cells retaining UBE3A expression. Additionally, while we had information on whether the child had a history of seizures as well as the age of the onset of seizures, there was significant variability among participants in the terms of the frequency of current seizures, use of seizure medications, and whether the seizures were well-controlled at the time of the neurodevelopmental evaluation in our study. As a result, seizure was not included as a co-variate in the current analyses. AS individuals with poorly-controlled seizures, even if subclinical or non-convulsive, make slower developmental progress and may even regress developmentally. Since those with a deletion are more likely to have seizures and tend to have more severe seizures (Bindels-de Heus et al. 2020), it is possible that the slower rate of neurodevelopment across all domains in some of those individuals with a deletion may be partly due to their having poorly-controlled seizures. Moreover, use of valproic acid as an anti-epileptic drug in AS has been shown to be associated with poor development or regression of motor skills, which can be reversed upon discontinuation of the medication (Shaaya et al. 2016), but some individuals with AS are still prescribed valproic acid, so that may negatively impact their neurodevelopment as well. Future studies should therefore focus on assessing the impact of seizures and seizure medication on the neurodevelopment in AS.
Conclusion
Using longitudinal data from the largest known cohort to date of participants from the AS Natural History study, we have confirmed previous reports that the developmental profiles in AS vary with molecular etiologies. Understanding the subtleties of development over time within and across molecular subtypes is critical in determining whether emerging treatments can improve the developmental trajectories in the different developmental domains. Our study can serve as a model for analyzing developmental outcomes in other conditions that result in severe to profound intellectual impairment such as severe (level 3) forms of autism and other rare genetic conditions, where longitudinal trajectories are not well characterized and traditional cognitive measures are not appropriate.
Acknowledgments
We are deeply appreciative of all the individuals with AS and families who participated in this longitudinal study and contributed to these data. We are also grateful to the other site principal investigators (Steven Skinner, Carlos Bacino, Logan Wink) and all the study coordinators for their efforts in recruiting the participants for the study. We thank Ionis Pharmaceuticals for its financial support for statistical analyses. Ionis Pharmaceuticals had no role or influence in the collection or analyses of these data in any way. A special thanks to Erin Sheldon and Terry Jo Bichell for their detailed review of our manuscript.
Funding
This study was supported by NIH U54 RR019478 (awarded to Arthur L. Beaudet) from the National Center for Research Resources (NCRR) and NIH U54 HD061222 (awarded to Alan K. Percy) from the National Institute of Child Health and Human Development (NICHD), both components of the National Institutes of Health (NIH).
Footnotes
Conflict of interest AW has consulted with Ionis Pharmaceuticals. All other authors have no conflicts of interest to disclose.
Consent to Participate Written consent was obtained from the legal guardian of each participant.
Ethical Approval This study was approved by the Institutional Review Boards at each study site.
References
- Andersen WH, Rasmussen RK, & Strømme P (2001). Levels of cognitive and linguistic development in Angelman syndrome: A study of 20 children. Logopedics Phoniatrics Vocology, 26(1), 2–9. 10.1080/14015430117324. [DOI] [PubMed] [Google Scholar]
- Bayley N (2006). Bayley scales of infant and toddler development: PsychCorp, Pearson. San Antonio, TX: Harcourt Assessment Inc.. [Google Scholar]
- Bindels-de Heus K, Mous SE, Ten Hooven-Radstaake M, van Iperen-Kolk BM, Navis C, Rietman AB, et al. (2020). An overview of health issues and development in a large clinical cohort of children with Angelman syndrome. American Journal of Medical Genetics. Part A, 182(1), 53–63. 10.1002/ajmg.a.61382. [DOI] [PMC free article] [PubMed] [Google Scholar]
- Bird LM (2014). Angelman syndrome: Review of clinical and molecular aspects. The Application of Clinical Genetics, 7, 93–104. 10.2147/TACG.S57386. [DOI] [PMC free article] [PubMed] [Google Scholar]
- Bode MM, D’Eugenio DB, Mettelman BB, & Gross SJ (2014). Predictive validity of the Bayley, at 2 years for intelligence quotient at 4 years in preterm infants. Journal of Developmental & Behavioral Pediatrics, 35(9), 570–575. 10.1097/DBP.0000000000000110. [DOI] [PubMed] [Google Scholar]
- Brun Gasca C, Obiols J, Bonillo A, Artigas J, Lorente I, Gabau E, … Turk J (2010). Adaptive behaviour in Angelman syndrome: Its profile and relationship to age. Journal of Intellectual Disability Research, 54(11), 1024–1029. doi: 10.1111/j.1365-2788.2010.01331.x. [DOI] [PubMed] [Google Scholar]
- Buntinx IM, Hennekam RC, Brouwer OF, Stroink H, Beuten J, Mangelschots K, & Fryns J-P (1995). Clinical profile of Angelman syndrome at different ages. American Journal of Medical Genetics, 56(2), 176–183. 10.1002/ajmg.1320560213. [DOI] [PubMed] [Google Scholar]
- Clayton-Smith J, & Laan L (2003). Angelman syndrome: A review of the clinical and genetic aspects. Journal of Medical Genetics, 40(2), 87–95. 10.1136/jmg.40.2.87. [DOI] [PMC free article] [PubMed] [Google Scholar]
- Dagli A, Buiting K, & Williams CA (2012). Molecular and clinical aspects of Angelman syndrome. Molecular Syndromology, 2(3–5), 100–112 doi: 000328837. [DOI] [PMC free article] [PubMed] [Google Scholar]
- Di Nuovo S, & Buono S (2011). Behavioral phenotypes of genetic syndromes with intellectual disability: Comparison of adaptive profiles. Psychiatry Research, 189(3), 440–445. 10.1016/j.psychres.2011.03.015. [DOI] [PubMed] [Google Scholar]
- Farmer C, Kaat A, Thurm A, Anselm I, Akshoomoff N, Bennett A, Berry L, Bruchey A, Barshop B, Berry-Kravis E, Bianconi S, Cecil K, Davis R, Ficicioglu C, Porter F, Wainer A, Goin-Kochel R, Leonczyk C, Guthrie W, et al. (2020). Person ability scores as an alternative to norm-referenced scores as outcome measures in studies of neurodevelopmental disorders. American Journal on Intellectual and Developmental Disabilities, 125(6), 475–480. 10.1352/1944-7558-125.6.475. [DOI] [PMC free article] [PubMed] [Google Scholar]
- Gentile JK, Tan W-H, Horowitz LT, Bacino CA, Skinner SA, Barbieri-Welge R, et al. (2010). A neurodevelopmental survey of Angelman syndrome with genotype-phenotype correlations. Journal of Developmental and Behavioral Pediatrics: JDBP, 31(7), 592. 10.1097/DBP.0b013e3181ee408e. [DOI] [PMC free article] [PubMed] [Google Scholar]
- Grieco JC, Ciarlone SL, Gieron-Korthals M, Schoenberg MR, Smith AG, Philpot RM, et al. (2014). An open-label pilot trial of minocycline in children as a treatment for Angelman syndrome. BMC Neurology, 14, 232. 10.1186/s12883-014-0232-x. [DOI] [PMC free article] [PubMed] [Google Scholar]
- Guerrini R, Carrozzo R, Rinaldi R, & Bonanni P (2003). Angelman syndrome. Pediatric Drugs, 5(10), 647–661. 10.2165/00148581-200305100-00001. [DOI] [PubMed] [Google Scholar]
- Lalande M, & Calciano M (2007). Molecular epigenetics of Angelman syndrome. Cellular and Molecular Life Sciences, 64(7–8), 947. 10.1007/s00018-007-6460-0. [DOI] [PMC free article] [PubMed] [Google Scholar]
- Lichtenberger EO (2005). General measures of cognition for the pre-school child. Mental Retardation and Developmental Disabilities Research Reviews, 11(3), 197–120. [DOI] [PubMed] [Google Scholar]
- Lossie AC, Whitney MM, Amidon D, Dong HJ, Chen P, Theriaque D, et al. (2001). Distinct phenotypes distinguish the molecular classes of Angelman syndrome. Journal of Medical Genetics, 38(12), 834–845. 10.1136/jmg.38.12.834. [DOI] [PMC free article] [PubMed] [Google Scholar]
- Luk HM, & Lo IF (2016). Angelman syndrome in Hong Kong Chinese: A 20 years’ experience. European Journal of Medical Genetics, 59(6–7), 315–319. 10.1016/j.ejmg.2016.05.003. [DOI] [PubMed] [Google Scholar]
- Mertz LG, Christensen R, Vogel I, Hertz JM, Nielsen KB, Gronskov K, & Ostergaard JR (2013). Angelman syndrome in Denmark. Birth incidence, genetic findings, and age at diagnosis. American Journal of Medical Genetics. Part A, 161A(9), 2197–2203. 10.1002/ajmg.a.36058. [DOI] [PubMed] [Google Scholar]
- Mertz LG, Thaulov P, Trillingsgaard A, Christensen R, Vogel I, Hertz JM, & Ostergaard JR (2014). Neurodevelopmental outcome in Angelman syndrome: Genotype-phenotype correlations. Research in Developmental Disabilities, 35(7), 1742–1747. 10.1016/j.ridd.2014.02.018. [DOI] [PubMed] [Google Scholar]
- Micheletti S, Palestra F, Martelli P, Accorsi P, Galli J, Giordano L, et al. (2016). Neurodevelopmental profile in Angelman syndrome: More than low intelligence quotient. Italian Journal of Pediatrics, 42(1), 91. 10.1186/s13052-016-0301-4. [DOI] [PMC free article] [PubMed] [Google Scholar]
- Oiglane-Shlik E, Talvik T, Zordania R, Poder H, Kahre T, Raukas E, et al. (2006). Prevalence of Angelman syndrome and Prader-Willi syndrome in Estonian children: Sister syndromes not equally represented. American Journal of Medical Genetics. Part A, 140(18), 1936–1943. 10.1002/ajmg.a.31423. [DOI] [PubMed] [Google Scholar]
- Pearson E, Wilde L, Heald M, Royston R, & Oliver C (2019). Communication in Angelman syndrome: A scoping review. Developmental Medicine and Child Neurology, 61(11), 1266–1274. 10.1111/dmcn.14257. [DOI] [PubMed] [Google Scholar]
- Peters SU, Beaudet AL, Madduri N, & Bacino CA (2004). Autism in Angelman syndrome: Implications for autism research. Clinical Genetics, 66(6), 530–536. 10.1111/j.1399-0004.2004.00362.x. [DOI] [PubMed] [Google Scholar]
- Peters SU, Horowitz L, Barbieri-Welge R, Taylor JL, & Hundley RJ (2012). Longitudinal follow-up of autism spectrum features and sensory behaviors in Angelman syndrome by deletion class. Journal of Child Psychology and Psychiatry, 53(2), 152–159. 10.1111/j.1469-7610.2011.02455.x. [DOI] [PubMed] [Google Scholar]
- Quinn ED, & Rowland C (2017). Exploring expressive communication skills in a cross-sectional sample of children and young adults with Angelman syndrome. American Journal of Speech-Language Pathology, 26(2), 369–382. 10.1044/2016_AJSLP-15-0075. [DOI] [PubMed] [Google Scholar]
- Roche L, Sigafoos J, & Trembath D (2020). Augmentative and alternative communication intervention for people with Angelman syndrome: A systematic review. Current Developmental Disorders Reports, 7(1), 28–34. [Google Scholar]
- Rowland C, & Fried-Oken M (2010). Communication matrix: A clinical and research assessment tool targeting children with severe communication disorders. Journal of Pediatric Rehabilitation Medicine, 3(4), 319–329. 10.3233/PRM-2010-0144. [DOI] [PubMed] [Google Scholar]
- Rubio-Codina M, & Grantham-McGregor S (2020). Predictive validity in middle childhood of short tests of early childhood development used in large scale studies compared to the Bayley-III, the family care indicators, height-for-age, and stunting: A longitudinal study in Bogota, Colombia. PLoS One, 15(4), e0231317. [DOI] [PMC free article] [PubMed] [Google Scholar]
- Sadhwani A, Sanjana NE, Willen JM, Calculator SN, Black ED, Bean LJ, et al. (2018). Two Angelman families with unusually advanced neurodevelopment carry a start codon variant in the most highly expressed UBE3A isoform. American Journal of Medical Genetics Part A, 176(7), 1641–1647. 10.1002/ajmg.a.38831. [DOI] [PMC free article] [PubMed] [Google Scholar]
- Sahoo T, Peters SU, Madduri NS, Glaze DG, German JR, Bird LM, et al. (2006). Microarray based comparative genomic hybridization testing in deletion bearing patients with Angelman syndrome: Genotype-phenotype correlations. Journal of Medical Genetics, 43(6), 512–516. 10.1136/jmg.2005.036913. [DOI] [PMC free article] [PubMed] [Google Scholar]
- SAS. (2017). SAS Enterprise Guide. Version 7.1 Cary, NC: SAS Institute Inc. [Google Scholar]
- Shaaya EA, Grocott OR, Laing O, & Thibert RL (2016). Seizure treatment in Angelman syndrome: A case series from the Angelman Syndrome Clinic at Massachusetts General Hospital. Epilepsy & Behavior: E&B, 60, 138–141. 10.1016/j.yebeh.2016.04.030. [DOI] [PubMed] [Google Scholar]
- Singer JD, & Willett JB (2003). Applied longitudinal data analysis: Modeling change and event occurrence. Oxford: Oxford University Press. [Google Scholar]
- Tan WH, Bacino CA, Skinner SA, Anselm I, Barbieri-Welge R, Bauer-Carlin A, et al. (2011). Angelman syndrome: Mutations influence features in early childhood. American Journal of Medical Genetics Part A, 155(1), 81–90. 10.1002/ajmg.a.33775. [DOI] [PMC free article] [PubMed] [Google Scholar]
- Tan WH, Bird LM, Sadhwani A, Barbieri-Welge RL, Skinner SA, Horowitz LT, et al. (2018). A randomized controlled trial of levodopa in patients with Angelman syndrome. American Journal of Medical Genetics. Part A, 176(5), 1099–1107. 10.1002/ajmg.a.38457. [DOI] [PMC free article] [PubMed] [Google Scholar]
- Varela MC, Kok F, Otto PA, & Koiffmann CP (2004). Phenotypic variability in Angelman syndrome: Comparison among different deletion classes and between deletion and UPD subjects. European Journal of Human Genetics, 12(12), 987. 10.1038/sj.ejhg.5201264. [DOI] [PubMed] [Google Scholar]
- Weiss LG, Oakland T, & Aylward GP (Eds.). (2010). Bayley-III clinical use and interpretation. New York: Academic Press. [Google Scholar]
- Wheeler AC, Okoniewski KC, Wylie A, DeRamus M, Hiruma LS, Toth D, & Christian RB (2019). Anxiety-associated and separation distress-associated behaviours in Angelman syndrome. Journal of Intellectual Disability Research, 63(10), 1234–1247. 10.1111/jir.12635. [DOI] [PubMed] [Google Scholar]
- Williams CA, Beaudet AL, Clayton-Smith J, Knoll JH, Kyllerman M, Laan LA, et al. (2006). Angelman syndrome 2005: Updated consensus for diagnostic criteria. American Journal of Medical Genetics Part A, 140(5), 413–418. 10.1002/ajmg.a.31074. [DOI] [PubMed] [Google Scholar]
- Wink LK, Fitzpatrick S, Shaffer R, Melnyk S, Begtrup AH, Fox E, et al. (2015). The neurobehavioral and molecular phenotype of Angelman Syndrome. American Journal of Medical Genetics. Part A, 167A(11), 2623–2628. 10.1002/ajmg.a.37254. [DOI] [PubMed] [Google Scholar]
- Yakoreva M, Kahre T, Zordania R, Reinson K, Teek R, Till-mann V, et al. (2019). A retrospective analysis of the prevalence of imprinting disorders in Estonia from 1998 to 2016. European Journal of Human Genetics, 27(11), 1649–1658. 10.1038/s41431-019-0446-x. [DOI] [PMC free article] [PubMed] [Google Scholar]